

dszc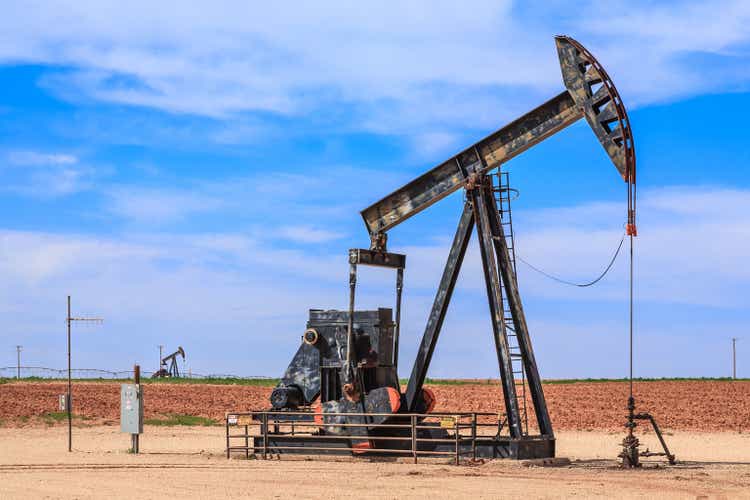
Part I – Introduction
Houston-based EOG Resources, Inc. (NYSE: NYSE:EOG) released its second quarter 2022 results on August 4, 2022.
Important note: This article is an update of my preceding article published on July 14, 2022. I have followed EOG on Seeking Alpha since 2016, with 25 articles published and counting.
EOG Resources produces from five Premium Basins and is essentially a pure-play U.S. producer. However, EOG Resources produces from its assets in Trinidad as well.
EOG Map Presentation (EOG Resources)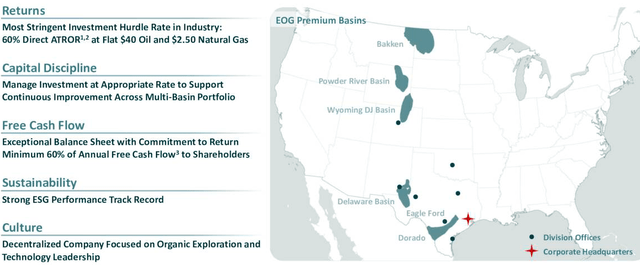
1 – 2Q22 Results Snapshot And Commentary
EOG Resources reported a second-quarter 2021 adjusted earnings per share of $2.74, missing analysts expectations. However, results significantly rebounded from the year-ago quarter’s earnings of $1.73 per share.
EOG 2Q22 highlights (EOG Resources)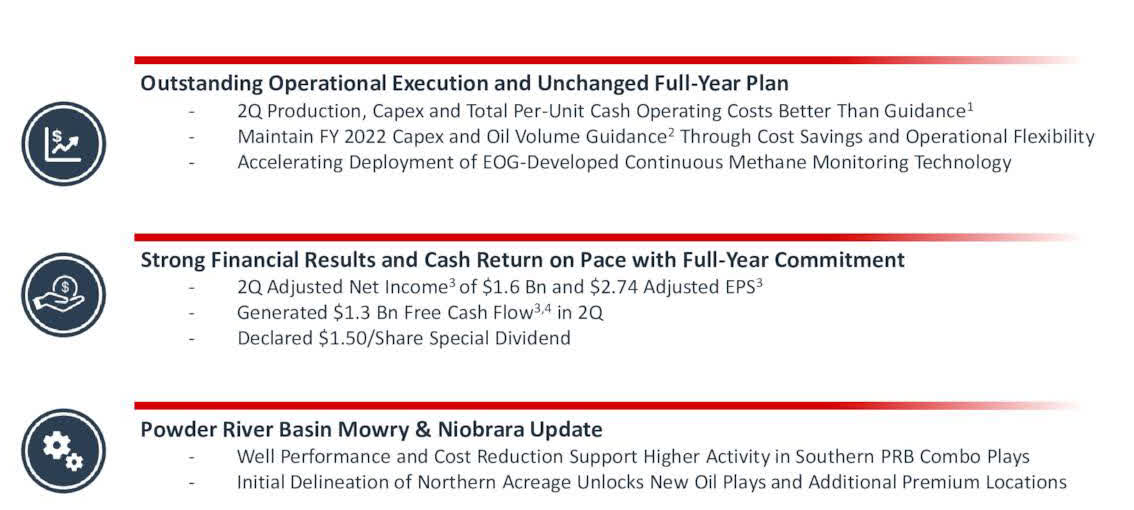
The total quarterly revenues rose to $7,407 million from the year-ago number of $4,139 million. Revenues were well above expectations.
Lower-than-expected earnings were due to higher leases, well expenses, and transportation costs, even if the adverse effects were partially offset by higher oil equivalent production and commodity prices.
EOG Resources announced a special dividend of $1.50 per share in 2Q22, adding to the regular $0.75 per share. The total dividend for 2Q22 is $2.25 per share.
EOG Resources’ total volumes increased 11% yearly to 83.8 million barrels of oil equivalent (MMBoe) on higher U.S. output. Cash operating costs declined to $10.12 per BOE in 2Q22 compared with $10.24 per BOE in 1Q22.
The quarter’s crude oil and condensate production totaled 464.1K Boep/d, up 3.5% from the year-ago level. Natural gas liquids volumes increased 45.8% yearly to 201.9K Bbls/d. Natural gas volume rose to 1,528 MMcf/d from the year-earlier quarter’s 1,445 MMcf/d.
EOG 2Q22 production detail (Fun Trading) CEO Ezra Yacob said on the conference call: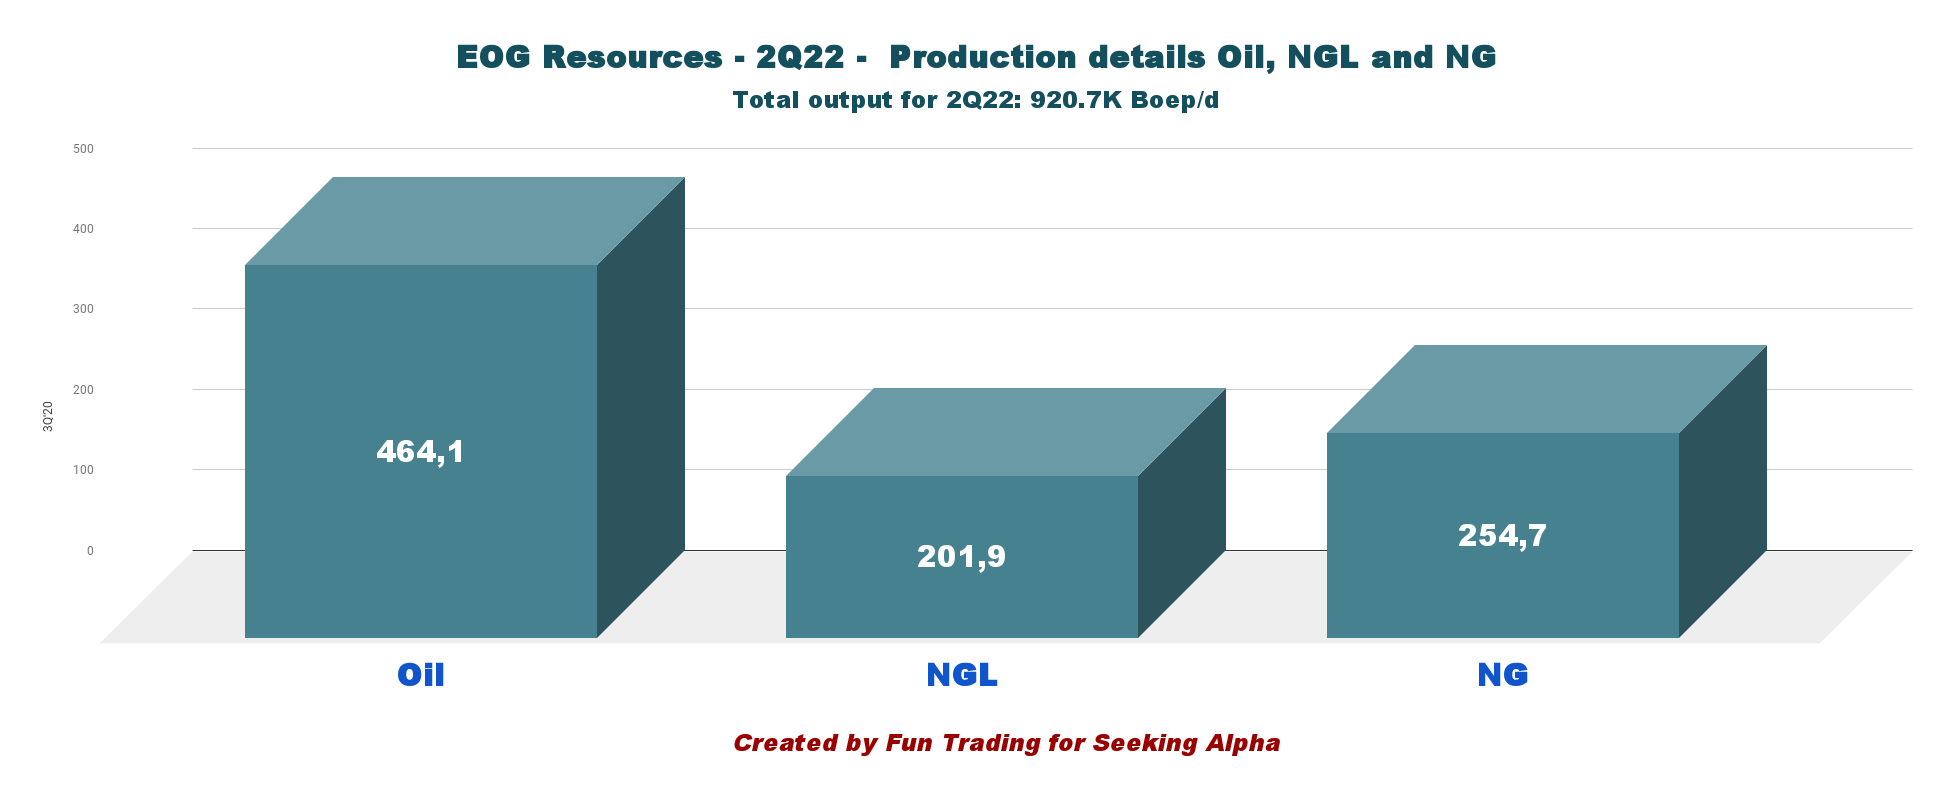
Our multi-basin portfolio is predominantly the result of having seven North American and one international cross-functional exploration teams that work independently, but collaborate on shared learnings. Our role here in Houston beyond capital allocation is to facilitate those shared learnings across all eight teams. The result is a robust exploration pipeline that continues to both improve the quality of and expand our more than 20-year inventory of premium and double premium wells.
2 – Investment Thesis
EOG Resources is one of the most trustworthy “shale” producers with the best friendly attitude towards its shareholders. The total dividend for 2Q22 is now $2.25, or a forward dividend yield of 7.6%. Another critical element is that the dividend has never been suspended.
Thus, I maintain a long-term investment rating even if oil prices are starting to weaken lately due to lower demand from China and the risk of a recession by the end of 2022, which will affect the market.
Brent prices TA Chart (Fun Trading StockCharts)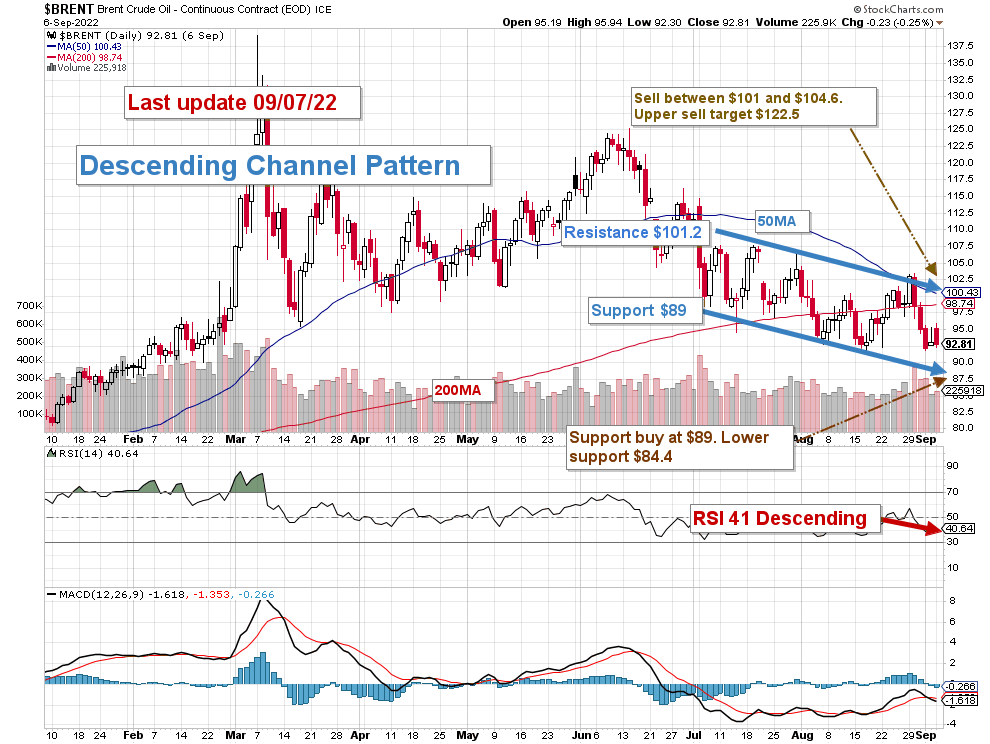
More uncertainty is coming from the FED, which is expected to raise the interest rate by 75-point at the end of September and will have a chilling effect on the market.
Thus, trading LIFO using technical analysis is the only viable strategy that can provide a decent long-term reward while reducing the risks. It allows you to profit from the short-term swings and increase your leverage during unfavorable or unexpected turnarounds that can last longer than expected.
This dual strategy is what I am recommending in my marketplace and forms the backbone of my Gold and Oil marketplace.
3 – Stock Performance
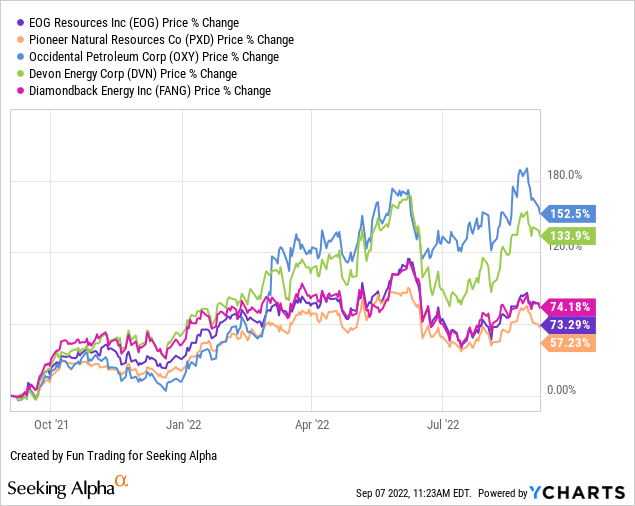
All five companies in the chart below have sharply increased year to date, with Occidental Petroleum Corporation (OXY) up 153% yearly, while EOG shows an increase more “modest” of 73%.
EOG Resources produces oil and gas from its U.S. shale assets, representing 96.2% of the total output in 2Q22. The production from the U.S. comes from five basins: Bakken, Powder River, Wyoming DJ, Delaware, and Eagle Ford (including the dry gas play Dorado).
EOG Production per region (Fun Trading) Production in the USA was up 12.9% from the same quarter a year ago.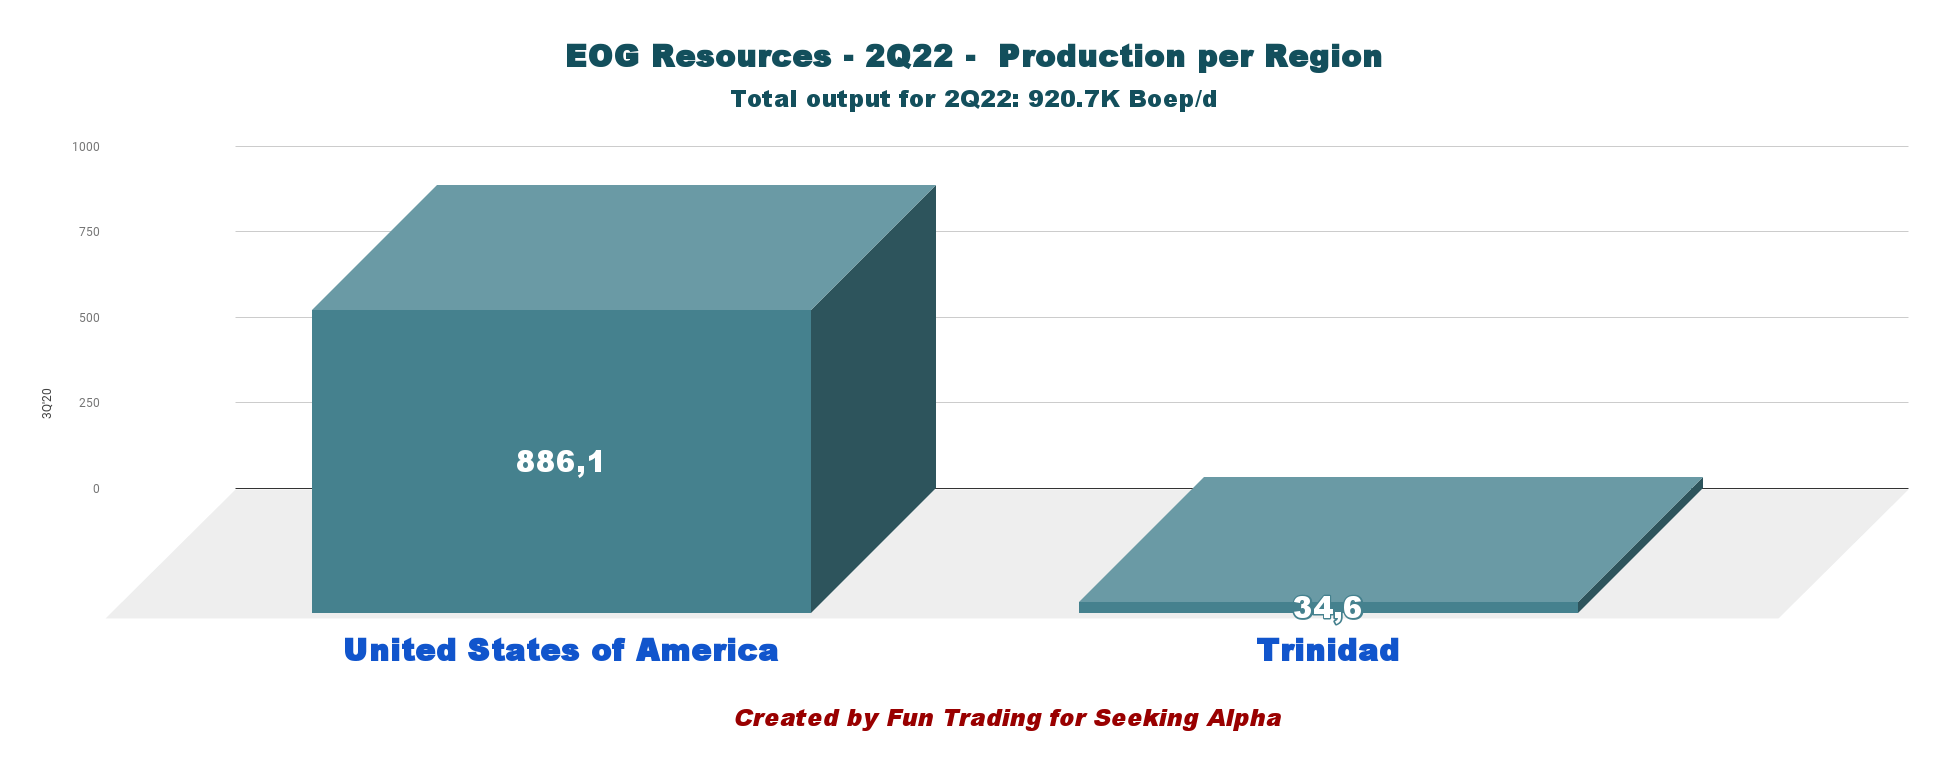
| Production per Region in K Boep/d | 2Q21 | 3Q21 | 4Q21 | 1Q22 | 2Q22 |
| United States of America | 785.2 | 807.9 | 827.8 | 841.5 | 886.1 |
| Trinidad | 40.6 | 36.5 | 35.3 | 41.8 | 34.6 |
| Other International | 2.2 | 0 | 0 | 0 | 0 |
| TOTAL | 828.0 | 844.4 | 863.1 | 883.3 | 920.7 |
CEO Ezra Yacob said on the conference call:
Our portfolio includes the Delaware Basin, which remains the largest area of activity in the company and is delivering exceptional returns. After more than a decade of high return drilling, our Eagle Ford asset continues to deliver top tier results while operating at a steady pace.
Part II – EOG Resources – 2Q22 Balance Sheet: The Raw Numbers
| EOG Resources | 2Q21 | 3Q21 | 4Q21 | 1Q22 | 2Q22 |
| Total Revenues in $ million | 4,139 | 4,765 | 5,908 | 6,755 | 8,645 |
| Oil Revenues in $ Million | 4,492 | 5,231 | 6,044 | 3,983 | 7,407 |
| Net income in $ Million | 907.0 | 1,095 | 1,985 | 390 | 2,238 |
| EBITDA $ Million | 2,083.0 | 2,404 | 3,447 | 1,392 | 3,841 |
| EPS diluted in $/share | 1.55 | 1.88 | 3.39 | 0,67 | 3.81 |
| cash from operating activities in $ Million | 1,559 | 2,196 | 3,166 | 828 | 2,048 |
| Capital Expenditure in $ Million | 1,023 | 896 | 1,014 | 1,009 | 1,424 |
| Free Cash Flow in $ Million | 536 | 1,300 | 2,152 | -181 | 624 |
| Total cash $ Billion | 3.88 | 4.29 | 5.21 | 4.01 | 3.07 |
| Long-term debt in $ Billion | 5.13 | 5.12 | 5.11 | 5.10 | 5.09 |
| Dividend per share in $ (+ special dividend) | 0.4125+2 | 0.75 | 0.75+1 | 0.75+1.80 | 0.75+1.70 |
| Shares outstanding (diluted) in Million | 584.0 | 584 | 585 | 586 | 588 |
Source: EOG Resources 10Q
* More data available to subscribers.
Part III – Analysis: Revenues, Earnings Details, Net Debt, Free Cash Flow, And Oil Equivalent Production
1 – Total Revenues And Others Were a record of $7,407 Million in 2Q22
Note: Oil revenues were $8,645 million in 2Q22.
EOG Quarterly revenues history (Fun Trading)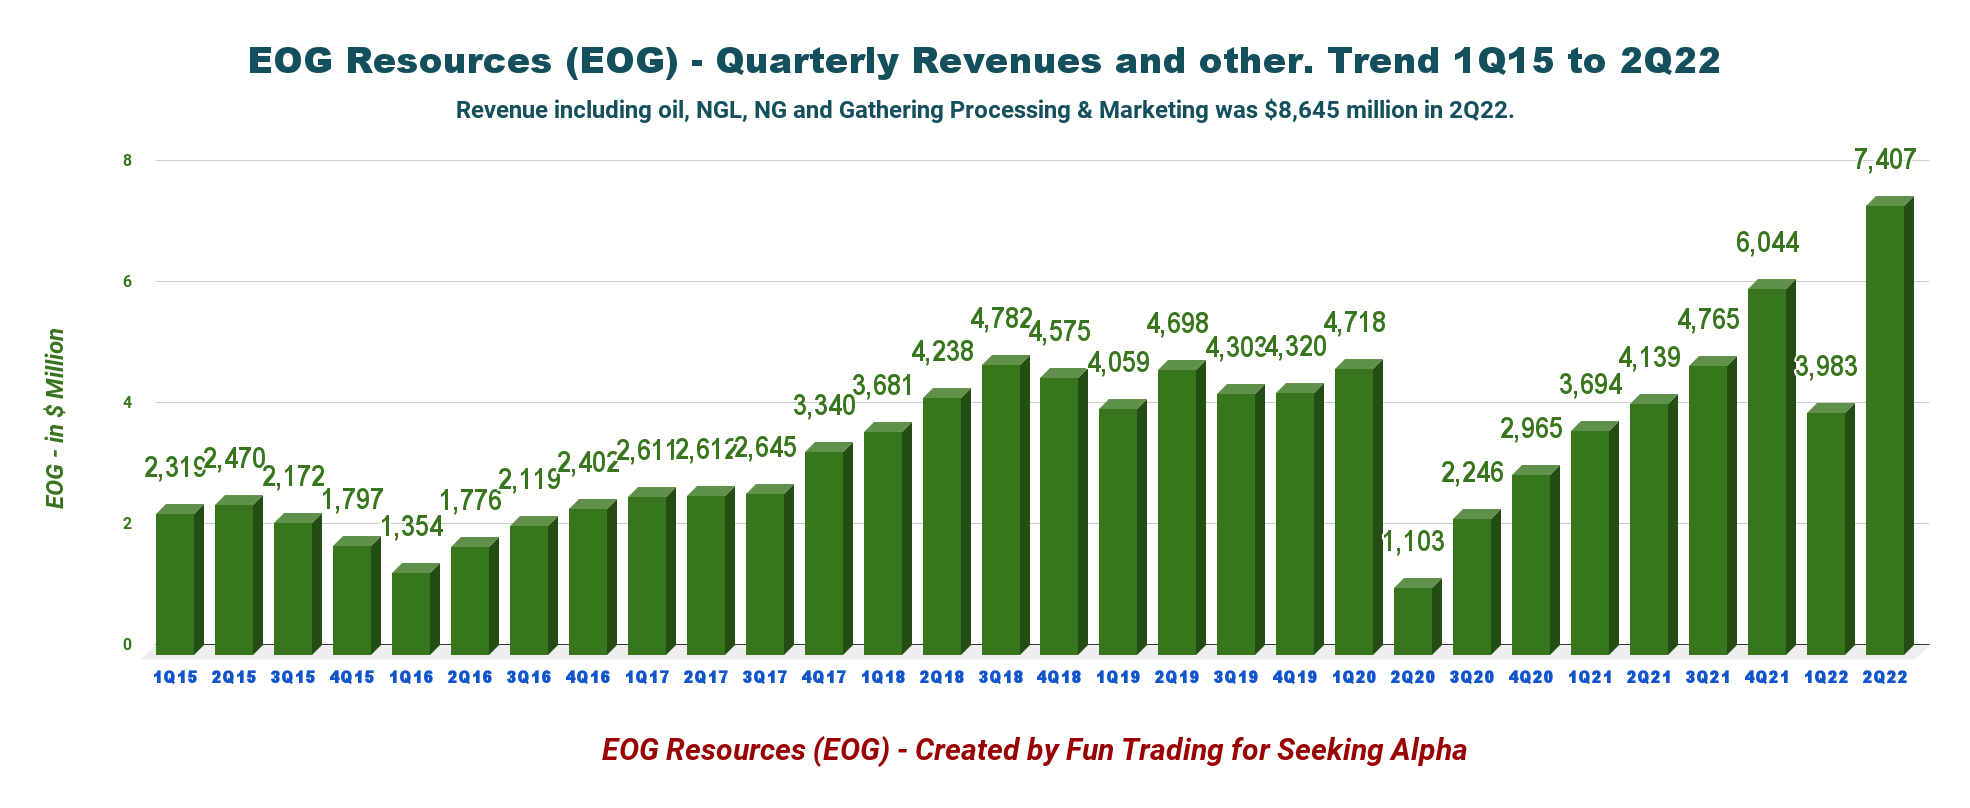
The company’s net income was $2,238 million, or earnings per share of $3.81. The solid performance resulted from increased commodity prices and substantial production volumes.
Lease and well expenses grew to $324 million from $270 million a year ago. Transportation costs increased to $244 million from $214 million. The company reported gathering and processing costs of $152 million, higher than the year-ago quarter’s $128 million. Exploration costs were unchanged at $35 million from a year ago.
All in one, total operating expenses for 2Q22 were $4,504 million, higher than the $2,468 million a year ago.
2 – Free Cash Flow Was $624 Million In 2Q22
EOG Quarterly Free cash flow history (Fun Trading)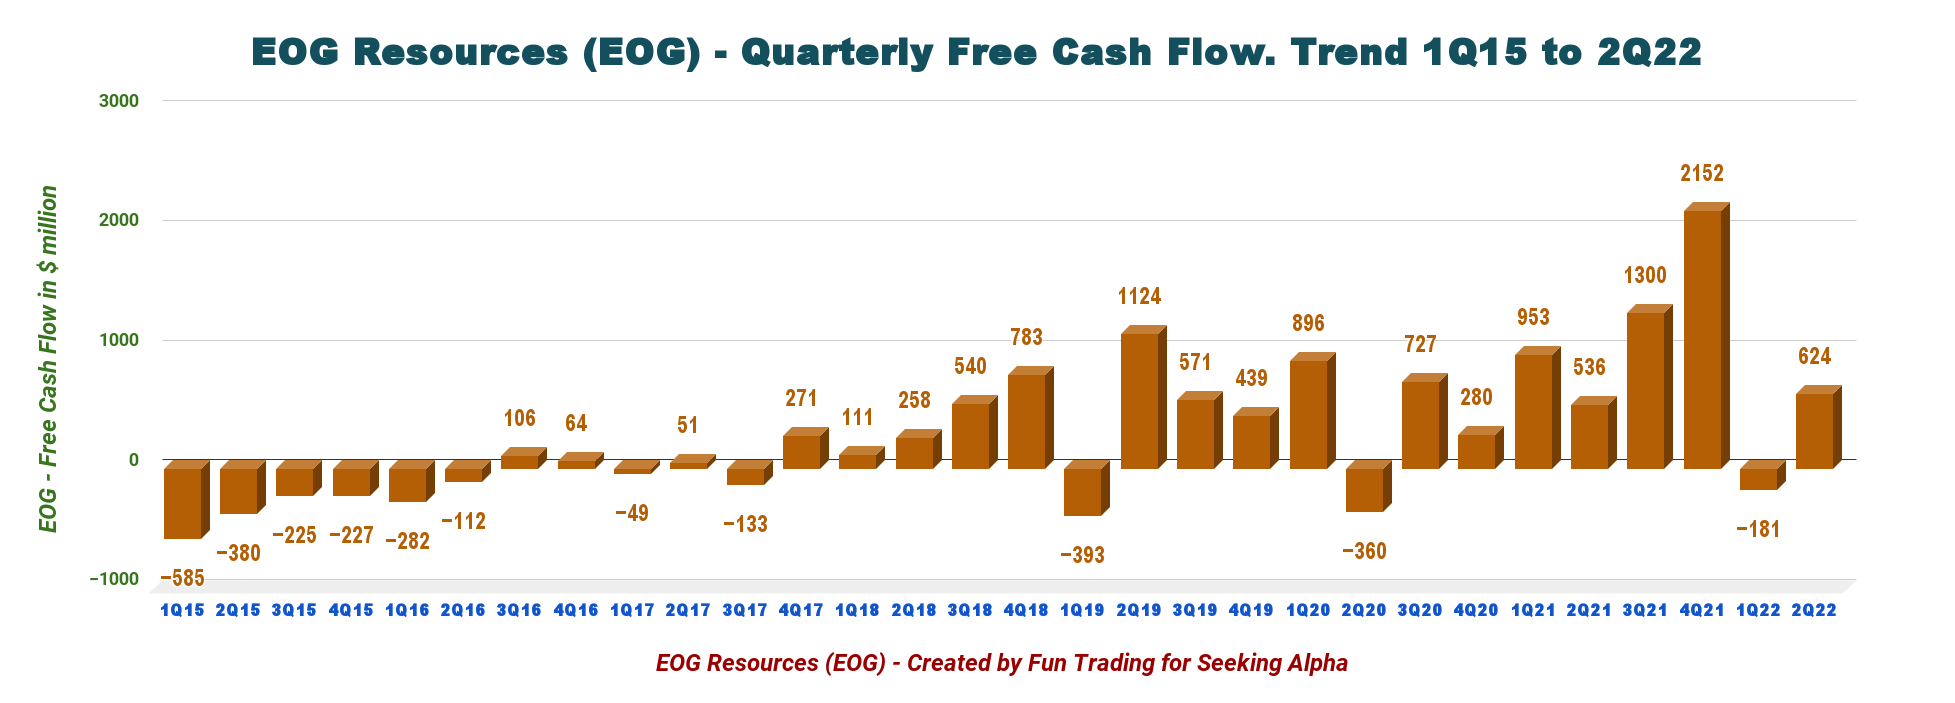
Note: The organic free cash flow is the cash from operating activities minus CapEx. EOG uses another way to calculate the generic Free cash flow, which is not comparable to other E&P companies. EOG Resources posted $1,286 million in free cash flow.
The free cash flow for the second quarter of 2022 was $624 million, and the trailing 12-month free cash flow was $3,895 million.
The company is committed to returning a minimum of 60% of annual free cash flow, which is exceptionally generous.
EOG Dividend policy (EOG Resources presentation)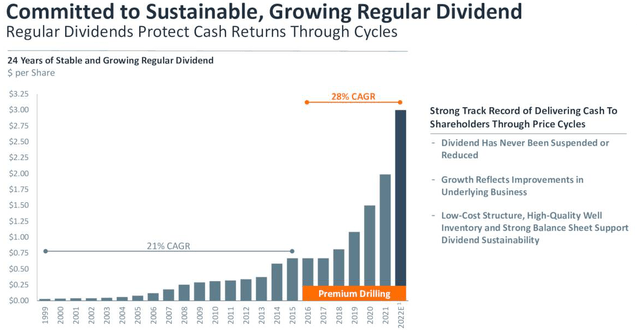
3 – Oil-Equivalent Production And Other
3.1 – Oil Equivalent Production
EOG Resources’ oil production increased sequentially in the second quarter. Total production was 920.7K Boep/d, up 11.2% from last year and up 4.2% sequentially. The chart below shows that the total production reached a record this quarter.
EOG Quarterly production versus US history (Fun Trading)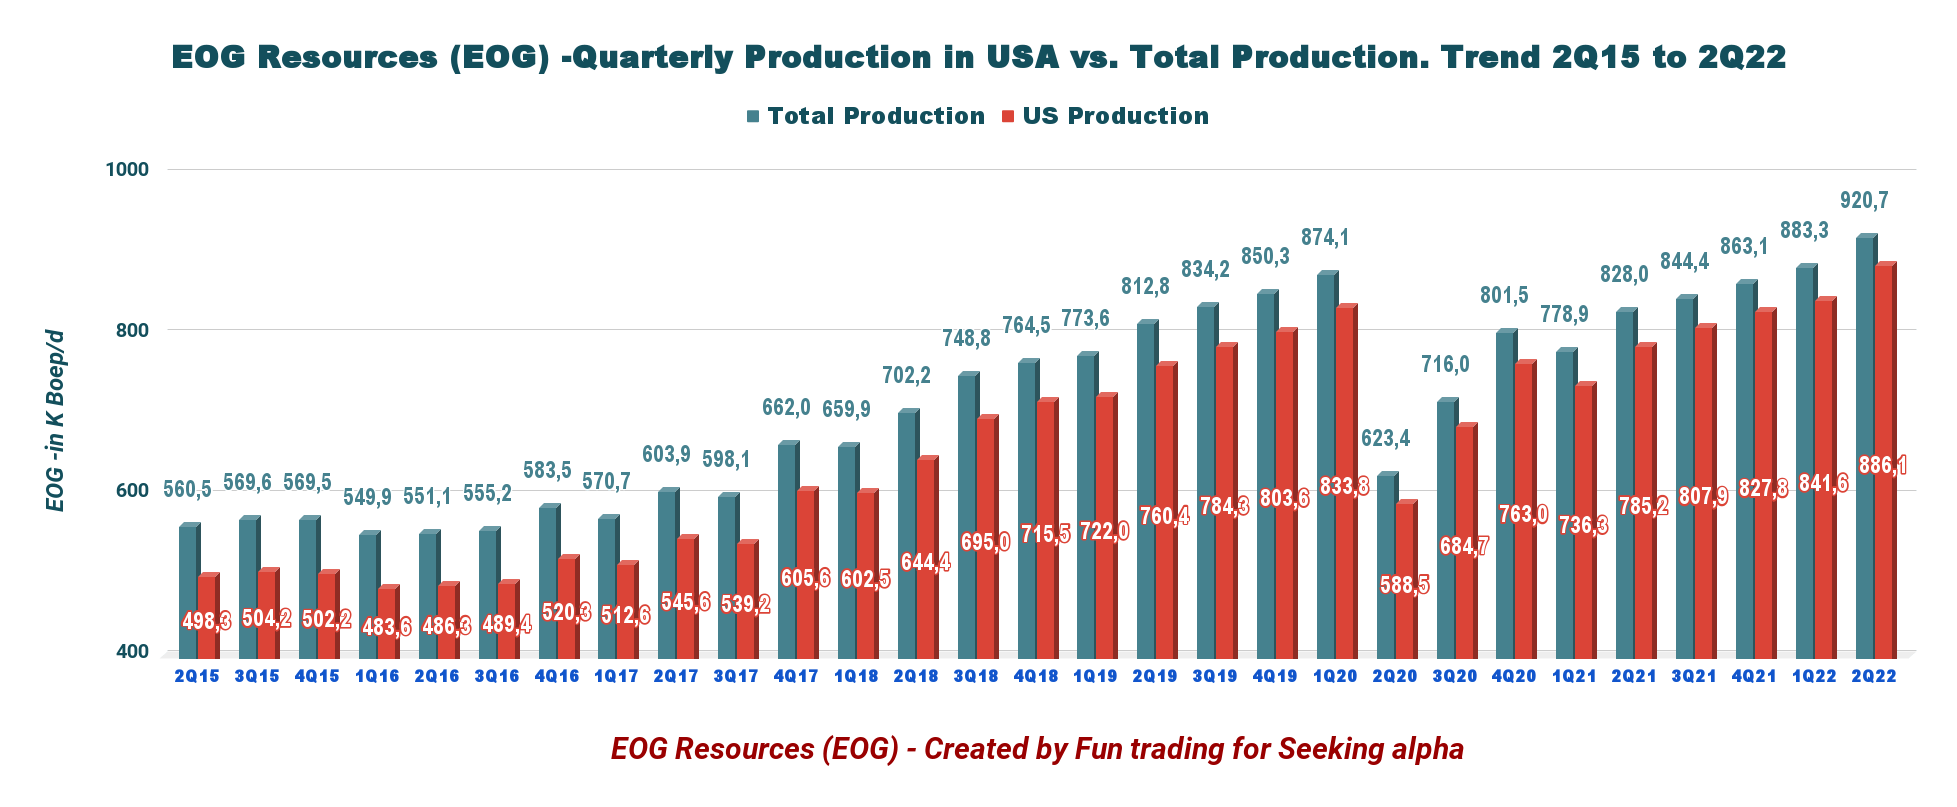
3.2 – Oil Production Detail: Oil, NGL, And NG
EOG relies significantly on crude oil, representing 50.4% of the total output in 2Q22.
EOG Quarterly production per segment (Fun Trading)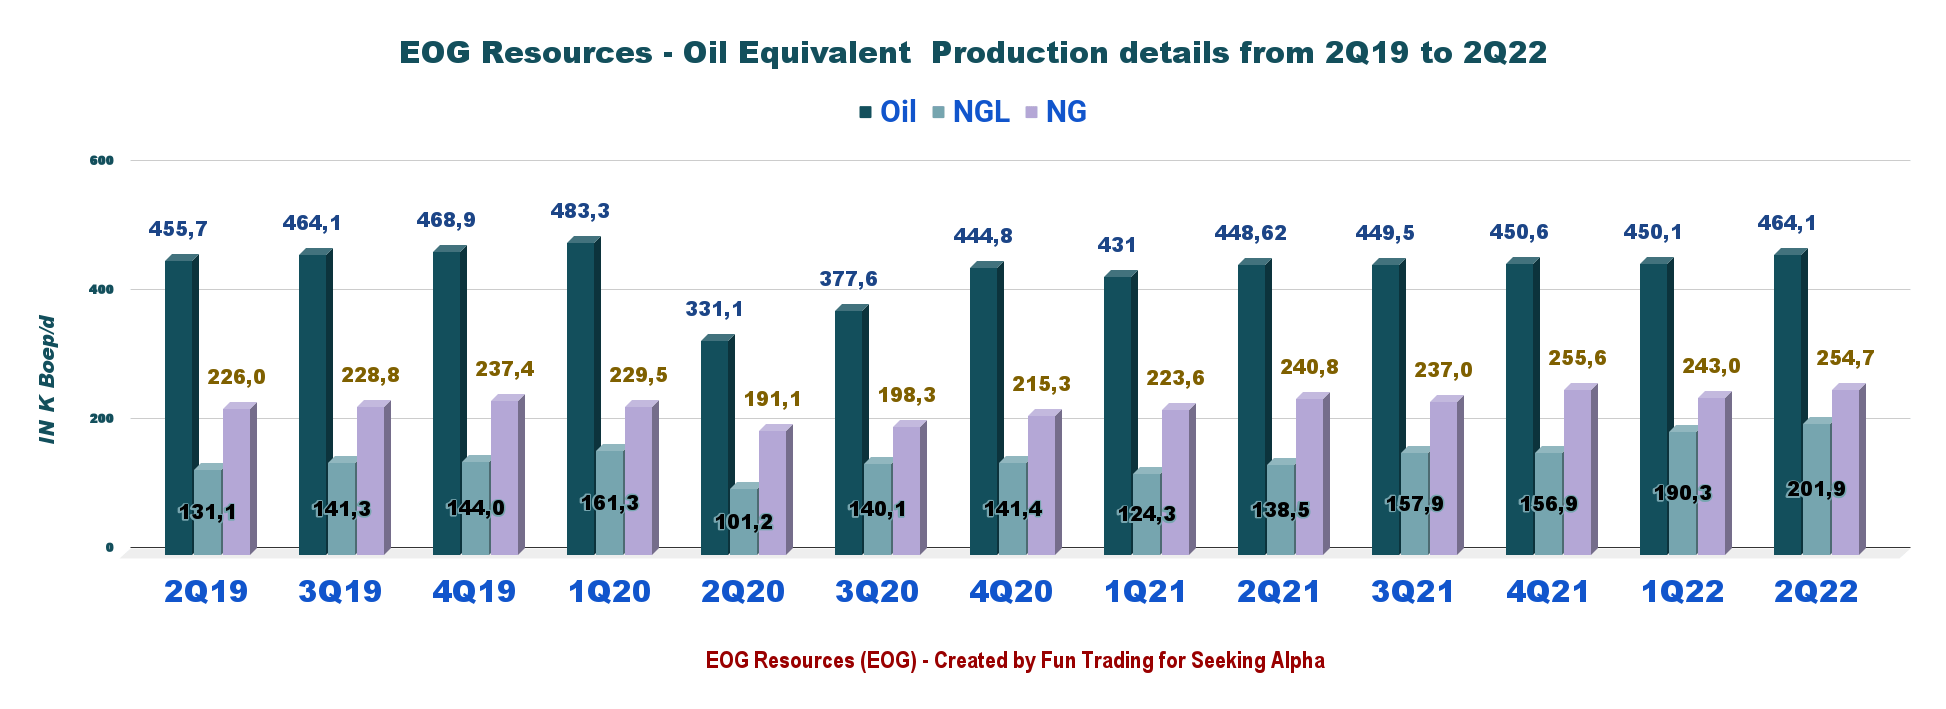
The company’s oil price (composite) realized this quarter was a whopping $111.25 a barrel, up from $66.12 a year ago.
In addition, natural gas fetched at $7.19 per Mcf. Finally, NGL prices were $42.28 per barrel.
Below is the chart history of the Oil and NG price composite.
EOG Prices oil and NG History (Fun Trading)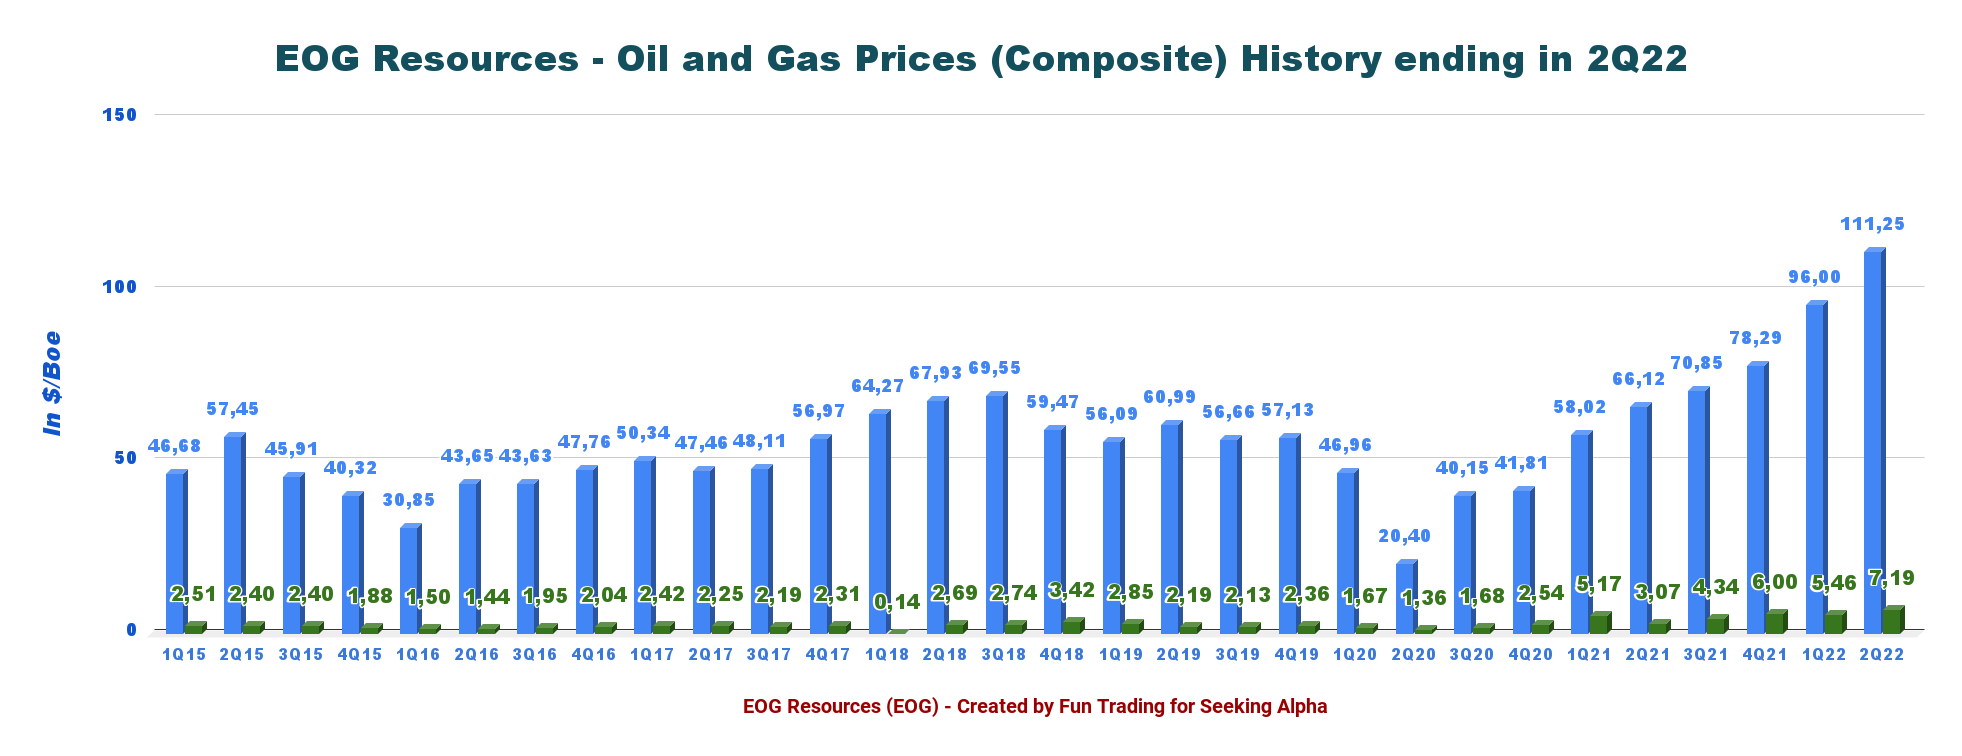
The company is excited about the potential for growth in the emerging South Texas Dorado dry natural gas play and the Powder River Basin Mowry and Niobrara combo plays, contributing to EOG’s success.
3.3 – Powder River Basin and Dorado Dry Natural gas play.
EOG Powder River (EOG Presentation)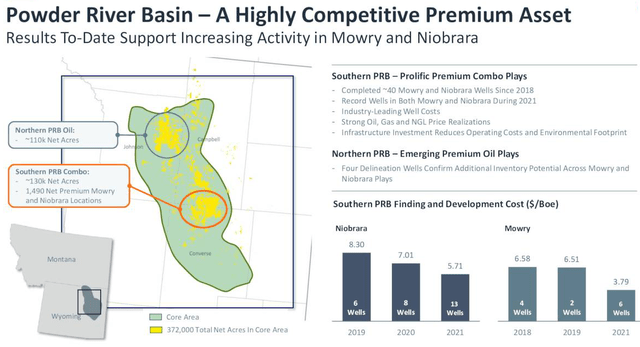
COO Billy Helms said in the conference call about the Texas Dorado dry natural gas play:
On the natural gas side, we’re excited about the results of our South Texas Dorado play and its ability to play an increasing role in supplying the growing demand of petrochemical and LNG markets along the Gulf Coast. As we allocate future capital based on returns, this play will command additional investment, not only to meet the growing demand, but also for infrastructure needed to capture the value chain from the wellhead to the market center.
4 – Low Net Debt And good Cash position. Excellent Profile
EOG Quarterly Cash versus Debt history (Fun Trading) As of June 30, 2022, EOG Resources had cash and cash equivalents of $3,073 million. Long-term debt was reported at $5,091 million. The current portion of the long-term debt was recorded at $1,282 million – the debt to a total capitalization of 18.6%, which is excellent.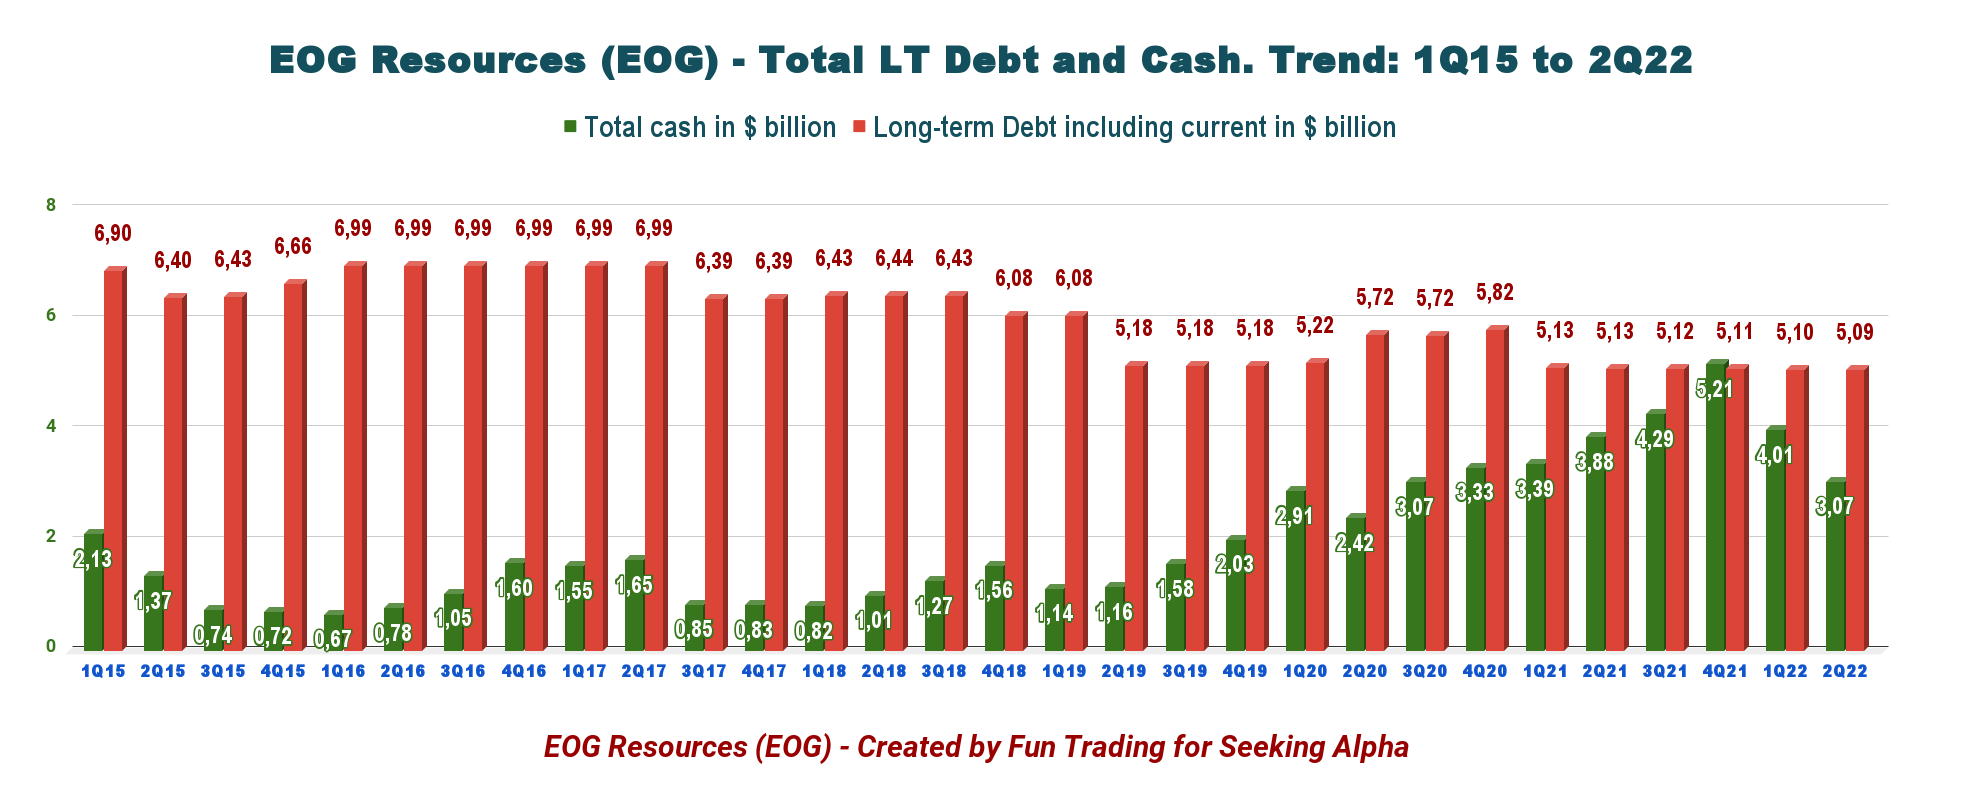
5 – 2022 Guidance revised
EOG Resources expects 2022 production between 884.3K to 924.4K Boep/d, with the third-quarter production at 866.8-928.5K Boep/d.
Part IV – Technical Analysis And Commentary
EOG TA Chart short-term (Fun Trading StockCharts)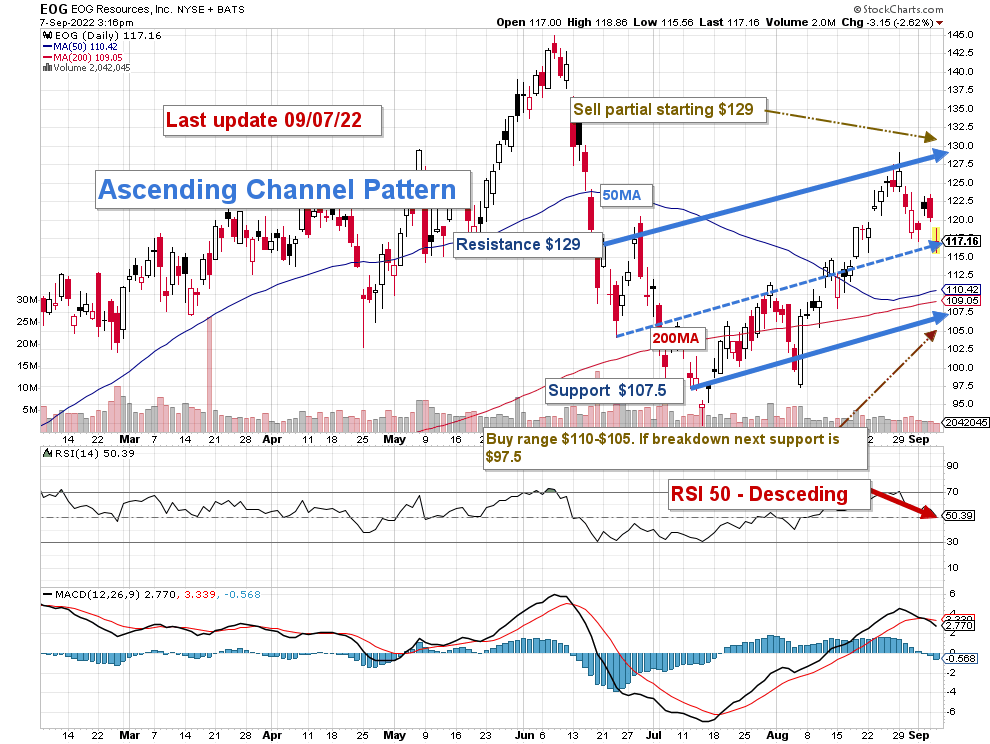
Note: The chart has been adjusted for dividends.
EOG forms an ascending channel pattern with resistance at $129 and support at $107.5. The ascending channel is also known as a rising channel or the channel up. In this case, it may indicate a bearish short-term outlook.
The short-term trading strategy is to trade LIFO about 40%-50% of your position. I have increased the short-term portion again because of the increasing volatility attached to the oil sector and the elevated risk of a recession in 4Q22.
I suggest selling at above $129 and waiting for a retracement below $109-$110, which is the 50MA and 200MA. However, if oil prices continue to drop and cross $85, EOG could retest the lower support at around $97.5.
Watch oil prices like a hawk.
Note: The LIFO method is prohibited under International Financial Reporting Standards (IFRS), though it is permitted in the United States to generally accepted accounting principles (GAAP). Therefore, only US traders can apply this method. Those who cannot trade LIFO can use an alternative by setting two different accounts for the same stocks, one for the long term and one for short-term trading.
Warning: The TA chart must be updated frequently to be relevant. It is what I am doing in my stock tracker. The chart above has a possible validity of about a week. Remember, the TA chart is a tool only to help you adopt the right strategy. It is not a way to foresee the future. No one and nothing can.
Author’s note: If you find value in this article and would like to encourage such continued efforts, please click the “Like” button below as a vote of support. Thanks.
Be the first to comment