

smshoot/iStock via Getty Images
Investment Thesis
I dislike the small-cap growth space in this risk-off market, advocating against them for about a year and a half now. But what about mid-cap growth stocks? Presumably, they are of higher quality and are less speculative, potentially hitting that ‘sweet spot’ from a risk and return perspective. I will assess that in today’s review of the Vanguard Mid-Cap Growth ETF (NYSEARCA:VOT). This article provides a host of fundamental metrics on the VOT’s volatility, margins, growth, valuation, and profitability and compares it with the Vanguard Small Cap Growth ETF (VBK) and the Vanguard Growth ETF (VUG). I sense that VUG is the best buy, and investors shouldn’t buy VOT until valuations normalize more. Unfortunately, it’s not the ‘sweet spot’ growth ETF I was hoping for.
VOT ETF Analysis
Strategy
VOT tracks the performance of the CRSP Mid Cap Growth Index, a multi-factor-weighted Index selecting mid-cap securities based on:
- Future long-term growth in earnings per share
- Future short-term growth in earnings per share
- Three-year historical growth in earnings per share
- Three-year historical growth in sales per share
- Current investment-to-assets ratio
- Return on assets
By excluding valuation metrics, VOT has a high trailing price-earnings ratio. As of May 31, 2022, it was 31.9x earnings using a weighted-average method, but that likely excludes stocks with negative earnings. As readers of my article on VBK learned, that figure can be pretty misleading, and I’ll dig into the holdings more later to confirm this estimate.
Vanguard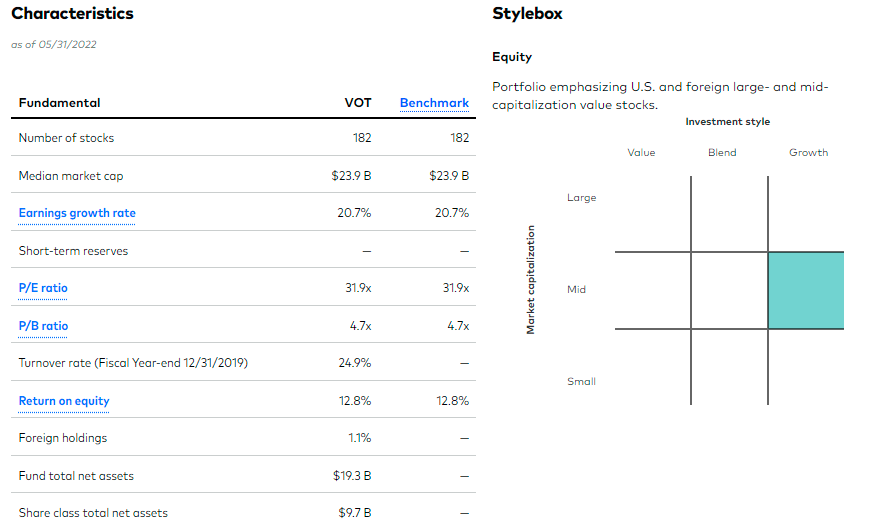
The graphic above indicates that VOT has 182 holdings, a five-year average annual earnings growth rate of 20.70%, a one-year trailing return on equity of 12.80%, and a median market capitalization of $23.9 billion. The last figure may surprise investors since $13.1 billion is S&P’s cutoff for large-cap stocks, and this is a mid-cap Index. Therefore, VOT may be considered a small cross between mid-and large-cap growth, likely sacrificing some growth potential in exchange for quality.
Sector and Industry Exposures
VOT’s sector exposures are listed below, showing that it has the most exposure to Industrials (15.40%) compared to VBK and VUG. VOT also has high exposure to Health Care (17.70%) and a healthy allocation to Technology (30.31%). Both VBK and VOT appear much more diversified than VUG, which has 47.02% exposure to Technology.
Morningstar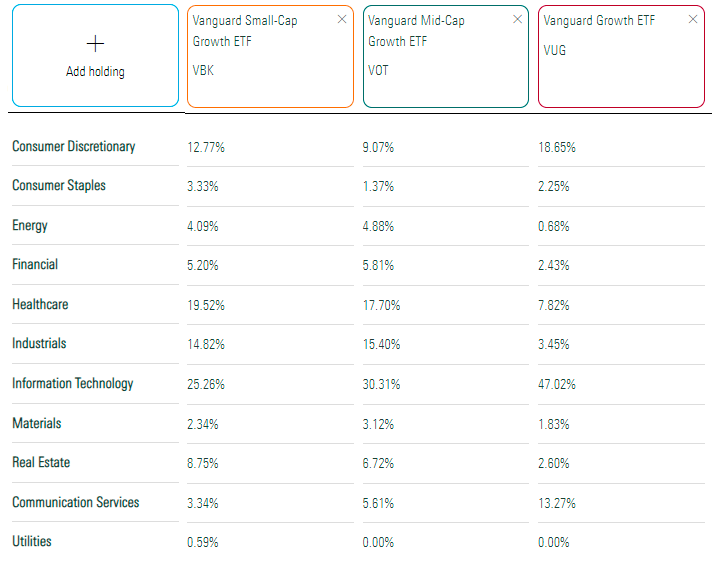
Currently, VOT’s top holdings are Devon Energy (DVN), Synopsys (SNPS), and Centene (CNC), representing the Energy, Technology, and Health Care sectors, respectively. Notably, all top ten holdings have market capitalizations above $30 billion and are members of the large-cap S&P 500 Index (including half of all constituents).
Vanguard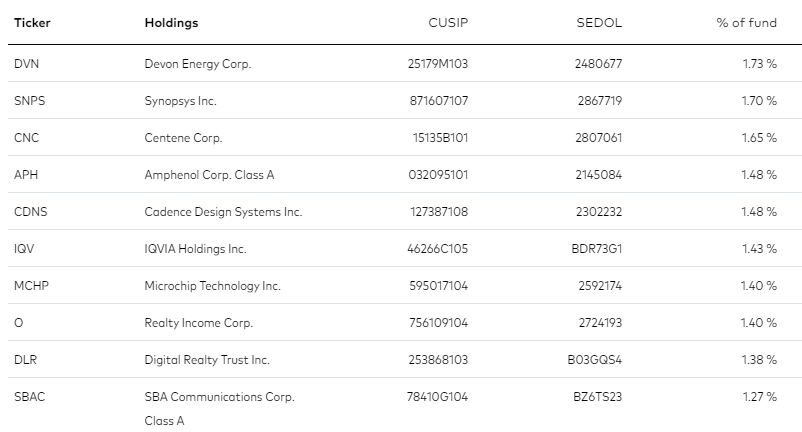
Finally, readers may appreciate a more detailed look at VOT by industry since the above table highlights only 14.92% of the ETF. Here are the top three stocks from each of VOT’s top 20 industries, which total 46.73%.
The Sunday Investor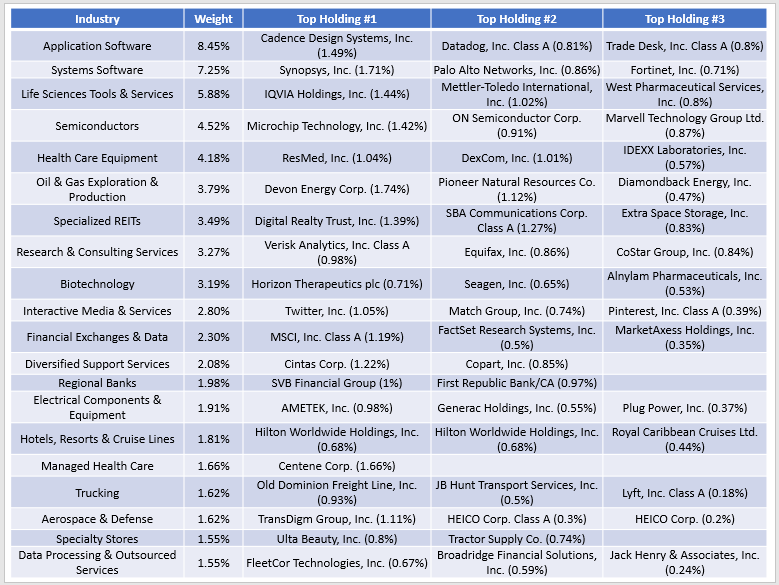
Performance History
Since September 2006, VOT has delivered an annualized 9.05% return, slightly better than VBK’s 8.93% but more than 1% behind VUG. VOT also falls in the middle based on risk-adjusted returns but had the most significant maximum drawdown. During the subprime crisis from November 2007 to February 2009, VOT lost 54.31% and took two years to recover.
Portfolio Visualizer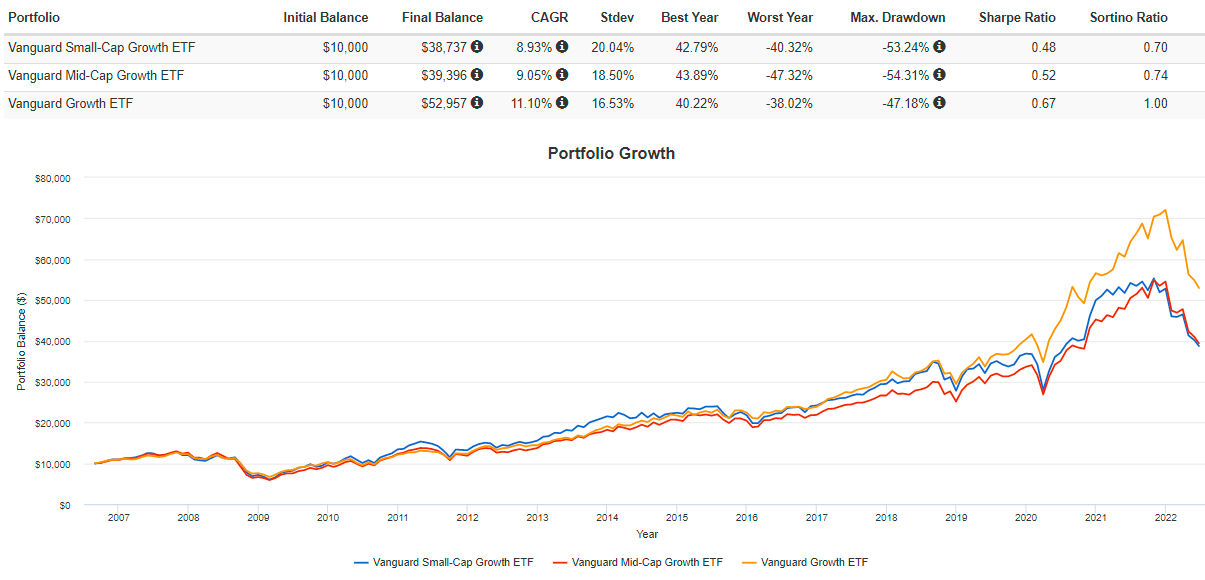
Analysts should also look at rolling returns to avoid cherry-picking data to suit their thesis. VOT, on average, tends to underperform VBK for all time horizons except for one-year (12.69% vs. 12.64%) and 15 years (10.48% vs. 10.33%). Against VUG, it substantially underperforms during all periods measured. Therefore, I don’t think this data supports VOT as a ‘sweet spot’ investment.
Portfolio Visualizer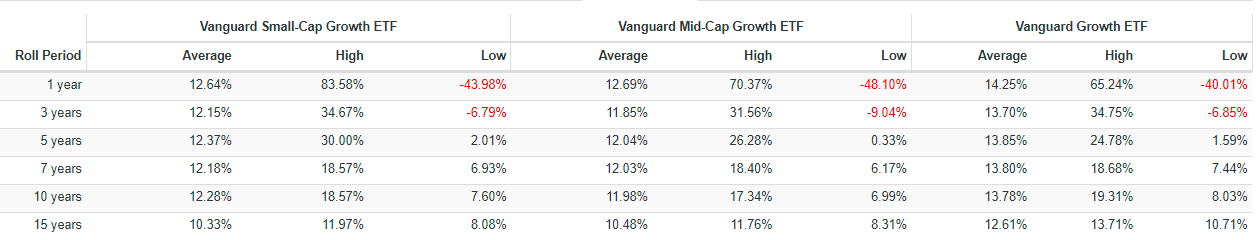
Fundamentals
Valuation Ratios
Earlier, I mentioned how distorted valuation ratios for growth ETFs could get when the calculation excludes companies with negative earnings. This fits the description for 38% of VBK’s constituents (25% of the total weight) and a further 10% (8% of the total weight) with forward price-earnings ratios exceeding 60. This information is relevant because providers like Morningstar cap each security’s ratio at 60 so as not to distort the valuation estimate of the entire fund. However, when too many constituents are excluded, the result is an understated valuation. For VBK, Vanguard lists the trailing P/E as 23.3, but I can confidently say this is misleading.
Vanguard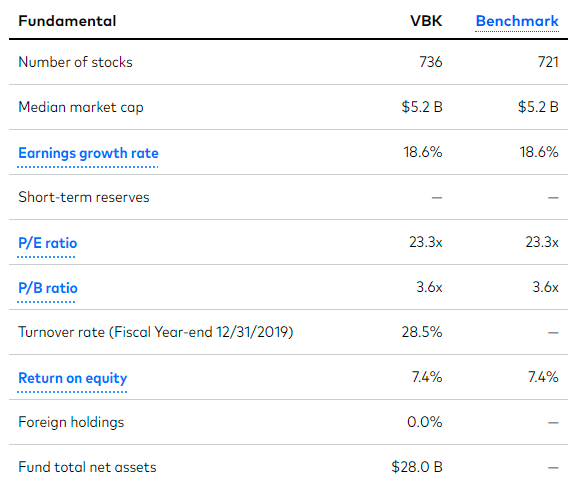
Fortunately, this issue isn’t nearly as prevalent in VOT. Only seven constituents (1.46% of the total weight) have negative earnings, and none have a forward valuation ratio greater than 60 times earnings. As for VUG, 14% have negative earnings (2.38% of the total weight), but 9% have a forward P/E exceeding 60 (12.61% of the total weight).
Industry Snapshot
To help normalize the data, I have re-calculated weighted-average valuation ratios for the three ETFs by placing a cap of 60 in place, even for companies with negative earnings. That way, all companies are included in the calculation, and we can gain insight into how VOT is valued relative to its small- and large-cap counterparts. The table below highlights these metrics and others for VOT’s top 20 industries, and I’ll offer my analysis afterward.
The Sunday Investor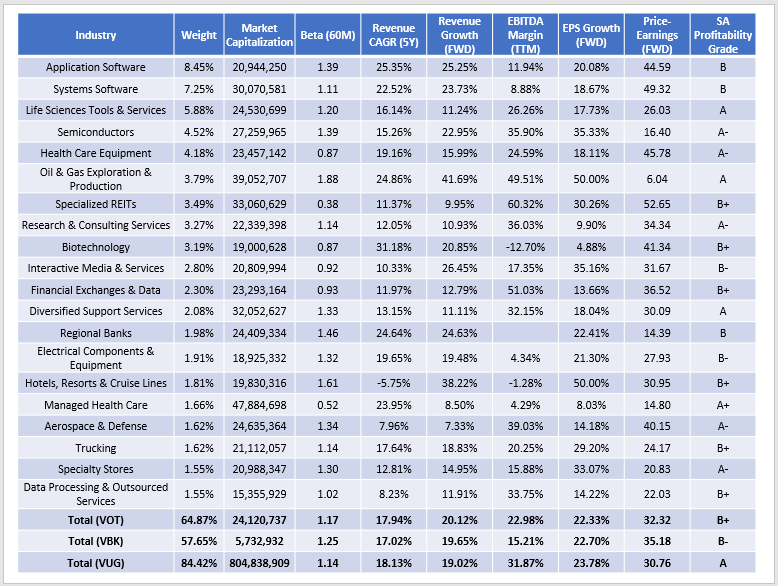
1. VOT’s one-year estimated revenue growth of 20.12% is the best of the three funds, but the difference is negligible. The highest-growing industries appear to be Application Software, Systems Software, Semiconductors, and Oil & Gas Exploration & Production. These industries also boost VOT’s volatility, but it’s only slightly higher than VUG’s based on its 1.17 five-year beta. Investors may also appreciate VOT’s better diversification, with a 64.87% concentration in its top 20 industries compared with 84.42% for VUG.
2. VOT’s estimated earnings per share growth of 22.33% is the lowest of the three, but the difference is slight. However, VOT lags VUG on the weighted-average 22.98% EBITDA margin figure, and for me, this is where the ETF becomes risky with a potential recession on the horizon. It’s the fast-growing software stocks that could see their margins destroyed in a recession, and it’s the heavily-weighted software stocks that are worth watching. Here are five examples with EBITDA margins less than 10% and whose Seeking Alpha Profitability Grades are C+ or worse.
Seeking Alpha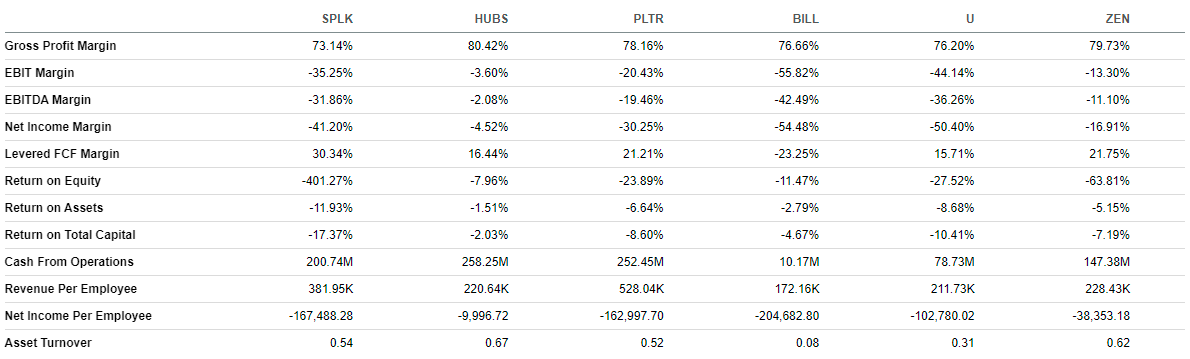
These poor margins are now showing up in stock price returns. An equal-weight portfolio of these six securities, rebalanced monthly, gained 10.84% in 2021 but is down 41.27% YTD. It feels too much like trying to catch a falling knife at this point. Splunk (SPLK) is probably the one exception here since its Q1 results exceeded expectations and analysts noted ‘improving fundamentals,’ but otherwise, most stocks in these industries are overly risky.
Portfolio Visualizer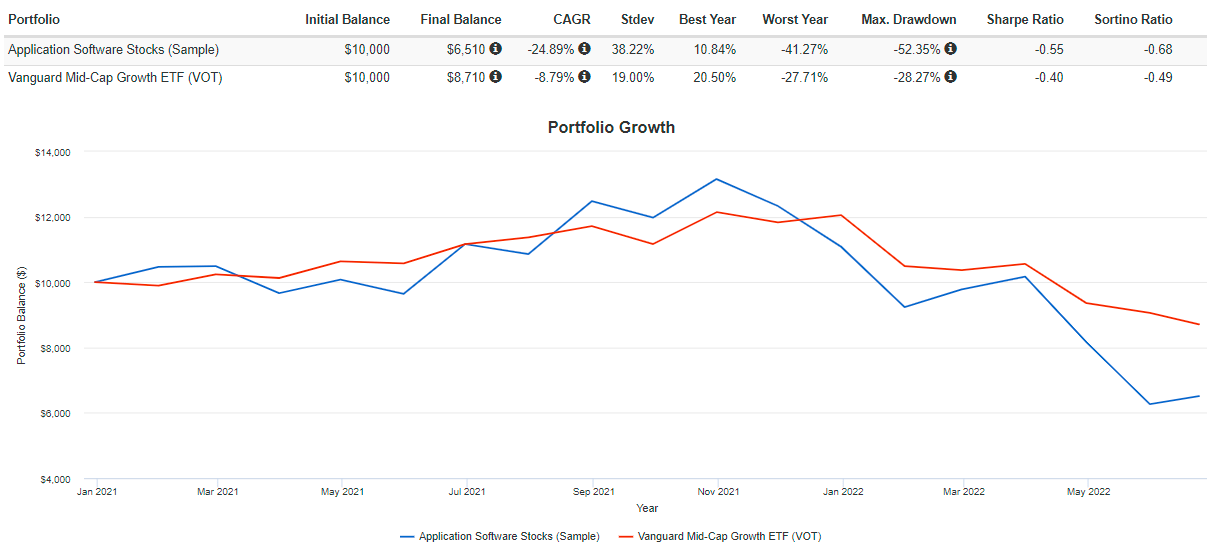
3. After adjusting the valuation ratios for all funds, VOT is quite expensive at 32.32x forward earnings. That’s better than VBK’s 35.18 but higher than VUG’s 30.76. There aren’t many deals, and the software stocks mentioned previously are the main culprits. Only five of 31 application or systems software stocks have a forward price-earnings ratio of less than 30, and most don’t fit into the growth category since their sales growth rates are in the single digits. The bottom line: growth stocks are still pricey since analysts are revising their estimates downward almost at the same pace as share prices.
Investment Recommendation
VOT lands between VBK and VUG on performance, volatility, valuation, and profitability. It’s not a true mid-cap growth fund since its weighted-average market capitalization is about $24 billion, and half of its constituents are members of the S&P 500 Index. I think the issues with profitability and valuation, specifically in software-related industries, need more time to normalize. Therefore, my rating today is neutral because I couldn’t make a case for VOT being the ‘sweet spot’ growth ETF I hoped it would be. Stick with VUG if you’re bullish on growth stocks, and wait for VOT’s valuation to come down before taking a position.
Be the first to comment