

BlackJack3D
Price Action Thesis
Energy plays have been hammered since June, as we cautioned in our earlier articles in Occidental (OXY), Chevron (CVX), Energy Transfer (ET), and Exxon (XOM). We also cautioned investors on natural gas leader EQT Corporation (EQT) in late April.
Given the ominous price structures that have been forming for a while, investors should heed caution and not fail to ignore the warning signs. We have learned from our past mistakes of ignoring such caution and paid the price.
Valero Energy (NYSE:VLO) stock has collapsed more than 30% since forming its bull trap (significant rejection of buying momentum) in early June. Notably, the bull trap was formed on its medium- and long-term charts, highlighting the potency of the market’s rejection of further buying upside.
However, we believe VLO is likely consolidating at a near-term bottom, as its short- and medium-term technicals are oversold. Notwithstanding, we don’t encourage investors to add at the current levels, as VLO is likely to underperform moving forward.
As such, we rate VLO as a Hold for now. Also, we suggest investors consider directionally-bearish set-ups moving ahead at appropriate price levels to capitalize on a potentially steeper fall ahead.
Valero Energy – Follow The Price Action, Not The News
VLO price chart (monthly) (TradingView)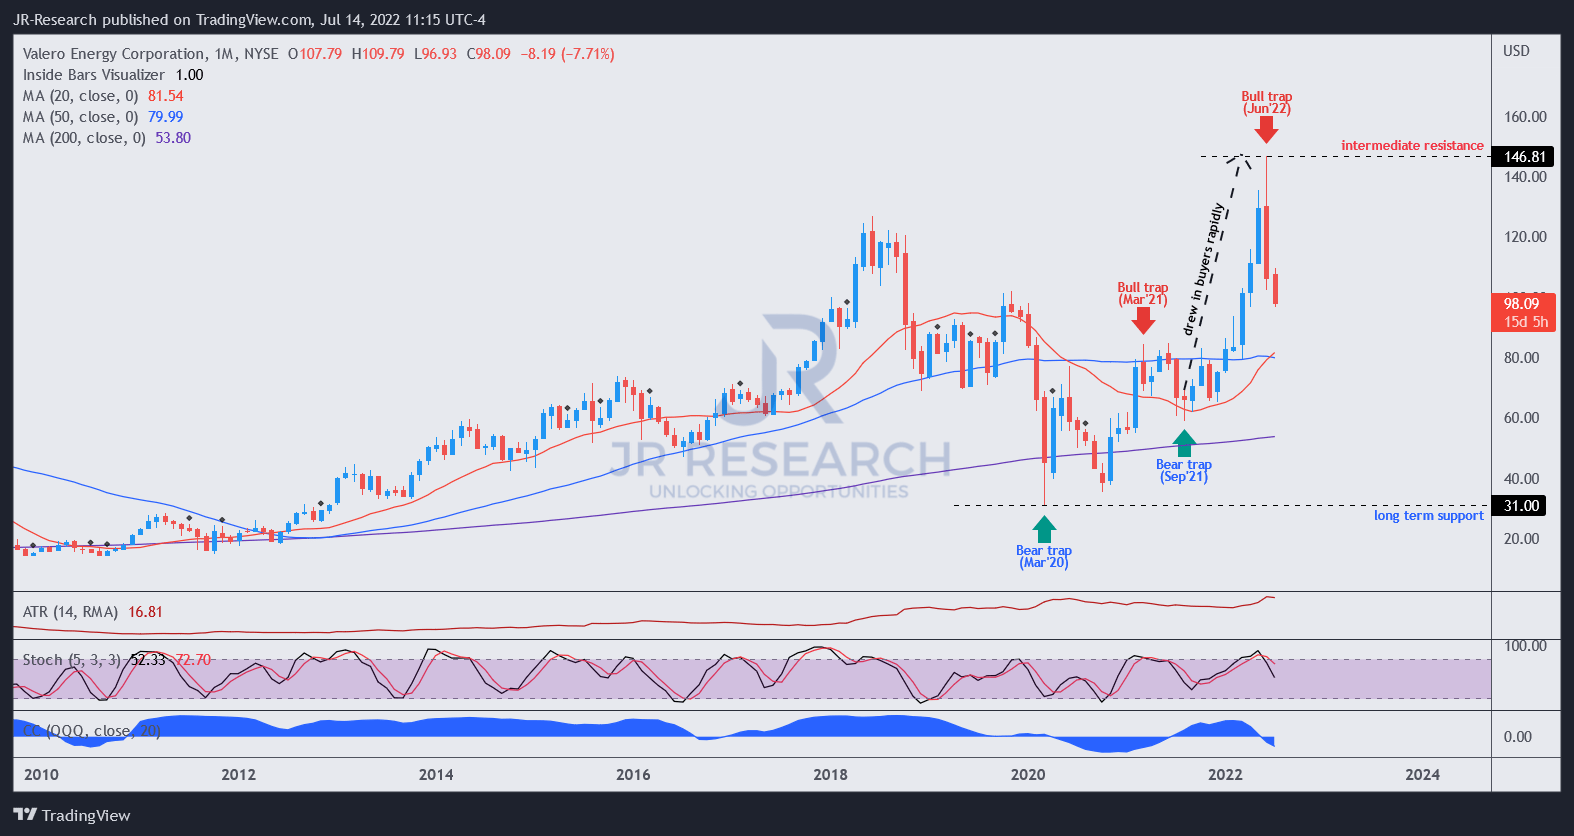
As seen in VLO’s long-term chart, investors can glean the massive bull trap price action in early June that stanched further buying upside. We urge investors to parse long-term charts carefully for significant price structures. If they occur in the long-term charts, their potency is usually amplified.
Furthermore, the preceding price structures leading to its June bull trap are emblematic of market action that draws in investors rapidly before forming a bull trap. Therefore, we urge investors not to buy into such rapid surges.
VLO price chart (weekly) (TradingView)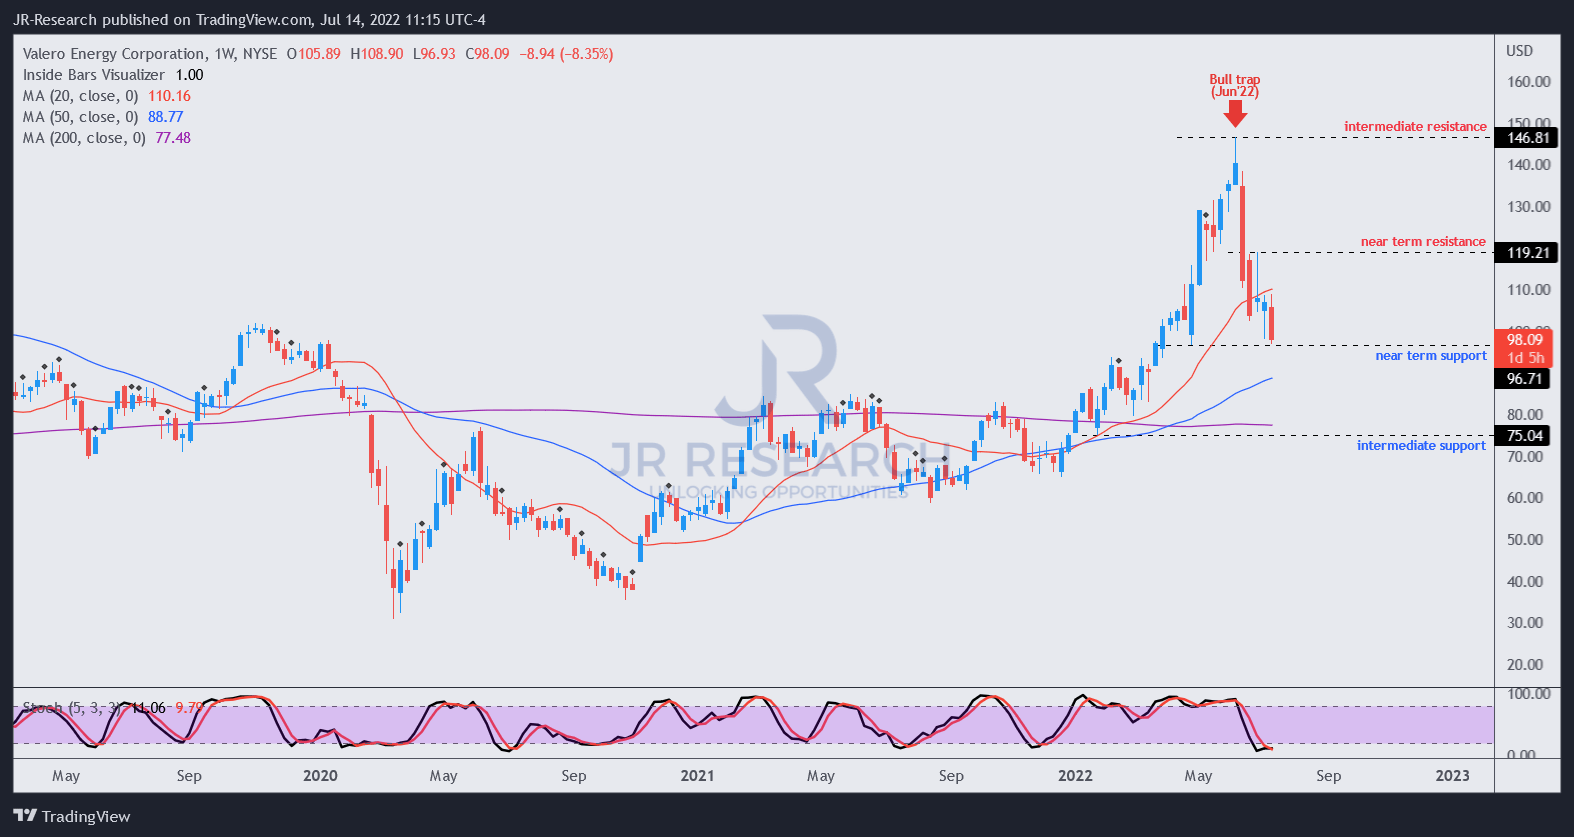
Notwithstanding, VLO is likely consolidating in the near term, underpinned by its near-term support ($96). Its short- and medium-term technicals are already oversold. As a result, we believe investors/traders who executed directionally-bearish set-ups could be looking to cover their positions at the current levels.
However, we don’t encourage investors to buy this dip, even though some investors could find the current levels attractive, given the steep fall since June. Moreover, VLO’s price structures on its long-term chart still look ominous.
Therefore, we believe the market could use the current consolidation to appeal to dip buyers before setting up another bull trap moving forward.
VLO’s Valuation Is Not Appealing
Even the bullish consensus estimates suggest that Valero’s revenue and adjusted EBIT margins are projected to fall markedly through FY24.
As a result, we think it makes sense that the market rejected further buying upside even as VLO traded at an NTM free cash flow (FCF) yield of about 10% in early June. Why? Because VLO could significantly underperform as its margins are projected to moderate considerably.
| Stock | VLO |
| Current market cap | $40.05B |
| Hurdle rate [CAGR] | 5% |
| Projection through | CQ4’26 |
| Required FCF yield in CQ4’26 | 12% |
| Assumed TTM FCF margin in CQ4’26 | 3.6% |
| Implied TTM revenue by CQ4’26 | $166.01B |
VLO reverse cash flow valuation model. Data source: S&P Cap IQ, author
Our model used a FCF yield of 12%, as the market rejected further buying upside at 10% in June (implying the market considered that level too low). While VLO last traded at an NTM FCF yield of 17.15%, we would like to remind investors to look forward.
Based on our analysis, Valero’s FCF margins are expected to fall to 3.3% by FY24. Therefore, VLO last traded at a FY24 FCF yield of 10.71%. If its revenue is projected to fall further, it will likely impact Valero’s FCF margins further.
Note that the WTI futures are pricing for oil prices to fall further, with July 2026 contracts at $68.85, against July 2024’s $75.6. Therefore, investors are urged to update their valuation models accordingly as we gain more clarity over Valero’s upcoming estimates.
Consequently, we believe a FCF yield of 12% is appropriate to model for the market’s valuation dynamics. As a result, we need Valero to deliver a TTM revenue of $166.01B by CQ4’26 predicated on an implied hurdle rate of 5%, which is unlikely based on the revised consensus estimates.
As a result, VLO is likely to significantly underperform even a market-underperform 5% hurdle rate over the next four years.
Is VLO Stock A Buy, Sell, Or Hold?
We rate VLO as a Hold for now.
We know the energy story. It’s all over the media, suggesting constrained refining capacity and tight supplies, worsened by the Russia-Ukraine conflict. Furthermore, the political conflict with Russia could help set up the potential for high energy prices for years to come. We know that.
At the same time, countervailing forces from potential demand destruction, an increasingly likely recession, and high inflation crimping spending could also lend further headwinds to the energy players.
Therefore, we urge investors to focus on the price action and tune out from the news to make sense of the market’s expected behavior.
Be the first to comment