

subman
Investment thesis
There is no point in repeating the current uncertainties facing banks. At times of extreme uncertainties, it is especially important to go back to basics. And I see two basics particular worth repeating at this point:
- Buying good banks (such as Goldman Sachs, JPMorgan Chase, et al) at or near book value has been proven to be very successful investments – both in backtesting and in our real experiences. For obvious reasons. We are only paying for the book and getting everything else (such as future earning power) for free.
- For a juggernaut as complicated as JPMorgan Chase (NYSE:JPM), it is a bit hopeless trying to get a good idea of all the moving pieces (let alone where they would be next). In the end, the use of fewer but reliable data points is often more effective than the use of a ton of less reliable data points.
With this background, you will see that based on these simple principles, why it would be a no-brainer to buy JPM should its price drop to about $70 under current conditions where its TBV (tangible book value) stands around $68. Although this is highly unlikely – it did not even happen at the bottom of the COVID panic sale. For an excellent bank like JPM, I’m willing to pay a premium of up to 10x of its dividends, leading to a target share price of $95.
In the remainder of this article, you will see how I reach this magic number based only on two pieces of data: the TBV and the dividend. The two pieces of information with the least amount of ambiguity.
Buy good banks at book value
As just mentioned, buying good banks at TBV should be a no-brainer because you only pay for the book and get everything else for free. However, the issue is that in most cases, good banks are not for sale at TBV, not even close. As seen below, in the case of JPM, historical data have shown on average, it’s priced at 1.35x of its TBV.
Even at the bottom of the COVID panic sale, the stock prices stay above the TBV as seen (thought by a thin margin of only 2%). The last time that JPM was for sale below TBV dates back to 2012 during the peak of the European banking crisis as seen. And you can see how much return the stock has delivered if bought at that time (more than 400% by price appreciation alone, i.e., excluding dividends).
So, the bottom line is: buy JPM if its prices drop below TBV – which most likely you already know. And furthermore, it’s kind of useless advice because it almost never happens.
And the really useful question is: how much premium should you pay? Next, you will see that I’m willing to pay a premium of up to 10x of its dividends.
Source: author based on data from Yahoo Finance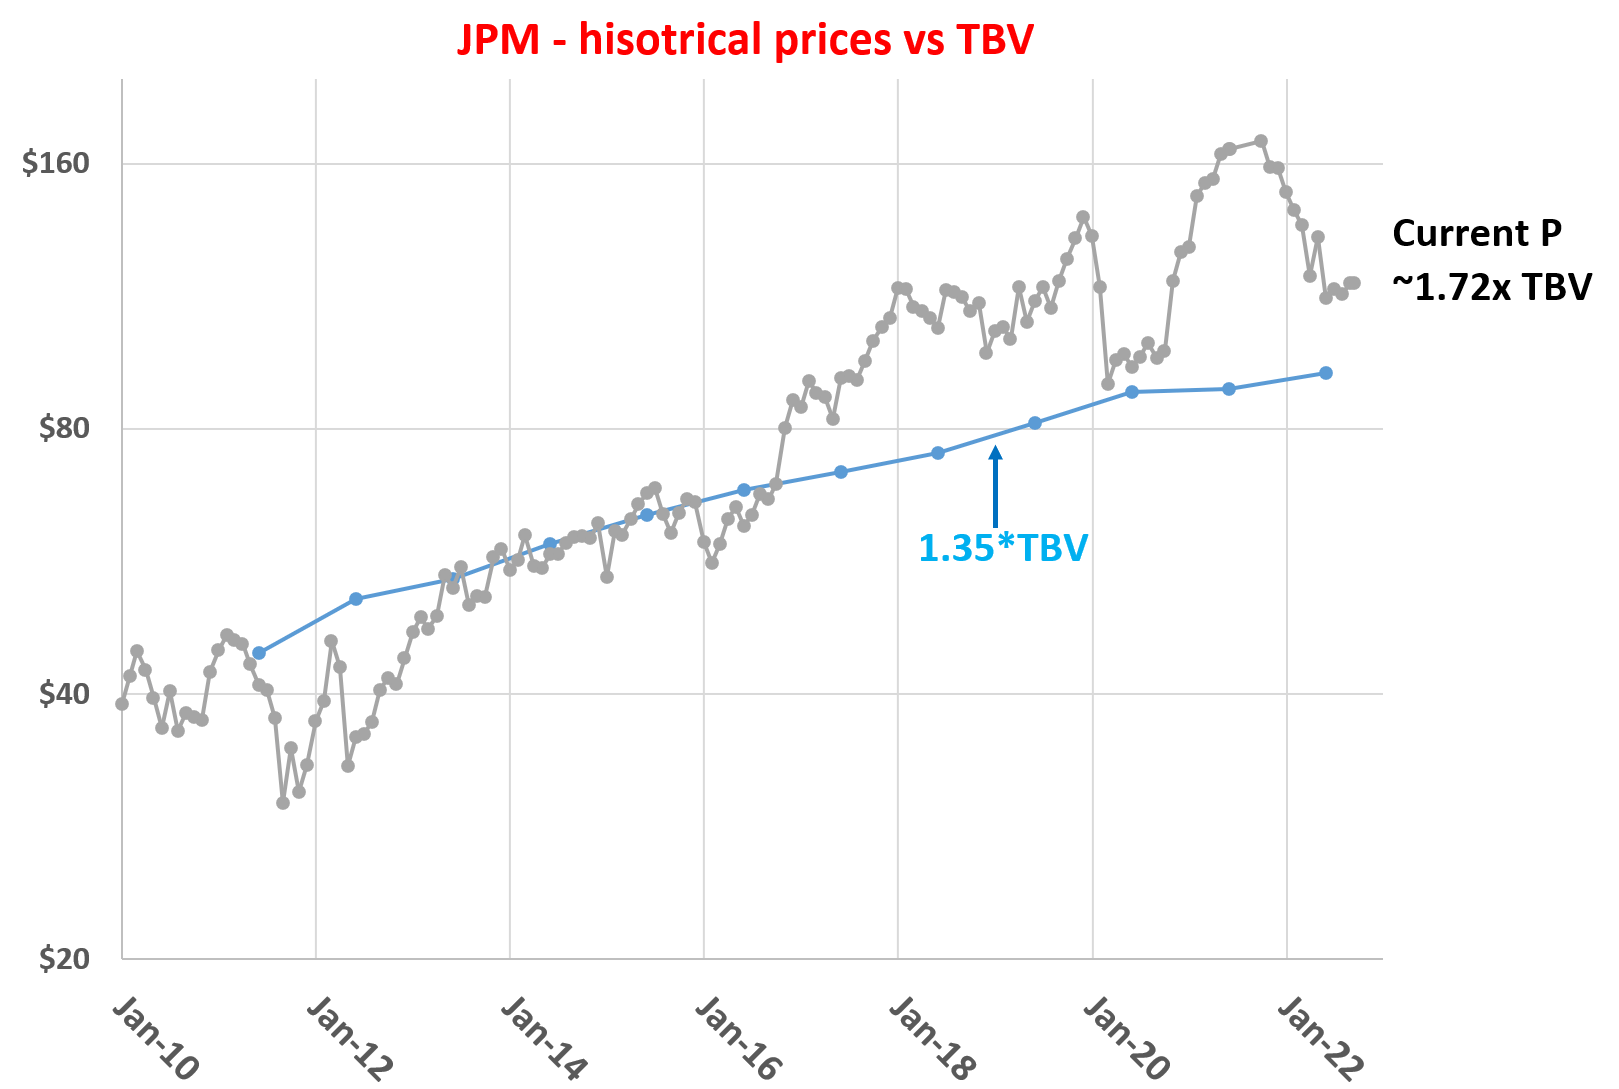
Buy excellent banks at a premium of 10x dividends
For stocks that generate income based on tangible assets (like banks or REITs), a very intuitive and effective valuation approach that we use ourselves is based on its asset and income. The details are provided in my earlier articles, and a brief summary is provided here to facilitate this discussion:
If you think like a long-term business owner (instead of a stock trader), then investing in these stocks is nothing more than buying a piece of assets (monetary capital in the case of banks or real estate in the case of REITs) to collect income (interests for banks and rents for REITs). So the investment value consists of two parts: the value of the property itself and the future rent.
Our valuation method approximates the first part by its book value and the second part by 10x of its dividends. In other words, the investment value (“IV”) of a REIT stock should be:
IV = BV + 10 x dividend
This method offers the advantage of valuation anchored in the most easily obtainable data with the least amount of uncertainty: BV and dividend. In investing, we always prefer the use of a few data points that are reliable than many data points that are less reliable.
With the above understanding, the following chart shows the results of this method applied to JPM since 2010. As can be seen, it captured the market price very nicely in the long term. More specifically, the current IV, based on its latest TBV and dividends, is about $108. And at its current price of $117, it’s getting closer to the IV but still about 8% higher.
And next, we will look under the hood a bit closer, and see how I arrived at a target price of $95.
Author based on Seeking Alpha data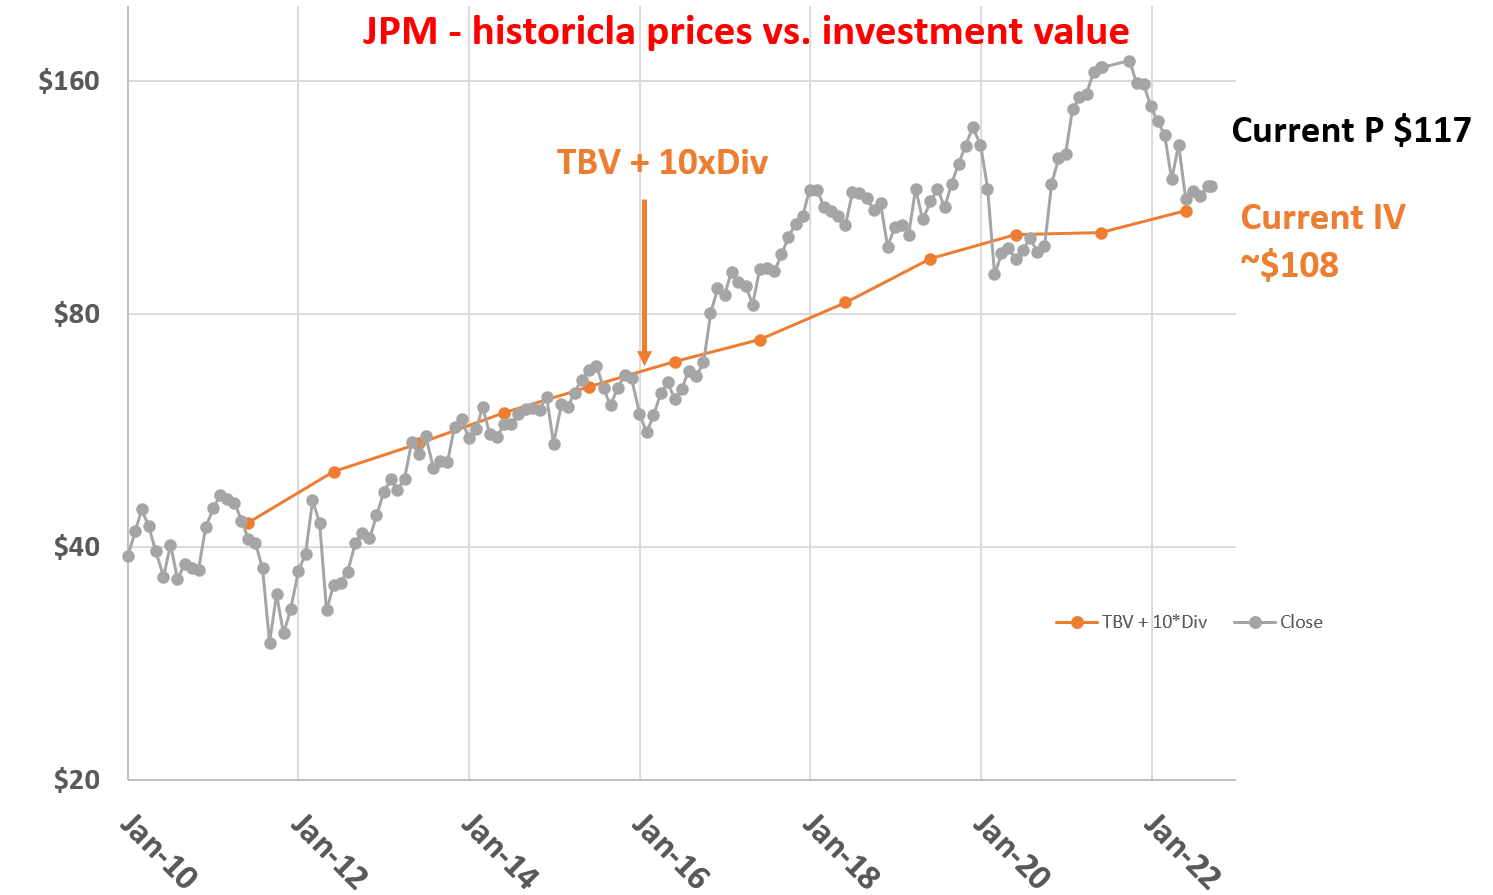
JPM: profitability and growth
JPM is arguably the best-managed diversified bank in the U.S., if not the world. So it is definitely worth a premium. It operates in all the major banking businesses, including consumer & community banking, corporate & investment banking, commercial banking, and asset management. Led by its capable CEO James Dimon and management team, JPM has delivered stable returns as shown below throughout different market conditions. Return on asset (“ROA”) has been consistently close or about 1% since 2015, and return on equity (“ROE”) has been consistently near 10% in the past decade. These profitability metrics compare favorably against other large banks and also the sector mean. Its current ROE of 11.7% is slightly above the sector median of 11.5%, and its current ROA of 1.02% slightly below the sector median of 1.2%.
Source: author based on Seeking Alpha data.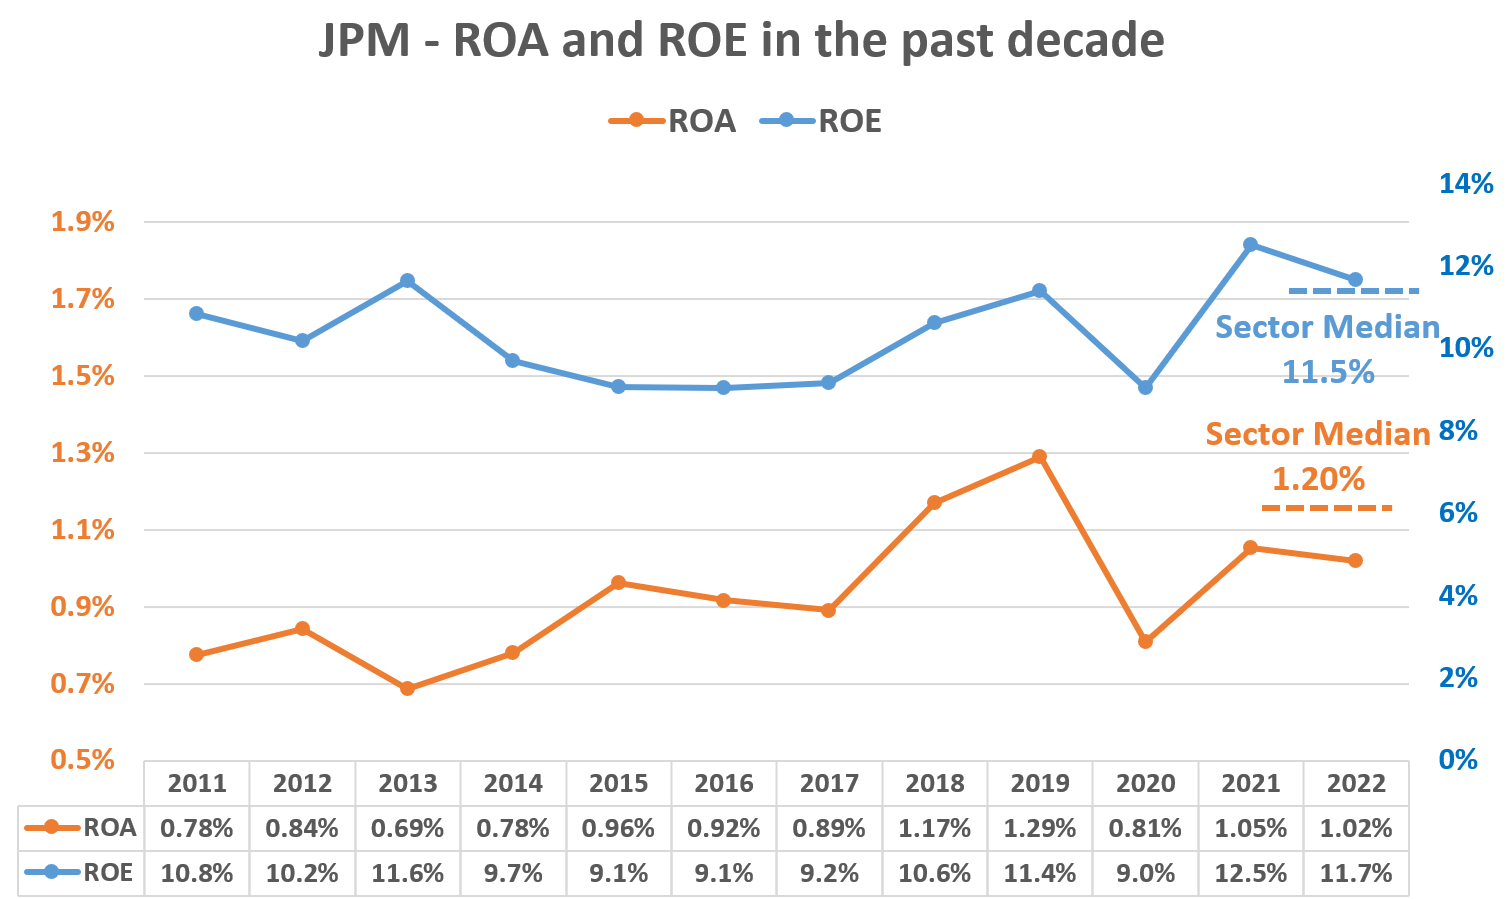
Valuation of bank stock as a bond
Next, why do I use TBV? The short answer is that it is really the best we have for the current worth of a bank. For a large bank holding trillions of dollars of assets and liabilities, I believe even the executives themselves do not exactly know the current value of their bank – let alone how much income they will generate in the future. As argued in my earlier articles,
If you find this hard to agree with, imagine a much smaller scale task – imagine ourselves trying to determine the current net worth of our household. Even for liquid assets such as stock holdings, their value fluctuates day to day and by quite a bit for some days. Less liquid assets such as our house involve much large margin of error. The margin of error further compounds when even less liquid assets such as collectibles, intellectual properties, and business contracts (if you run a small business on the side too). The above uncertainties are multiplied by a LOT for large banks.
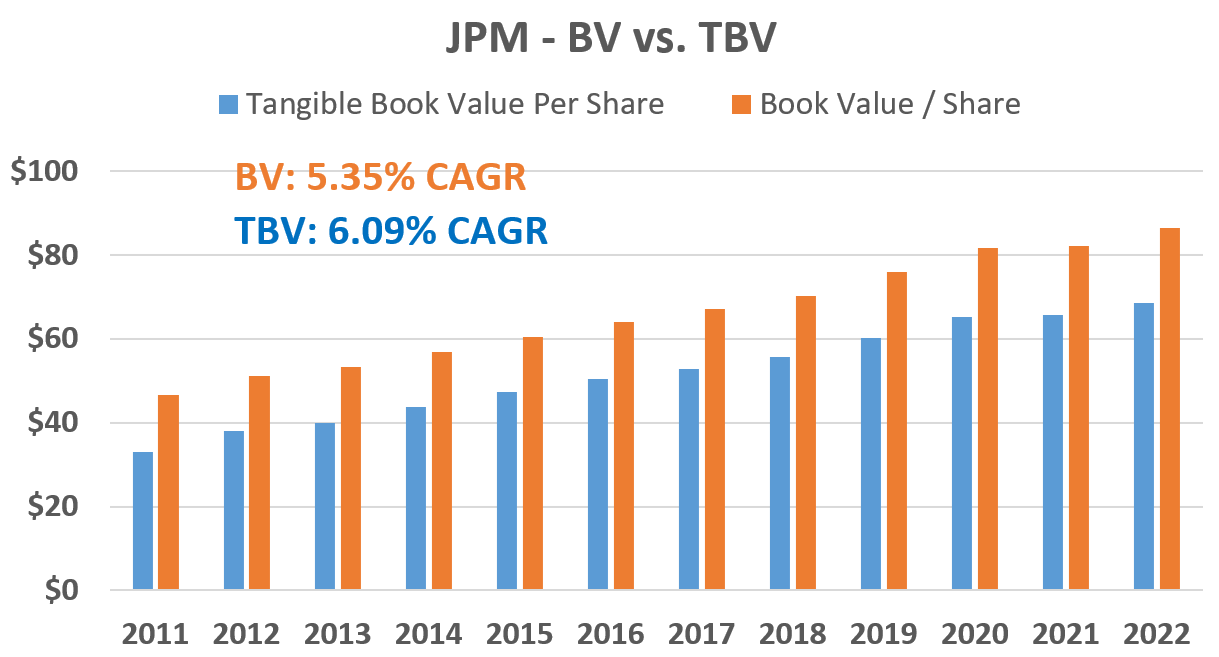
And in the end, TBV is as good as we can get. Even here, there are still uncertainties. To get a very rough sense of how large the uncertainties are, the following chart shows the difference between the TBV and the book valve (including all the intangibles). As you can see the difference between these two could be as large as more than 40% and it has been about 25% in recent years for JPM. Currently, the difference is about 26%. And also note that the discrepancies are larger under uncertain and turbulent market conditions – the discrepancies changed dramatically from 40%+ to about 30% from 2011 to 2013 and stabilized afterward when market conditions stabilized. This is a key consideration in my estimate of the target price, as to be elaborated on later. And finally, when we evaluate growth rate, TBV and BV can also lead to slightly different answers. In JPM’s case, TBV has grown at 6.1% CAGR in the past decade and BV at 5.35%, and I trust the TBV data more.
Source: author based on Seeking Alpha data. Source: author based on Seeking Alpha data.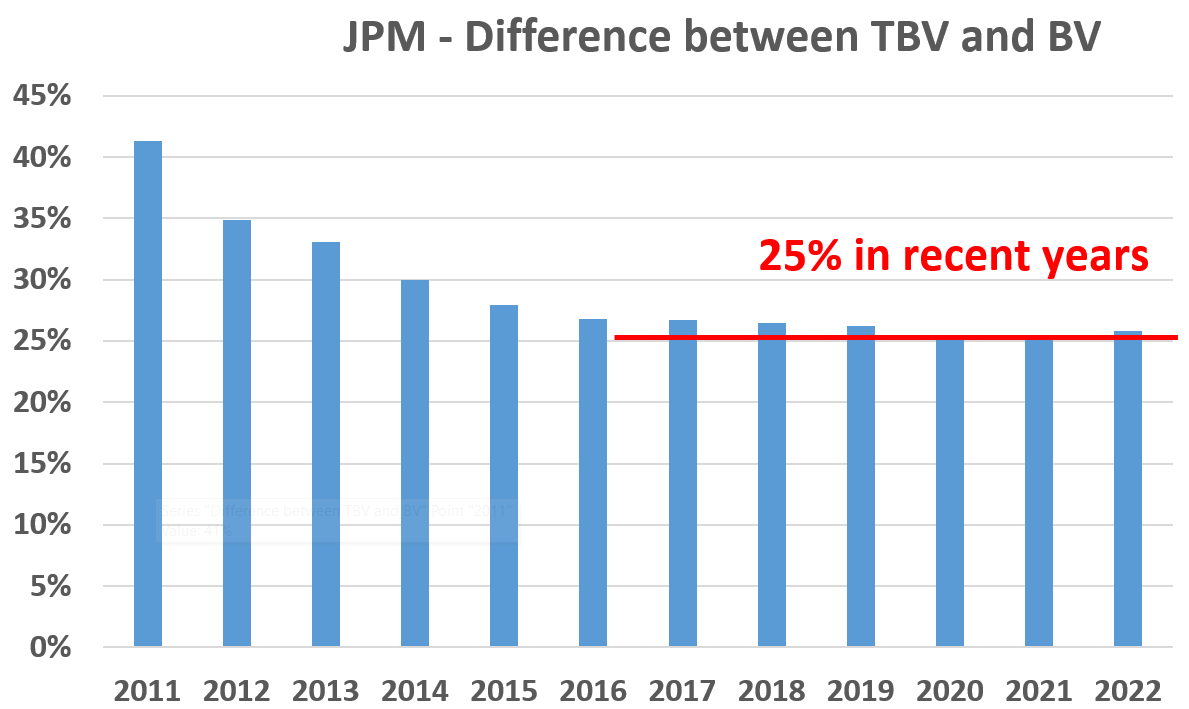
Next, why do I use dividends rather than earnings? The short answer is that dividend is more reliable and indicative of a bank’s performance than earnings. The following chart provides some insights. As seen, for JPM over the past 10 years, the dividend has been steadily increasing (at an impressive 12.7% CAGR). For years that it stagnated, it was because capital constraint regulations (instituted after the 2008 financial crisis) won’t let them.
In contrast, as seen, earnings fluctuate from year to year. Furthermore, earnings are subject to many factors out of anyone’s control: interest rate change, overall economy, or just bad luck. Earnings are also more open and prone to accounting manipulation and interpretation.
For these above reasons, TBV and dividends provide the simplest and most reliable way for me to value a good bank. In a way, this method values a banking stock kind of like a 10-year bond, if you consider the TBV as the face value of the bond and the dividend as the coupon payment. And hope this is quite intuitive to you.
Source: author based on Seeking Alpha data.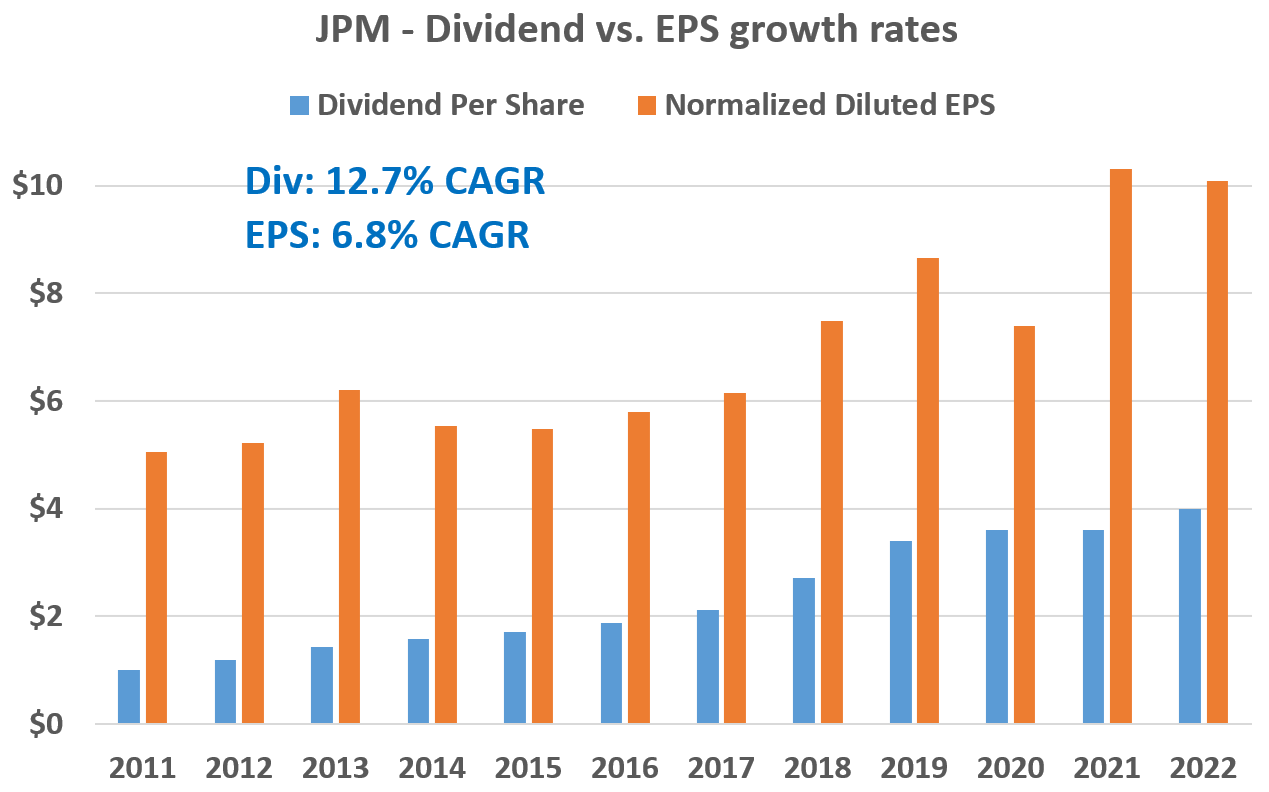
Risks and final thoughts
Then why do I set a target price at $95, not $108? And recall that $108 is the current IV based on its TBV plus 10x its dividends. The reason is to provide a margin of safety to accommodate risks. The business faces many risks, such as interest rates, the trajectory for loan loss provisions, and the possibility of a recession. All of these risks have been adequately discussed in other essay articles by other authors already. So, here I would just focus on the risks associated with the valuation method itself.
Readers have to be aware that book value (either BV or TBV) is a moving target itself. When JPM announced its latest BV of $86.3 per share and TBV of $68.7, the number was delayed already because of the time of the filing. And the numbers keep changing with market conditions. So as investors, we have to estimate its current TBV and more importantly, its future TBV if the market keeps dropping. And my estimate of a $95 price target is based on A) its TBV value when the market drops by another 5% from the current value, and B) the fact that historically, the price of banking stock moves more dramatically than the book value change as I’ve argued in an earlier article. These factors, when combined, led me to the target price of $95, about 12% below the current IV of and about 19% below its current $117. At this price level, I will be buying its asset (which has grown at mid-single digits in the past decade) at face value and getting the income for free (which has grown at double digits in the past as measured by its dividends).
Be the first to comment