

MicroStockHub
PMI survey data produced around the world by S&P Global have an unrivalled reputation for providing advance insights into changing economic conditions, being widely used to anticipate changes in official macroeconomic data such as GDP, industrial production, inflation and employment.
However, the surveys can also provide valuable, unique guidance on corporate earnings trends, as illustrated by the following case study from the United States.
S&P Global Purchasing Managers’ Index (PMI) survey data are widely used around the world by policymakers, governments, investors and businesses as a guide to macroeconomic trends.
The headline PMI data and its various sub-indices are commonly watched or incorporated into models to provide advance signals on key economic metrics such as GDP, production, employment, and inflation. As such, the PMIs are among some of the most market-moving economic data published each month.
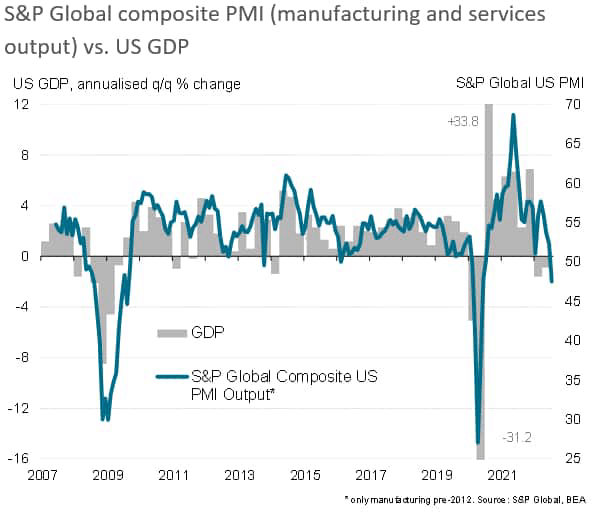
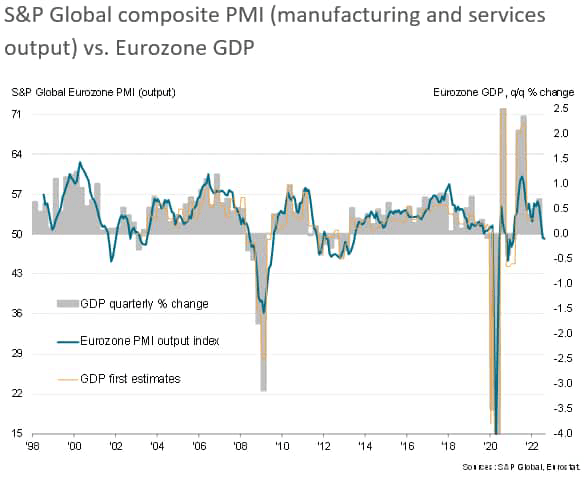
To illustrate, our charts below plot the composite PMIs from S&P Global (covering output of both manufacturing and services) against GDP for the US and Eurozone. In both cases, it is evident that the PMI data provide useful guides to upcoming GDP data, which are released with a delay and tend to be more volatile than the PMI data, the latter providing a clearer trend to the underlying business cycle than the GDP numbers.
Not only can GDP often be distorted by one-off factors such as large trade or inventory swings (as reportedly seen in the US during early 2022), the GDP data are invariably revised after initial publication, often significantly (see Eurozone GDP comparison chart), meaning misleading signals can be sent to economy watchers.
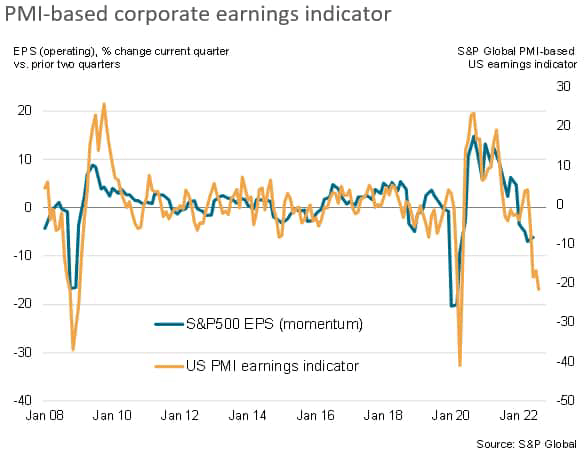
Our PMI-based US earnings indicator exhibits a 74% correlation with changes in reported earnings per share for S&P 500 companies, acting with a lead of several months over the publication of earnings updates to provide analysts with an important monthly steer on corporate performance, anticipating every turning point in earnings over the past 14 years and providing clear insights into actual earnings growth rates.
Looking beyond macroeconomics
However, the surveys can be used beyond the realm of macroeconomic analysis, most notably providing powerful tools for understanding corporate earnings momentum.
By capturing changes in key business metrics such as sales, demand, pricing power, margins and productivity, the PMI surveys can provide very timely signals on underlying trends in profits and earnings.
Our chart below plots a simple composite indicator of US corporate earnings drawn from S&P Global’s PMI data for the US against earnings growth momentum, as measured by the percentage charge in reported earnings per share (EPS) in any given quarter against the average earnings in the prior two quarters. This metric irons out some of the quarter-to-quarter earnings volatility and tends to provide a better guide to actual underlying earnings momentum.
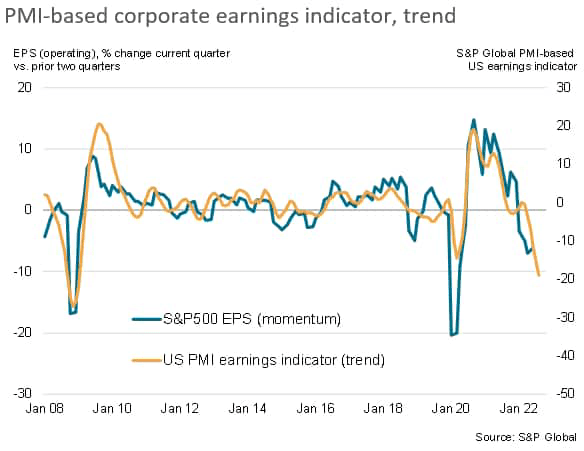
We can also look at the trend in the earnings indicator by likewise comparing latest PMI values against the prior six months. This process removes some of the volatility from the earnings indicator to improve the signal quality, and also improves the correlation with EPS, which reaches 74% with the monthly indicator published ahead of the EPS data.
Earnings under pressure
The PMI-based indicator, updated in these graphics to August, is currently pointing to the sharpest downward pressure on earnings since the global financial crisis (excluding the initial pandemic lockdown months in the first comparison).
This reflects falling demand for goods and services, a margin squeeze from cooling selling price inflation, declining productivity and a broad reduction of pricing power as supply runs ahead of demand for a wide variety of products and services.
In more detail, we look at the five components of the PMI-based earnings indicator below.
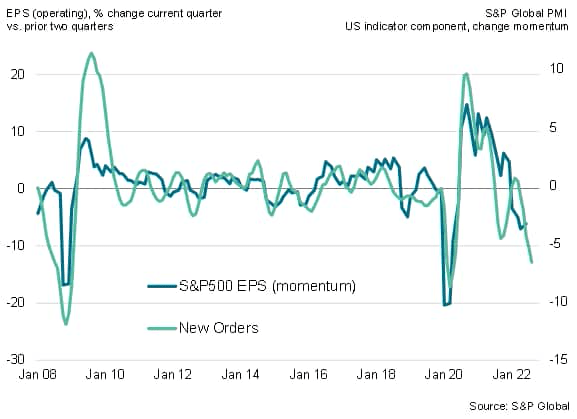
- New orders for goods and services (weight 34%)
New order inflows provide an insight into recent demand conditions, and the survey data have signalled a drop in new orders for both goods and services in August, which means near-term demand growth is now exerting a negative influence on corporate earnings to a degree not seen since the initial months of the pandemic.
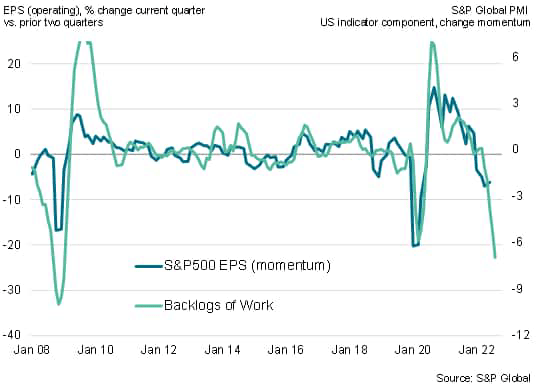
- Backlogs of uncompleted work (weight 24%)
Backlogs of work indicate the extent to which demand is running ahead of supply, or vice versa. Whereas much of the pandemic period saw demand running ahead of supply, both for goods and services, the situation has now reversed, meaning companies are not only coming under pressure to reduce production (or business activity levels), but are also facing reduced pricing power. The drag to earnings from falling backlogs of work is now in fact the steepest recorded since the global financial crisis.
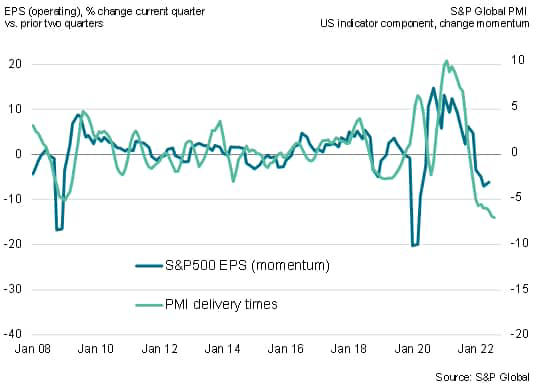
- Supplier performance (weight 10%)
Supplier performance is measured by the PMI index of supplier delivery times and acts as a proxy for capacity constraints in the economy. Capacity constraints in turn provide a steer on pricing power – and in particular the shifting from a buyers’- to sellers’-market.
The pandemic was characterised by supply delays which gave sellers increased pricing power, but in recent months, these delays have started to moderate to the extent that a shift to a buyers market is approaching.
Hence the supply performance component of the indicator is now signalling a drag on corporate earnings performance, and to a degree not seen since survey data were first available in 2007.
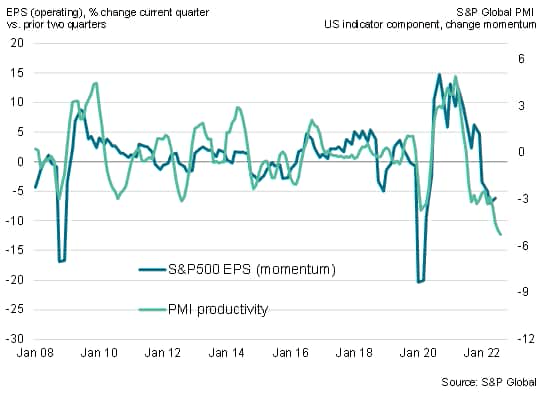
- Labour productivity (weight 7%)
Output per hour is a key ingredient of corporate profitability and hence earnings growth, thus we use the ratio of the PMI surveys’ output and employment sub-indices to provide a gauge of labour productivity in the earnings indicator.
Across both manufacturing and services, August saw output decline yet employment continue to rise, albeit at a reduced rate. Hence the surveys are now indicating declining labour productivity in the US, which is therefore exerting a negative influence on earnings. The degree of this negative pull is the strongest recorded since survey data were first available in 2007.
Application to all major economies and stock market sectors
The advantage of the PMI is that earnings indicators such as the simple model described above can be compiled for each country and all major market sectors covered by the surveys.
This can therefore provide an unrivalled tool with which to determine and benchmark corporate performance, to build sector rotation models and improve decision making – both from policy and investment perspectives.


Editor’s Note: The summary bullets for this article were chosen by Seeking Alpha editors.
Be the first to comment