

Kateryna Onyshchuk
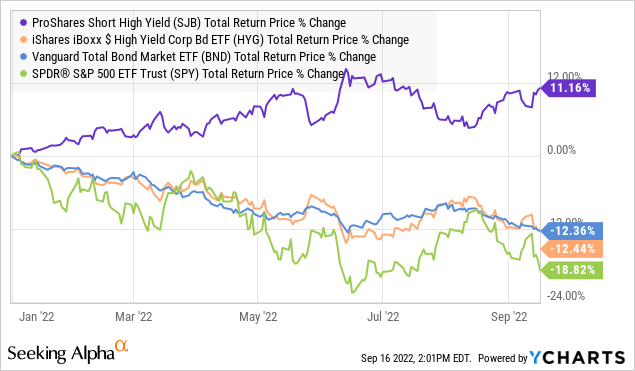
ProShares Short High Yield ETF (NYSEARCA:SJB) is an inverse bond fund that benefits as “junk bond” prices fall and yields climb. The strategy has been a winner this year amid rising interest rates and the broader macro slowdown. Indeed, SJB has returned 11% thus far in 2022 compared to a broad decline in long bond funds and even deeper volatility in equities.
The attraction of betting against high-yield bonds is that they are exposed to both the trend in higher interest rates along with widening credit spreads related to the implied risk of corporate defaults for corporates. SJB is a good option to capture this particular tactical outlook while also being useful for portfolio hedging purposes. We like the fund at the current level with an outlook for further Fed rate hikes as inflation remains stubbornly high could mean more upside to SJB.
What is the SJB ETF?
SJB tracks the daily performance that corresponds to the -1x inverse of the “Markit iBoxx $ Liquid High Yield Index”. This is the same tracking index that the widely traded long iShares High Yield Corporate Bond ETF (HYG) uses. In other words, a -1.5% decline in HYG on any given day would mean SJB rallies by 1.5%. The opposite is also true in terms of the risk that HYG appreciates.
The fund technically holds swaps on the Markit High Yield Index as derivative contracts for the effective short position. By this measure, it’s useful to look at the underlying holdings of HYG to better understand how SJB is positioned. The average maturity here is towards the short or intermediate side of the bond curve. Individual bonds with maturity between 5 and 10 years represent 60% of the exposure, with another 37% maturing with 1 to 5 years. The modified duration of SJB at -4.4 years means the fund is moderately sensitive to direct changes in interest rates.
Credit risk also plays a key role in the strategy, as 98% of the index at or below the “BB-“. More than 40% of the index is rated “B+” or lower. There is a general level of diversification by index sectors, as consumer services correspond to 24% of the weighting. The classified Industrial & Materials sector, which includes energy corporates, is 22% of the Index. Down the line, technology, healthcare, and financial corporates are all represented.
In terms of representative companies, keep in mind there are over 500 issuers with debt from varied names like Carvana Co (CVNA), Caesars Entertainment Inc (CZR), Bath & Body Works Inc (BBWI), and GoDaddy Inc (GDDY). The performance impact from any single issuer is diversified. The point is the high-level themes and factors driving the returns for the overall high-yield market are captured to the downside by SJB.
source: ProShares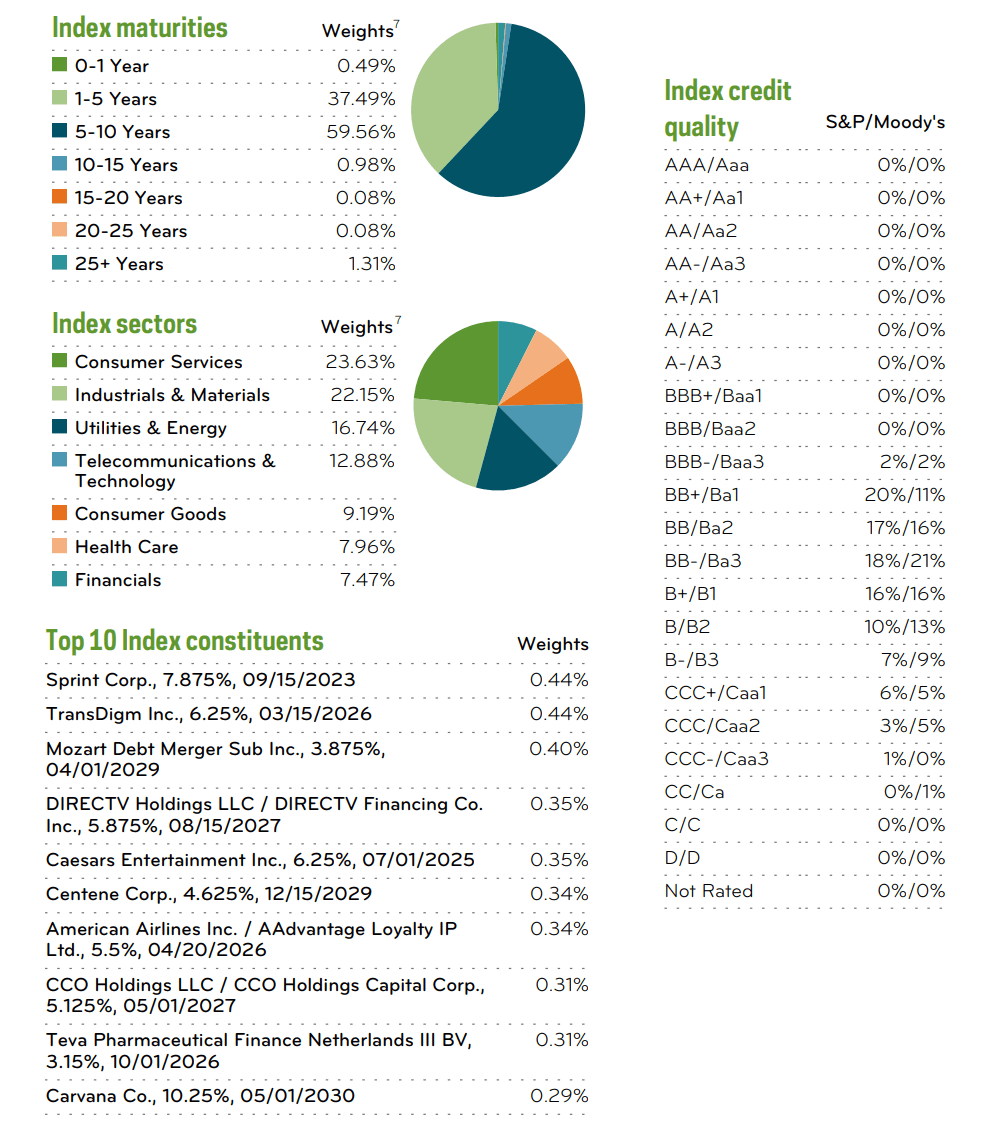
Rising Interest Rates
The bond selloff that has lifted SJB started in mid-2021, where we not the 5-Year Treasury Yield hit a low of 0.51%. Fast-forward, the combination of persistently high inflation and the series of Fed rate hikes this year has helped lift the same 5-year Treasury Rate to a current 3.6%. In many ways, this was the perfect environment for SJB, which returned about 10% over the period as a short bond fund, while HYG was on the wrong side of the trade.
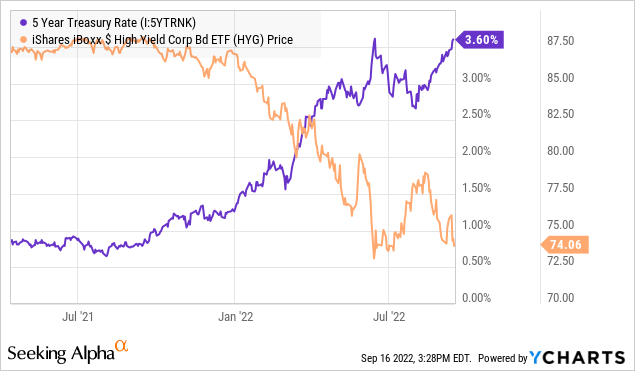
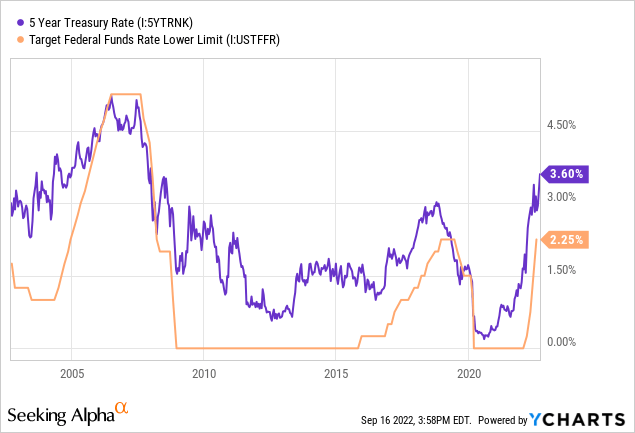
The question becomes how high yields go, considering the risk-free treasury rate is now at the highest level since 2008. The measure reached near 5% at the peak of the last cycle by 2006 suggesting there is a historical precedence of trading higher. In our view, the biggest difference today in 2022 compared to the last time rates reached this level, is that inflation is more structural meaning a higher Fed funds rate would be required to stabilize consumer prices.
Higher Credit Risk
On a scenario where interest rates could fall and bonds rally would be some deep recession defined by a surge of unemployment and weaker consumer spending. High-yield bonds would face widening credit spreads that could outweigh the interest rate dynamic. The “ICE BofA US High Yield Index Option-Adjusted Spread” followed by the Fed is currently at 4.8% but has climbed as high as 11% in 2020 and also reached levels above 20% during the 2008 financial crisis.
source: St. Louis Fed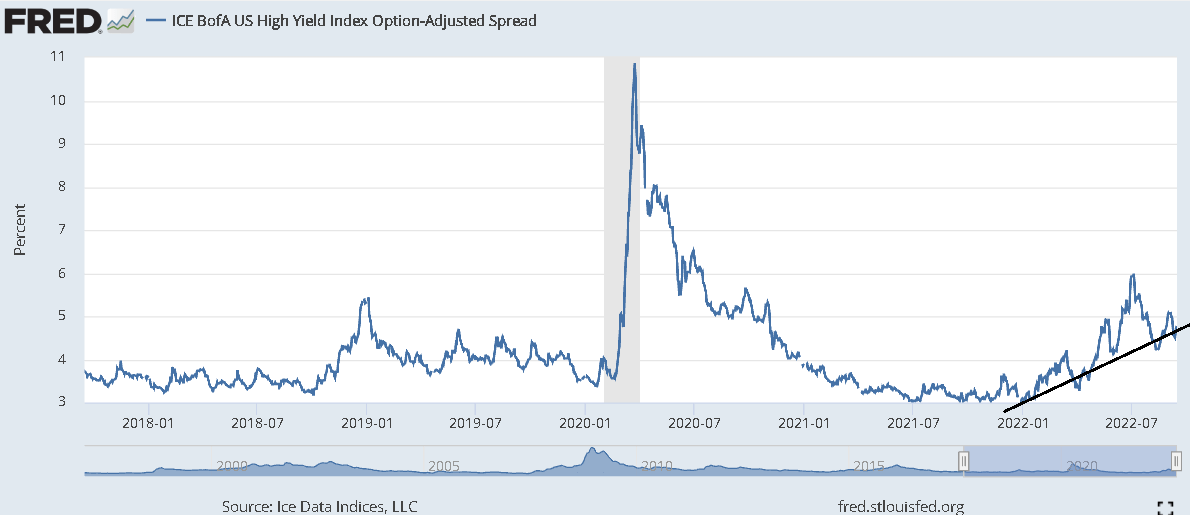
Generally, credit spreads have been trending higher over the past year, yet surprisingly stable and below long-term averages. One interpretation is that the perception of high-yield corporates is that despite the macro headwinds, earnings through Q2 have been resilient and stable cash flows can support key credit metrics. That said, signs that economic conditions along with corporate financial trends are slowing further or deeper than expected would mark the next stage in the cycle.
source: St. Louis Fed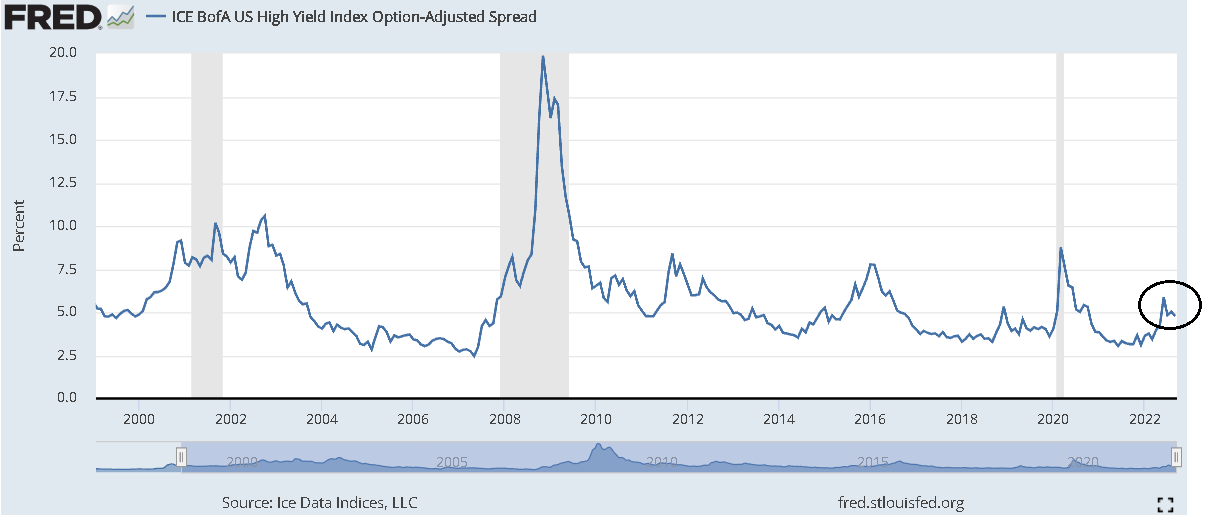
SJB ETF Price Forecast
The bearish case for high-yield corporate bonds is bullish for the SJB ETF. With an expectation that interest rates will need to stay higher for longer along with a weakening operating environment for U.S. corporates, credit spreads have room to widen among financially vulnerable companies. The headlines of global logistics leader FedEx Corp (FDX) pulling earnings guidance and warning of macro headwinds serves as a warning to other parts of the market including high yield bonds.
The other side is that economic conditions stabilize and inflation trend lower, which would provide room for bonds to rally. While we believe this scenario still has a chance of playing out through 2023, we also see risk in bonds is to the downside over the near term. In our view, SJB can rally here.
Seeking Alpha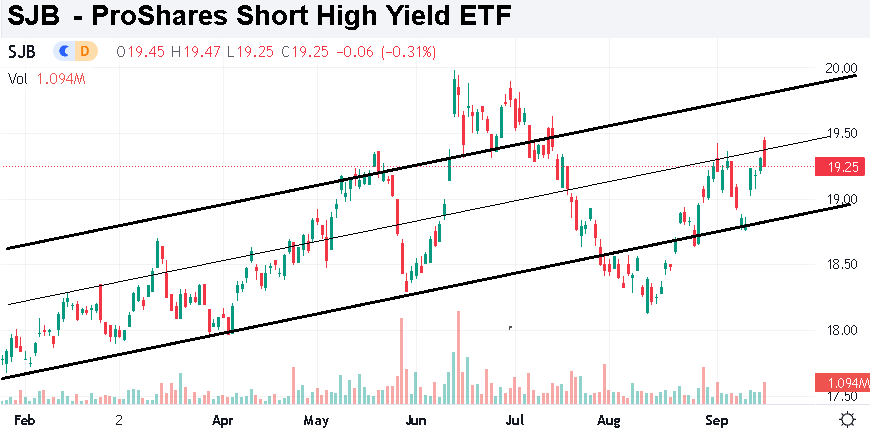
Investors that have exposure to long high-yield bond funds can consider using a position in SJB to hedge that exposure. On a tactical basis, the fund can work as an effective trading instrument to speculate on high-yield market trends over a few weeks and months. There is also a 0.95% annual expense ratio.
Keep in mind that other inverse bond funds target different segments of fixed income. For example, the ProShares Short 20+ Year Treasury ETF (TBF) can climb alongside yields beyond 20-year maturities in the Treasury curve. In this case, the larger effective negative duration targeting the long-end of the curve makes TBF more volatile, or more aggressive than SJB. We like the balance in this ETF as a short high-yield fund that includes a component of corporate fundamentals. Overall, SJB quality fund performs exactly as intended with a unique profile.
Be the first to comment