

Yoshiyoshi Hirokawa
Investment Summary
We are neutral on Cerus Corporation (NASDAQ:CERS) shares and note the stock has caught a bid in recent weeks amid a sector rotation back into US medtech. Technical studies illustrate supportive price action that continues to drive share price appreciation, providing a solid case to capture near-term upside on a speculative buy. For long-term investors however, there’s less flesh to put on the skeleton.
Exhibit 1. CERS 12-month price action
Data: Updata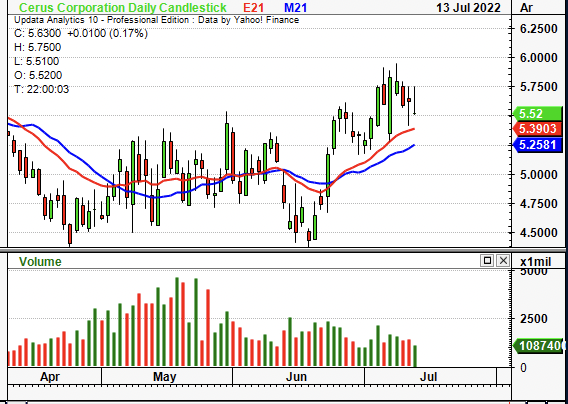
For instance the stock has diverged from growth in its bottom-line fundamentals, and it looks difficult to re-rate based on projected earnings and FCF growth. CERS also remains unprofitable and looks set to remain so into the coming periods. These are unfavorable characteristics in the current macro-climate. We’ve priced CERS at $6.25 apiece and rate it neutral on these grounds.
Recent catalysts to move the needle
In late April, CERS signed a 5-year contract extension for its Intercept system with the American Red Cross. A natural fit with CERS, the Red Cross supplies ~40% of the US market’s blood products. This market is converging to the upside. Growth of platelets remained strong throughout Q1 FY22 and was up 130% year on year, driven by hospital demand for Intercept. It appears there is a preferential shift towards the Intercept system as it complies directly with FDA bacterial safety guidance. It also layers protection across a broad spectrum of pathogens outside of bacterial infection, mitigating costs associated with dual-therapies. With that, Red Cross is now the largest producer of Intercept parts and it is also CERS’ largest account on the product.
Intercept looks to be a long-term compounder with interesting economics tied into the mix. Following the drag of donor demand during the pandemic, platelet growth trends have started to normalize off the low base. Hence, the benefits of Intercept’s platelets are attractive given Intercept has a greater shelf life, and the revenue stream is adaptable to various settings. In effect, there’s 1 product code that can be shifted between hospitals, distributing a single revenue stream across several sources.
Questions initially arise on potential key customer risk and/or concentration risk in CERS’ customer portfolio with the Red Cross deal. However, CERS also signed a 10-year contract extension with Fresenius Kabi for the production of its Intercept kits. Management note the relationship has been solid for more than 20 years, evidencing the company’s account management, customer relationships, and the strength of the industry it is exposed to. A vote of confidence on this front, by our estimation.
Q1 results illustrate fundamental headwinds
Turning to the quarter, CERS printed product revenue of ~$37 million in Q1 FY22, a ~60% YoY growth schedule. Forex impact for Q1 was ~400bps or ~$1 million at the top. Leading this was North American sales growth, up 130% YoY as patient trends normalize back above pre-pandemic levels. Revenue growth was evenly distributed across its operating segments with both the top and bottom US blood centers booking a 100% YoY growth.
Europe sales strengthened by ~19% without forex adjustment. With respect to platelet dose, Q1 growth came in strong with a 141% YoY increase in calculated number of treatable platelet doses. However, Intercept underlined ~98% of product revenue in Q1. This also raises question about concentration risk in its product portfolio, as the top-line now remains unhedged from downside in this market.
Moreover, as seen in Exhibit 2., CERS’ has realized a series of operating losses since FY15, extending to the present date. As a result, investors realize a ~(5%) FCF yield at the time of writing, itself having ticked up since 2017. Investors are agnostic to top-line growth metrics in FY22 having sold down high-beta growth stocks across the year. Instead, investors are seeking to step up in quality and are in search of growth in bottom-line fundamentals. A series of operating losses and FCF losses doesn’t fit the bill here, and leaves us searching for far more in terms of cash flow predictability.
Exhibit 2.
Series of operating losses have carried to below the bottom line, hence, investors realize a ~(5%) FCF yield
Data: CERS SEC Filings, HB Insights
Moreover, as shown in the chart below (Exhibit 3.), CERS remains unprofitable despite sequentially narrowing operating losses over the 5-years to date. Most recently it printed gross margins of 57.9%, a ~300bps sequential decline, and ~450bps contraction YoY from 62.4%. Both ROA and ROIC have lagged as well and present as substantial risk now with the cost of capital cycle shifting upwards. CERS’ WACC is 7.9%, comprised predominantly of an equity weighting. Hence, ~7.2% of the balance sheet has primary claim to the balance sheet.
Such thin margins to work with presents as an impeding risk to cost inflation. It’s unlikely CERS can absorb cost-pressures down the P&L on this presentation, by estimate. However, it has potential for pass-through of costs due to its large and narrow customer base, and due to its niche operating segment. Nevertheless, we’d look to margin growth as one piece of evidence CERS is proving this thesis wrong.
Exhibit 3.
Margins have remained thin despite ongoing sales growth and conducive operating environment
CERS SEC Filings; HB Insights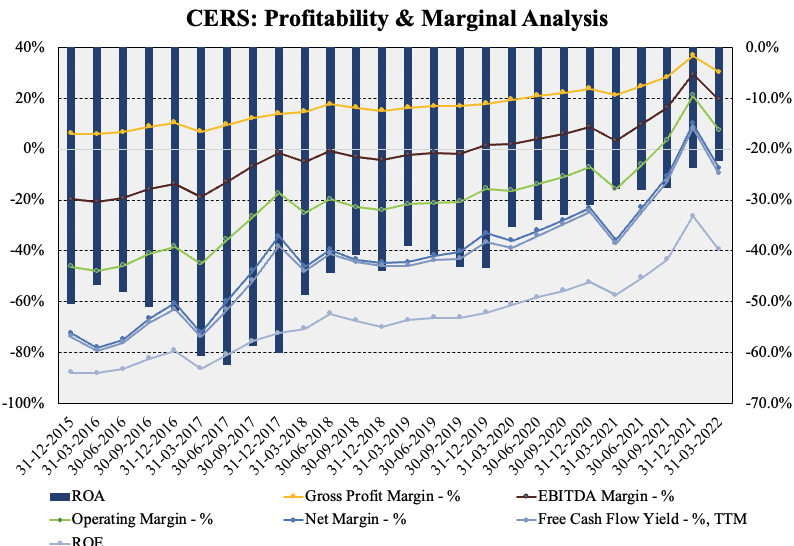
Valuation
Shares are trading at 5x forward sales. Valuing the stock is difficult given the prospects of ongoing cash outflows and a lack of profitability. However, we can see some divergence in the stock to its implied value.
The CERS share price has broken away from its broad-spectrum multiples and now looks overpriced relative to its top-line growth estimates. It trades at ~5x forward sales, ahead of the GICS sector median. It has de-rated in FY22 and valuations have diverged to the downside, as seen below.
Exhibit 4. Divergence from top-line revenue growth assumptions
Data: Refinitiv Eikon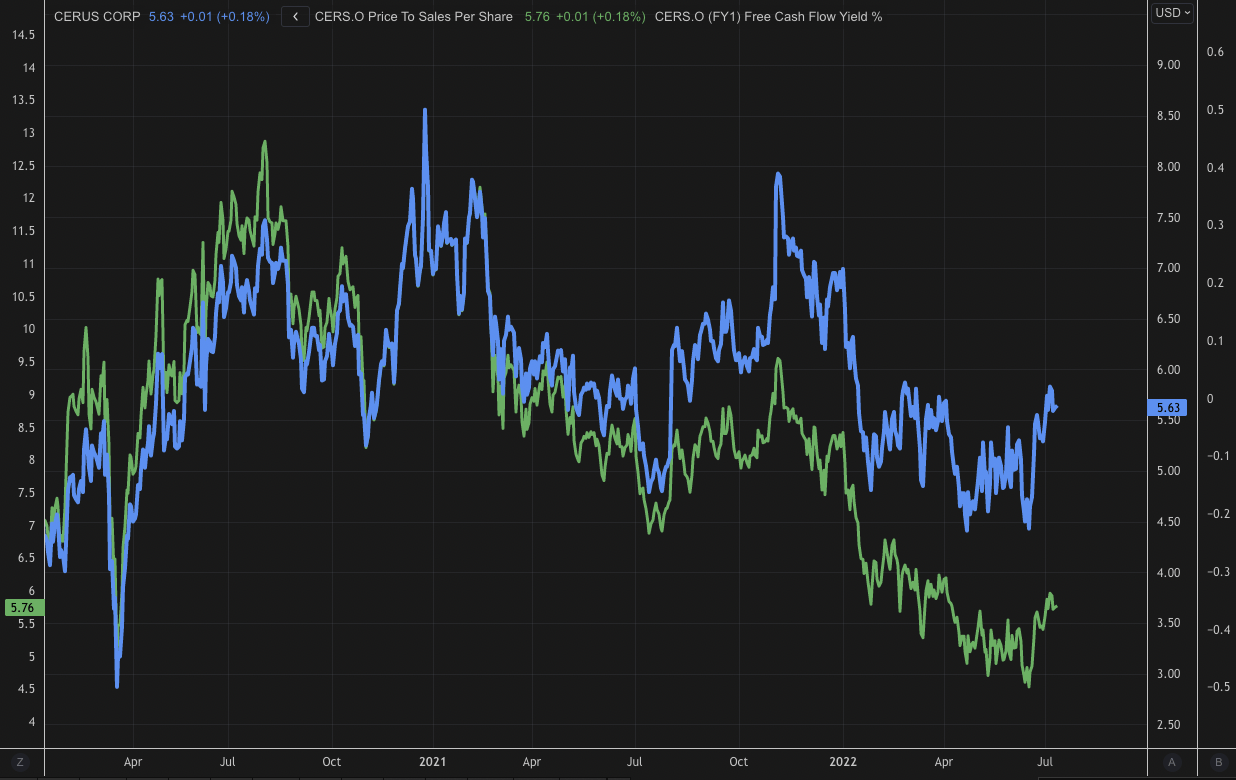
An unambiguous estimation of forward pricing is needed in CERS’ case given its lack of profitability. If it is that investors are rallying the stock on sector strengths, we’d need to gauge price action exquisitely to understand where it might head next. Point and figure charting suggests there are upside targets to the $7.75 zone, as seen below. At 5x forward sales we’ve priced CERS at $5.25, and in combination with the technical studies seen below, are seeking a return objective to $6.25, up to $7.25 if this objective is activated.
Exhibit 5. Upside targets to $7.75 suggesting near-term price action is bullish
Data: Updata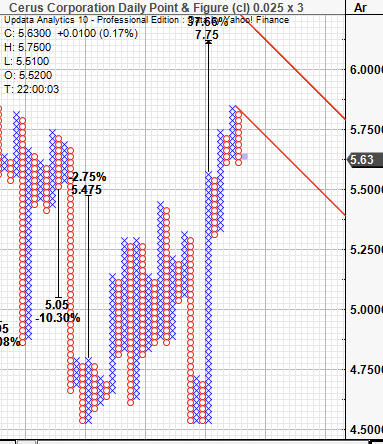
Technicals
Shares have broken through cloud support and this is backed by the lag line now trading well above the cloud. OBV has also trended upwards to confirm the uptrend. Momentum has gyrated but is ticking north and the combination of these 3 signals further bullish momentum, by estimate.
Exhibit 6.
Data: Updata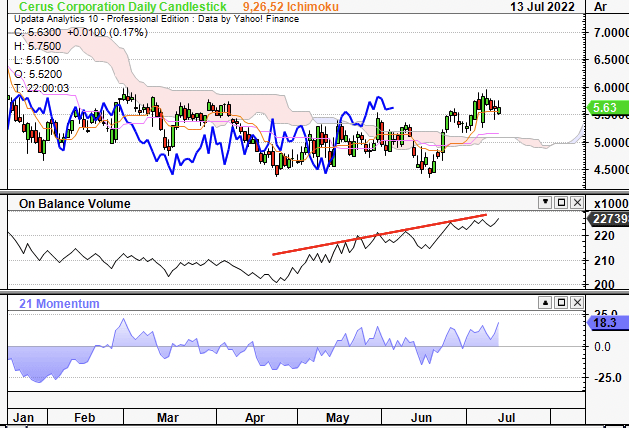
On the fibs, the stock is testing the 38% bar after finding at the 23% tab and then testing support. It broke away from there in a rally and looks toppish at its current levels, but could break to $6.21 if it reaches the 50%. This would confirm the bullish uptrend and serves our price target of $6.25 nicely.
Exhibit 7.
Data: Updata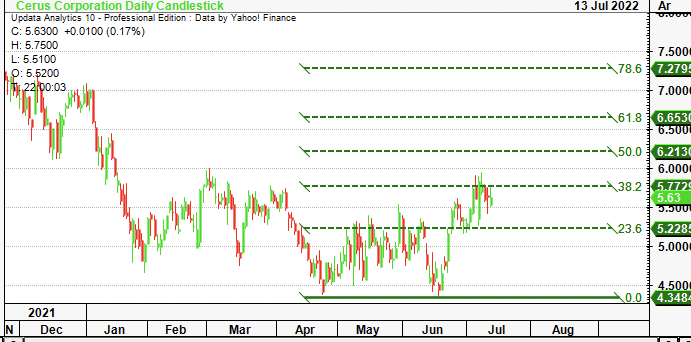
In short
A series of operating losses that look set to continue has us cautious on CERS amid the current landscape. Profitability and bottom-line fundamentals have been paramount in FY22 as investors step up in quality and search for the most defensible names. On that, CERS lacks the forward-looking FCF and earnings growth that justifies its inclusion into a long-only, equity focused portfolio.
However, for those investors with a more near-term horizon, there is technical support and price action appears to be turning bullish. Shares have reversed off supportive lows and are testing key levels on the Fib, with upside targets to the $6.25 and $7.25 marks. On that, another leg or 2 to the upside could serve as an attractive entry point to capture ~11%–29% return objective. Without further confirmation of the reversal, we rate shares neutral.
Be the first to comment