

US Dollar Talking Points:
- The US Dollar is re-testing a key spot of support following a pullback after the release of NFP, and that wiped out gains following the FOMC-fueled rally. Next week sees the focus shift back to inflation with the release of CPI on Thursday morning as the highlight of next week’s US economic calendar.
- The FOMC rate decision had a hawkish tone as the Fed isn’t ready to yet talk up slowing rate hikes. This drove a strong reaction on Thursday with USD strength and equity weakness as primary themes. The big question is whether those can continue through next week’s release of October CPI data.
- The analysis contained in article relies on price action and chart formations. To learn more about price action or chart patterns, check out our DailyFX Education section.
Recommended by James Stanley
Get Your Free USD Forecast
The US Dollar is a composite, at least when examined through the lens of DXY. I think this is an important detail to begin today’s article with as there’s a plethora of questions as to why the US Dollar isn’t running-higher after the release of this morning’s Non-farm Payrolls data, which appears to keep the Fed on a hawkish path.
The headline number was strong, printing at +261k against an expectation of +200k. Average hourly earnings, the wage growth component of the report, came in as expected at 4.7%. The unemployment rate did come out a bit higher than expected, showing at 3.7% against 3.6% expected. So, all in all, not much indication of any significant slowing in the US labor market, which the Fed is tracking as a point of emphasis for when they may slow their rate hike approach.
And the FOMC rate decision had an overwhelmingly bullish impact on the USD in the immediate aftermath; but at this point, the Friday pullback has wiped away the entirety of gains from the Wednesday open. Naturally raising the question as to whether the US Dollar has topped. But, again, we have to draw back to what makes up the DXY quote to get a better picture of what’s happening, and that’s likely due to key supports showing up in EUR/USD and GBP/USD, with both the Euro and British Pound making up 57.6 and 11.9% of the DXY quote, a support bounce in those major pairs can lead to a strong pullback in the DXY, and this is what we’re seeing this morning after NFP.
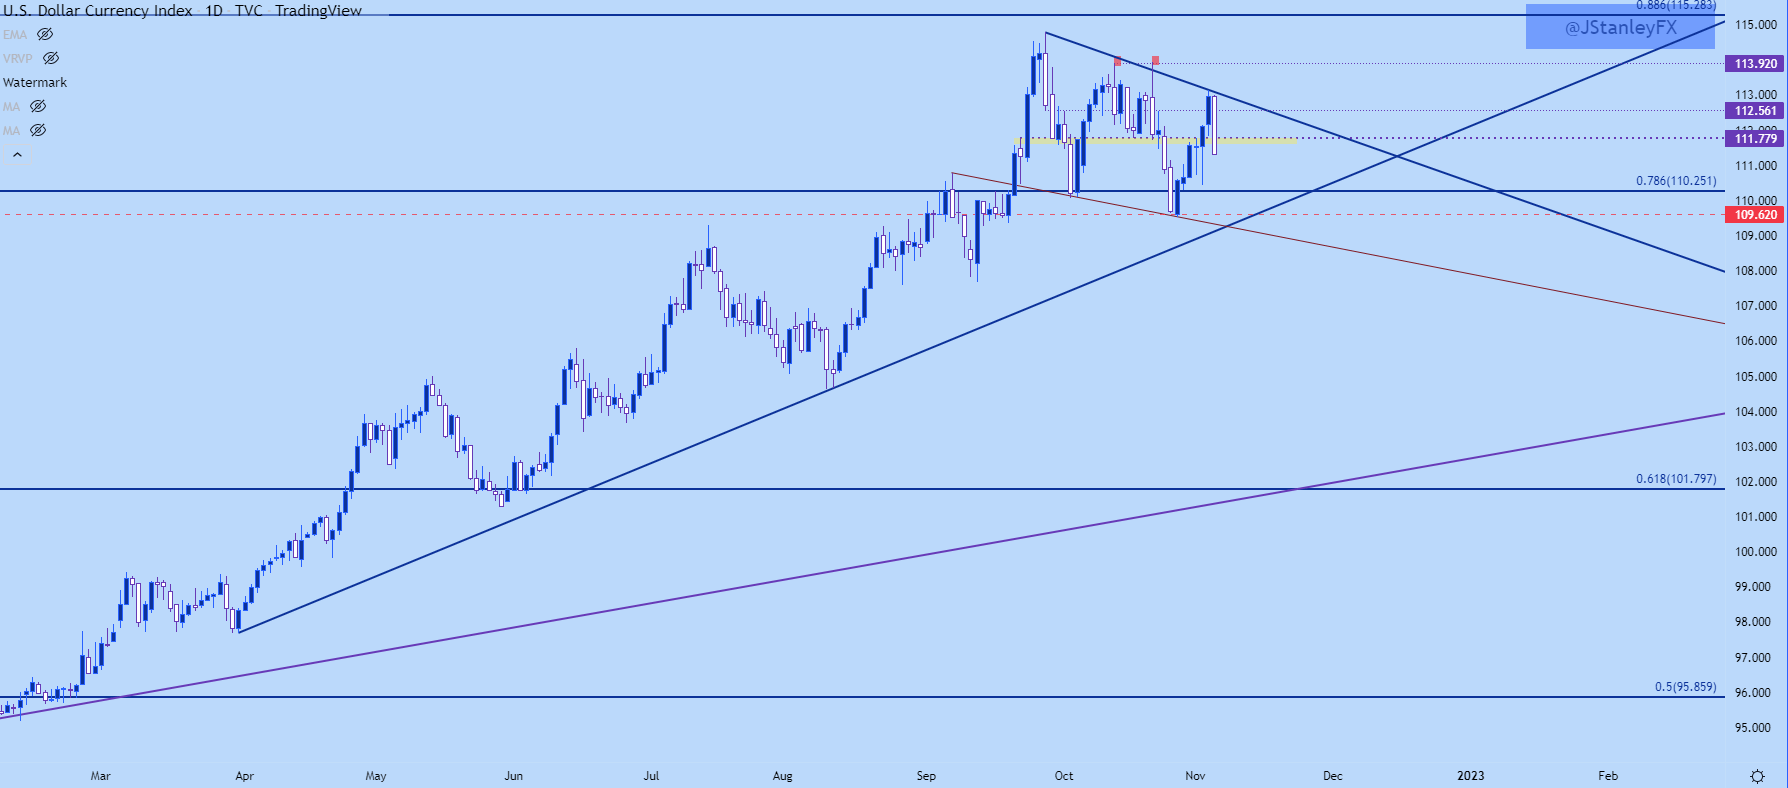
From the USD daily chart, we can see continued compression after price has set a series of lower-highs. The peak-high was set in late-September as the British Pound was putting in a collapse-like move. That then led to the double top, with resistance at 113.92, which led to a strong pullback down to the projected target of 109.62, which helped to set the low last week.
That led to a fast run of USD strength that hastened through the Fed and got another shot-in-the-arm around the Bank of England rate decision on Thursday.
Now, we have pullback after a strong one-sided run. The big question is whether buyers step-in to offer higher-low support which, again, will likely relate to whether bears are willing to hit lower-highs in EUR/USD or GBP/USD.
US Dollar Daily Price Chart
Chart prepared by James Stanley; USD, DXY on Tradingview
US Dollar Shorter-Term
With the USD putting in a strong move-lower, a number of familiar support levels come back into the picture. The spot at 111.74 was a key zone and I had looked at that on Monday as a spot of resistance. That gave way to the FOMC-fueled breakout on Wednesday which led to another test of the 113.05 level that’s helped to catch this week’s high.
The next support on my chart is 110.79, which was the swing-high in early-September. And below that, we have the 110-110.25 zone after which the 109.62 level appears as that spot currently marks the monthly low.
US Dollar Four-Hour Chart
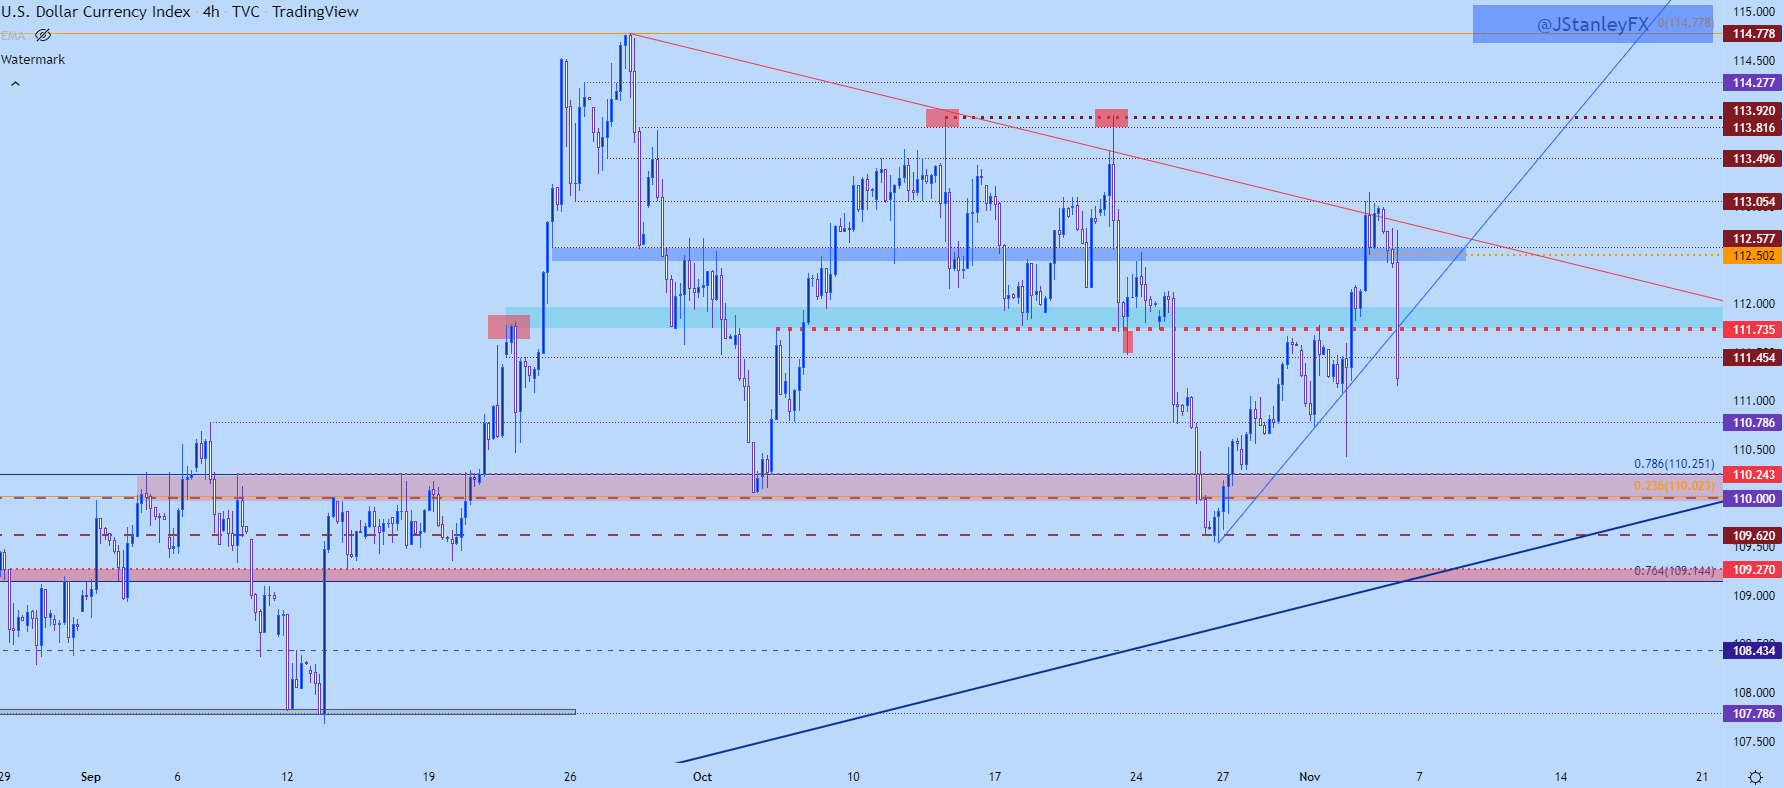
Chart prepared by James Stanley; USD, DXY on Tradingview
EUR/USD
The Euro is a whopping 57.6% of the DXY. So, as I often say, the USD is going to have a very difficult time posing any lasting move without at least some participation from the Euro.
The massive USD up-trend this year has largely been fueled by a mirror image breakdown in EUR/USD, which has taken on an much more aggressive tone since February when Russia invaded Ukraine.
Even the vaulted parity level couldn’t stop the selling, and was a mere speedbump that put the trend on pause for a couple of months before finally succumbing to selling pressure in September. More recently, however, seller have been unable to make much fresh ground below the .9700 level, with this week showing another higher-low at support taken from the .9750 psychological level.
EUR/USD Two-Hour Price Chart
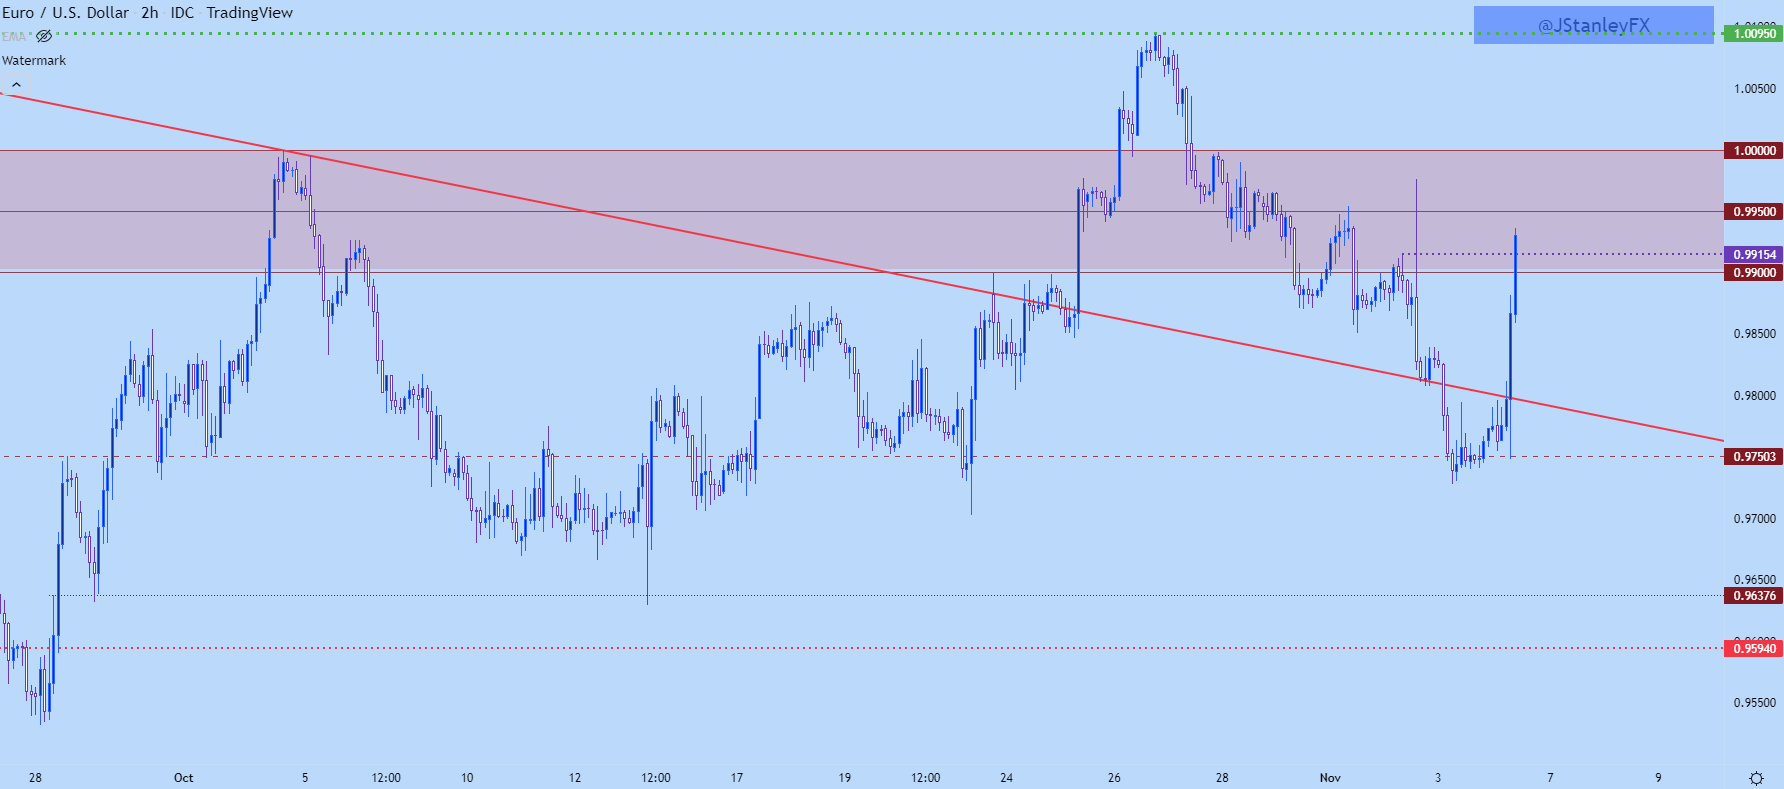
Chart prepared by James Stanley; EURUSD on Tradingview
EUR/USD Longer-Term Structure
The bounce from a lower-high this week is notable for longer-term approaches and this highlights a recent tendency towards both higher-highs and higher-lows in the pair.
Granted, after such a steep fall, even a bullish channel can have connotations as a bearish formation, as this takes on the appearance of a bear flag. But, with that being said, there could be work to be done inside of the channel, especially given how cleanly those psychological levels have traded at .9950 and parity on a shorter-term basis.
If buyers can pose another push above parity, the door opens for a deeper bullish move, with focus on that same 1.0095 level that helped to catch the high last week ahead of the ECB rate decision. Beyond that, the next swing is at 1.0198.
There’s even something for EUR/USD bears as well, as a breach of the .9750 support nullifies the higher-lows and puts sellers back in the driver’s seat.
EUR/USD Daily Chart
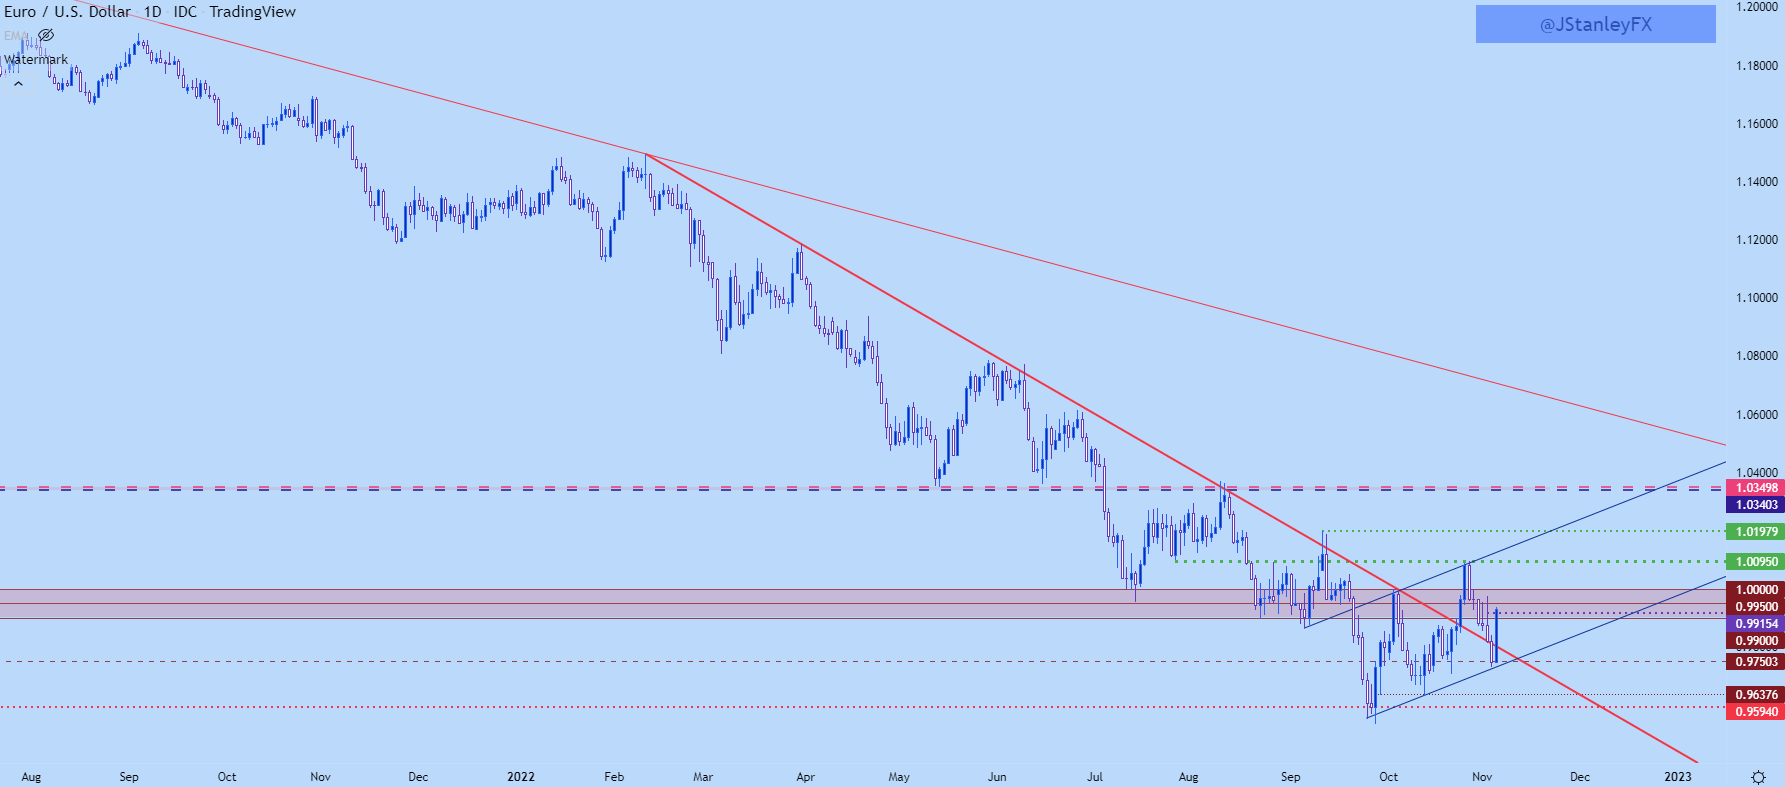
Chart prepared by James Stanley; EURUSD on Tradingview
GBP/USD Reaction to the Reaction
I talked about this one at length yesterday but, first an observation.
Markets are stretched from a number of vantage points. But, it still surprises me how so many want to sell at support or near lows and, all of the sudden, get bullish at resistance or near highs.
This is where multiple time frame analysis can be helpful, to put the short-term drivers in the big picture. We had a similar such scenario yesterday in the British Pound following the Bank of England rate decision.
On Monday, I had shared a descending triangle formation in GBP/USD with support around the 1.1500 handle. That’s a bearish breakout formation and by the time we got to the Wednesday FOMC rate decision, the formation had already started to fill-in. When USD strength heated up, so did the sell-off in GBP/USD.
A quick pullback to resistance at prior support ahead of the BoE rate decision led to another strong move-lower yesterday, all the way until prices began to test back-below the 1.1180-1.1210 support zone. As I wrote in yesterday’s GBP report, just after the dust had settled from BoE, ‘if buyers can push a bounce, then this will look like a support inflection with an extended wick on longer-term charts.’
The weekly chart below shows this well, at this point.
GBP/USD Weekly Chart
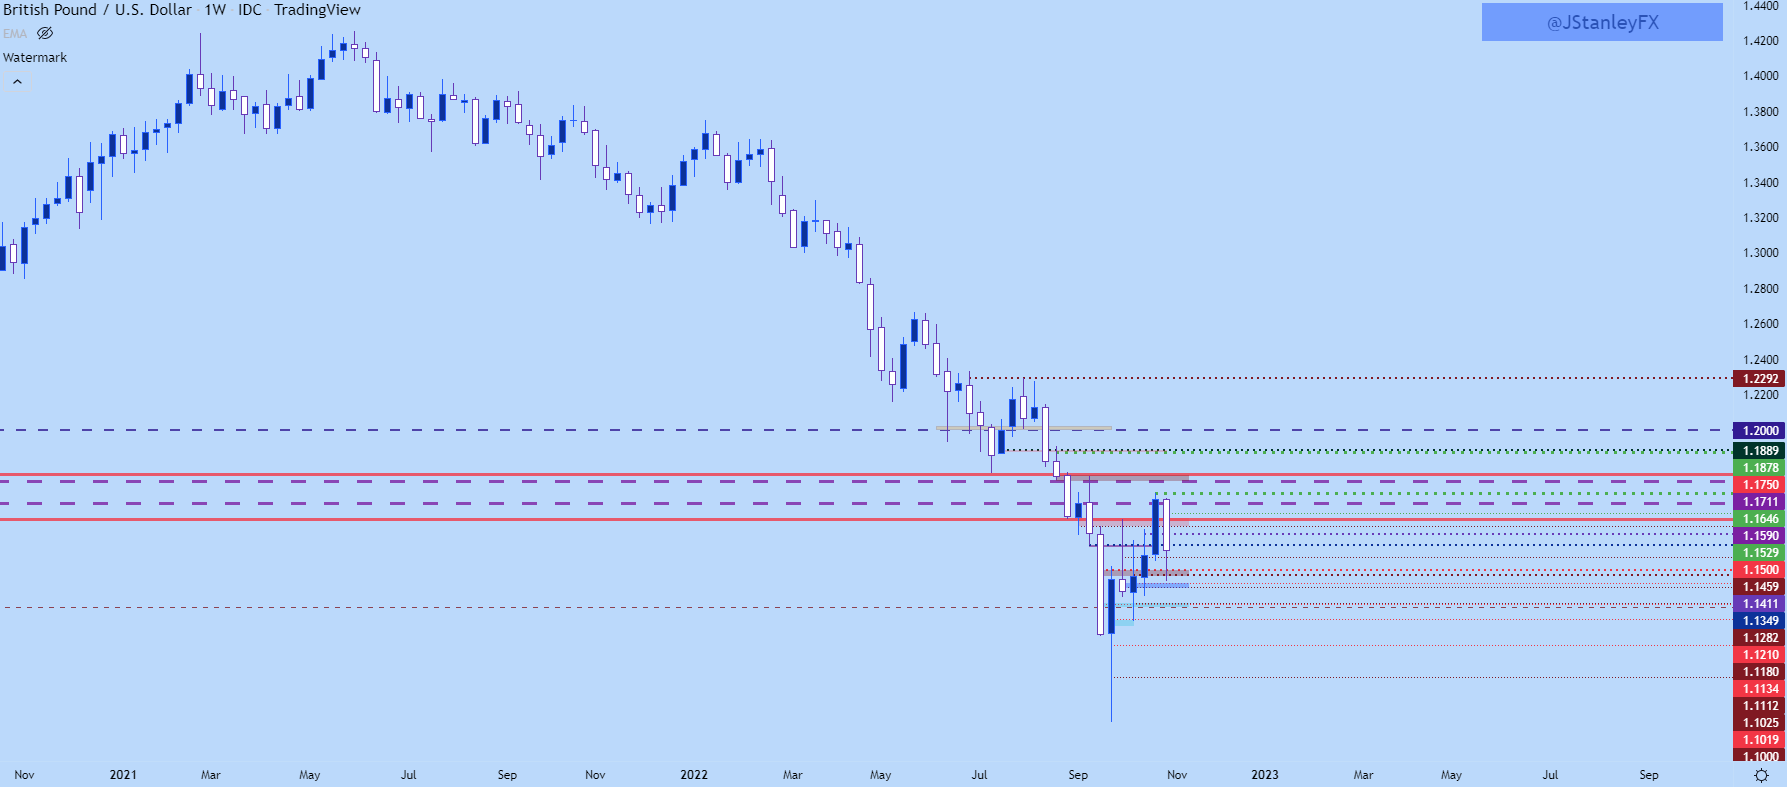
Chart prepared by James Stanley; GBPUSD on Tradingview
From the four-hour chart, we can get a more detailed look at that bounce. Price is fast approaching some prior spots of support that could function as lower-high resistance potential.
For bears, looking for resistance here could be the more attractive path forward, and if resistance doesn’t show, simply look to the next level-up. The 1.1350 level is already nearby, after which 1.1411 comes into the picture. And above that, we have the prior support from the descending triangle, plotted around 1.1459 up to the 1.1500 psychological level.
GBP/USD Daily Chart
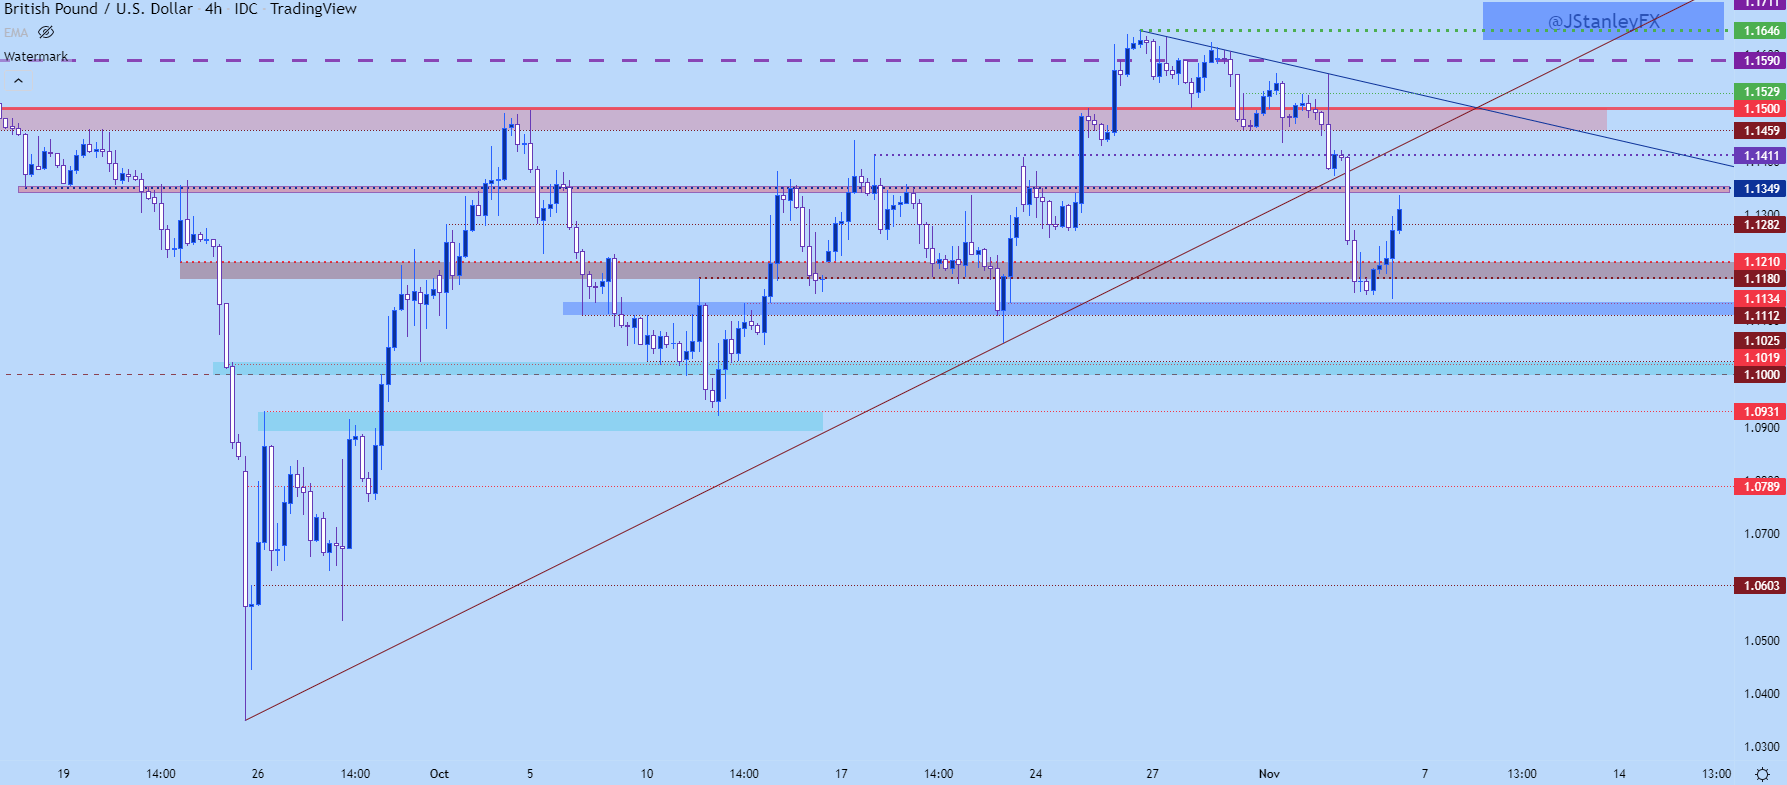
Chart prepared by James Stanley; GBPUSD on Tradingview
— Written by James Stanley, Senior Strategist, DailyFX.com & Head of DailyFX Education
Contact and follow James on Twitter: @JStanleyFX
Be the first to comment