

US Dollar, Treasury Auctions, Bond Yields, Inflation, Federal Reserve – Talking Points:
- Asian equity markets broadly gained during APAC trade as global bond markets stabilized.
- Upcoming inflation figures will likely determine the near-term trajectory of the haven-associated US Dollar.
Asia-Pacific Recap
Asian equity markets broadly gained during APAC trade, following on from the rally seen in US technology stocks overnight as Treasury yields held recent declines. Japan’s Nikkei 225 nudged marginally higher alongside Hong Kong’s Hang Seng Index, while China’s CSI 300 rose 0.9% on the back of yesterday’s intervention by state-backed funds to limit the index’s recent losses. Australia’s ASX 200 slid 0.84% lower.
In FX markets, the cyclically-sensitive AUD, NZD, CAD and NOK slipped lower, while the haven-associated USD and CHF gained ground. Crude oil prices extended its recent decline from yearly highs, creeping back towards psychological support at $63 per barrel. Gold and silver prices also dropped as yields on US 10-year Treasuries nudged a basis point higher.
Looking ahead, US inflation figures for February headline the economic docket alongside the Bank of Canada’s monetary policy meeting.
DailyFX Economic Calendar
Inflation Data to Dictate Near-Term Trajectory of USD
The US Dollar has rebounded sharply against its major counterparts since the tail-end of February, on the back of rising inflation expectations and the notion that the Federal Reserve will have to normalize its monetary policy settings earlier-than-expected.
Indeed, yields on US Treasuries have surged as of late, with the rate on the benchmark 10-year climbing over 55-basis points since the start of February. This notable appreciation in nominal yields resulted in real rates of return soaring over 40-basis points during the same time frame, and in turn put a premium on the haven-associated Greenback.
That being said, strong demand for Treasuries at the upcoming 10-year and 30-year auctions may limit the upside pressure on yields in the near term and take some of the steam out of the US Dollar’s rally. The US Treasury will offer $38 billion of 10-year securities later today, with $24 billion of 30-year bonds scheduled to be auctioned on Thursday.
US 10-Year Treasury Yield Daily Chart
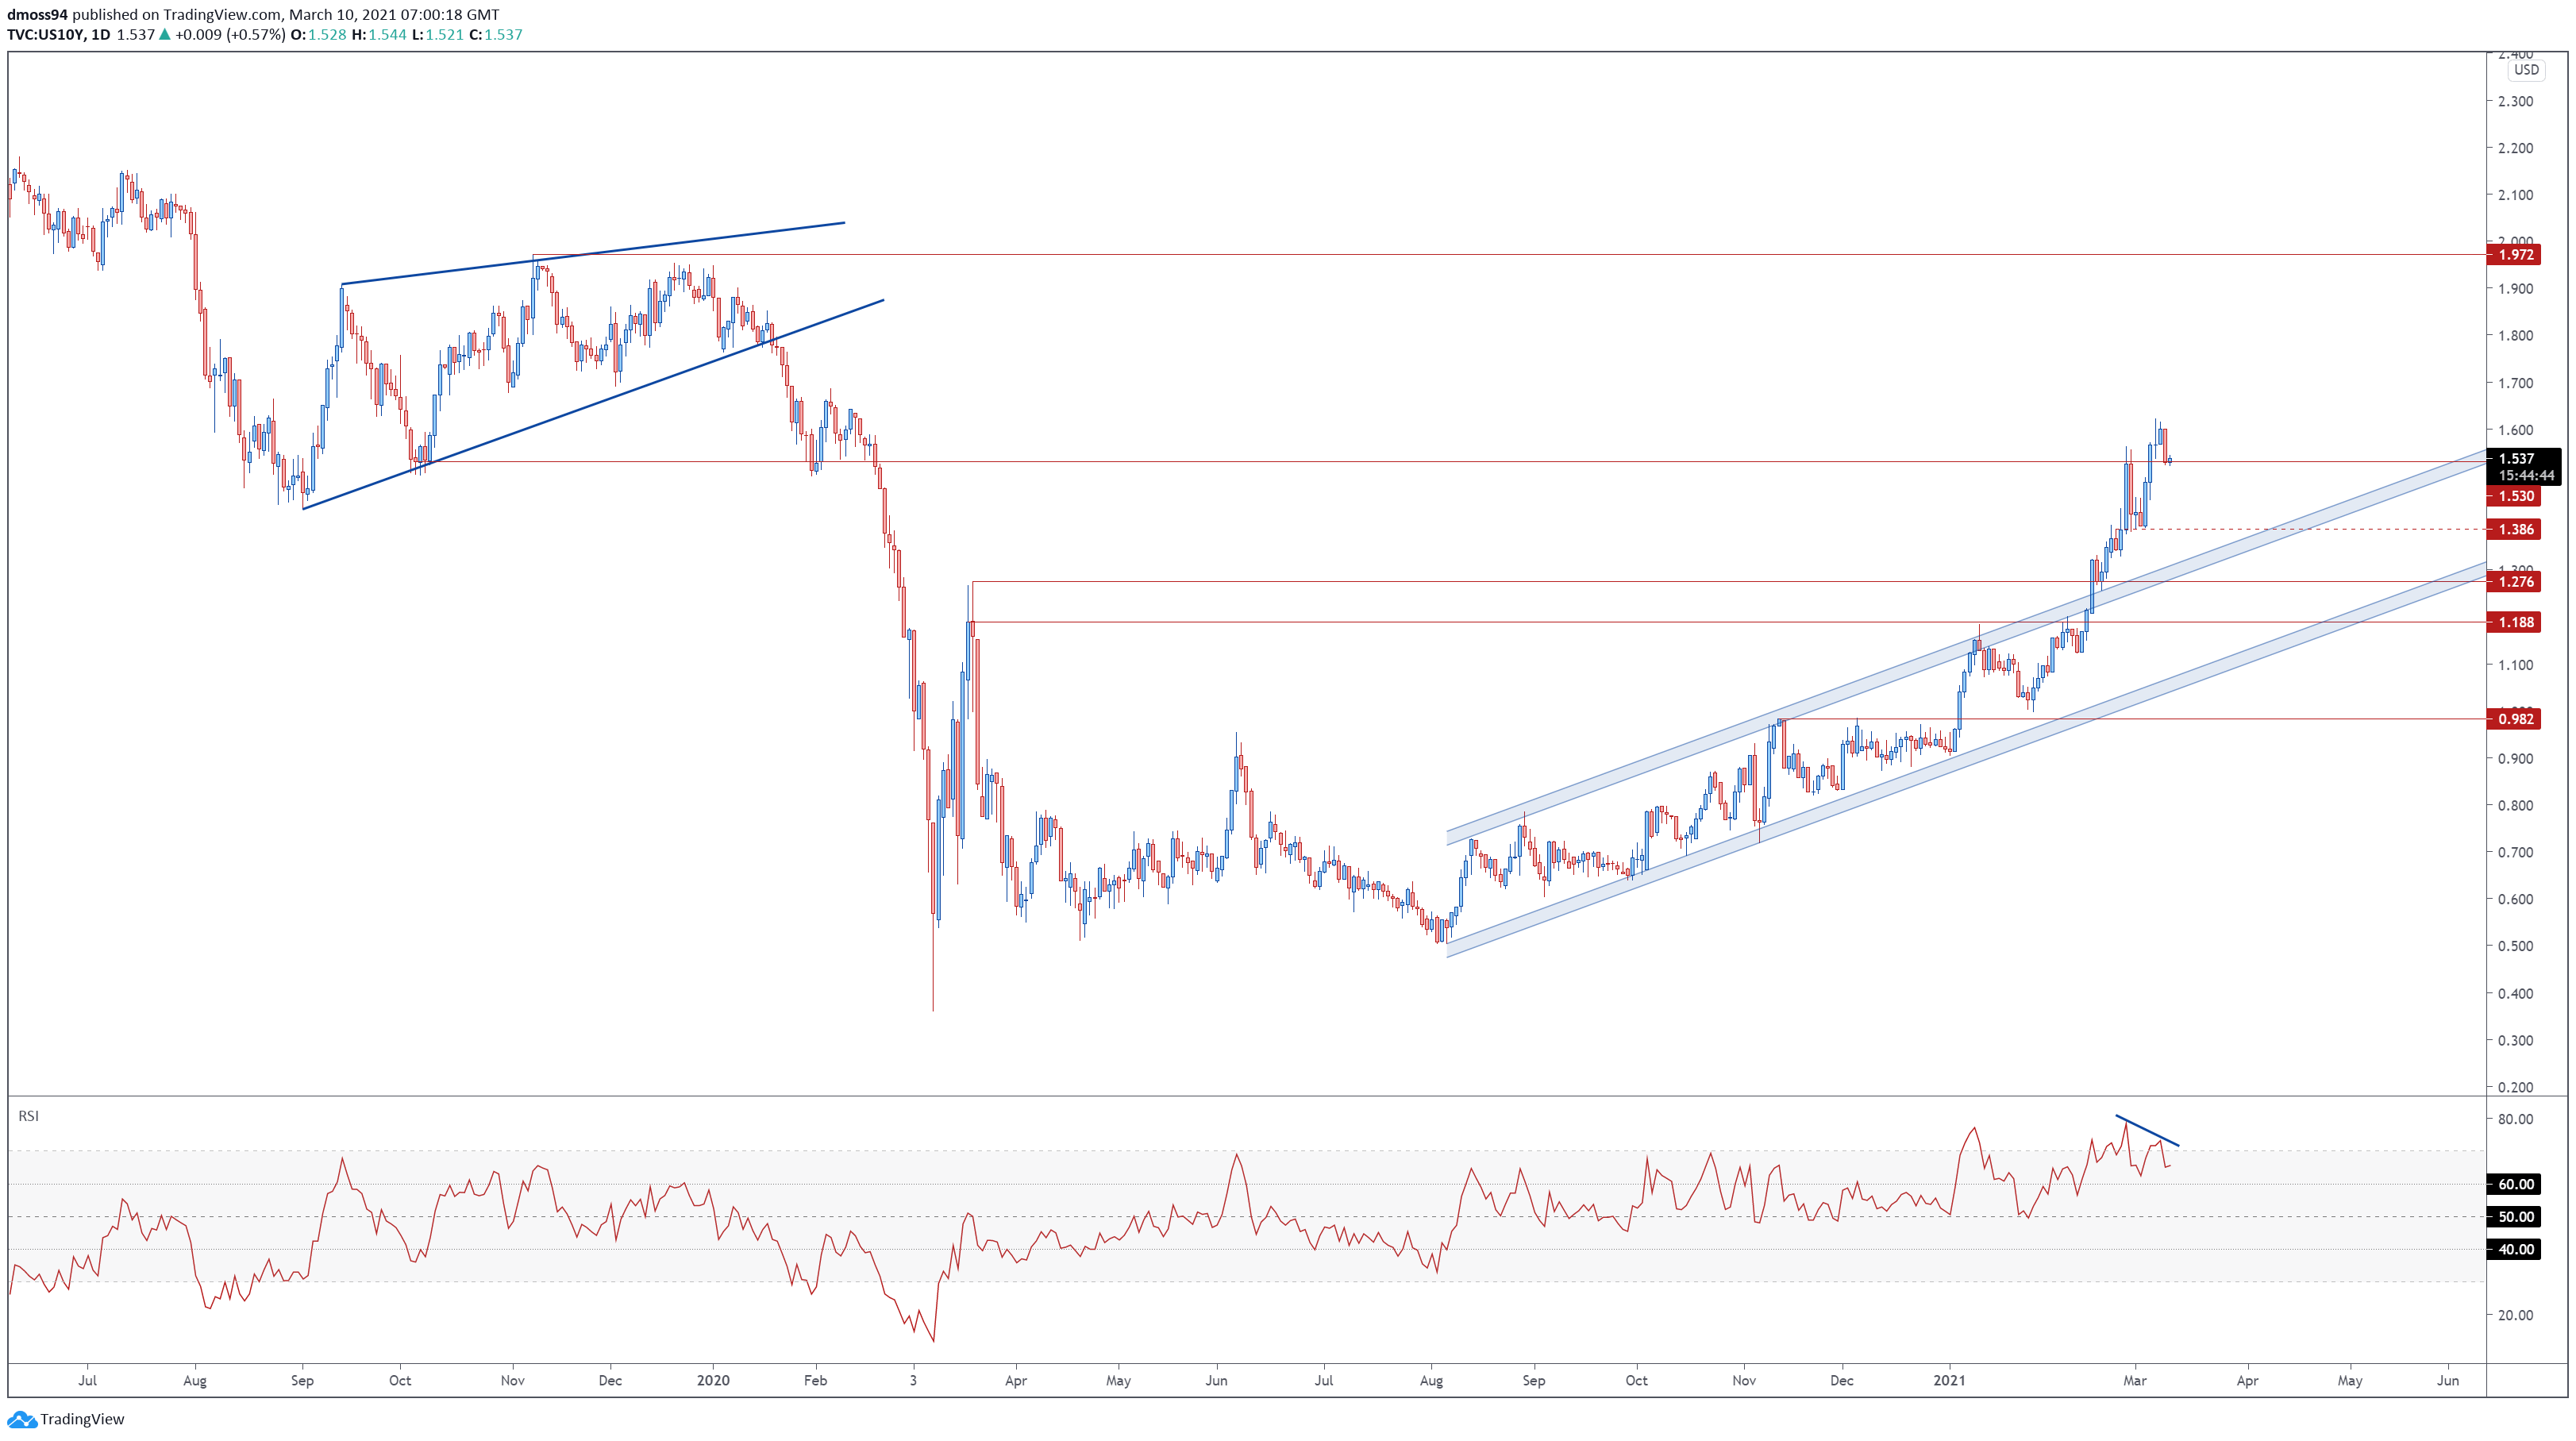
US10Y daily chart created using Tradingview
Of course, lack of demand would result in the exact opposite reaction, as was seen last month when poorly bid auctions of short-term maturities kick-started the rout in global bond markets that sent the rate of return on 10-year Treasuries storming to the highest levels since February 2020.
Nevertheless, short-term technical studies indicate that the recent surge higher in yields may be running out of steam, as rates fail to break psychological resistance at 1.6%. Bearish RSI divergence also implies that a short-term pullback to the monthly low could be on the cards, if rates slice through support at 1.53%.
Attention now turns to the upcoming release of inflation figures for February, which will ultimately dictate the path forward for bond prices ahead of next week’s FOMC monetary policy meeting. A larger-than-expected rise in consumer price growth more than likely brings forward Fed tapering expectations, opening the door for bonds to continue falling and the US Dollar to extend its recovery.
On the other hand, a print in line with, or lower, than consensus estimates could direct capital flows back into Treasury markets and in turn weigh on the Greenback.
US Dollar Index* Daily Chart – Inverse Head and Shoulders in Play?

USD average index daily chart created using Tradingview
*USD index averages EUR/USD, CAD/USD, GBP/USD, AUD/USD
From a technical perspective, the US Dollar appears poised to gain ground against its major counterparts, as the index tracking its average performance against the Euro, British Pound, Canadian and Australian Dollars, breaks above the neckline of an inverse Head and Shoulders pattern.
With price breaching Descending Channel resistance, and pushing above the trend-defining 50-day moving average, further gains certainly appear in the offing. A fresh break above the monthly high would likely clear a path for USD to extend its recent recovery, and bring the February high into play.
The inverse Head and Shoulders pattern suggesting that the Greenback could climb an additional 1.8%, on average, against its major counterparts.
On the contrary, slipping back below the 50-MA would probably result in EUR, GBP, AUD and CAD clawing back lost ground against their haven-associated counterpart.
— Written by Daniel Moss, Analyst for DailyFX
Follow me on Twitter @DanielGMoss

Recommended by Daniel Moss
Top Trading Lessons
Be the first to comment