

GOLD PRICE OUTLOOK:
- Gold prices retreated slightly during APAC trade as the US Dollar rebounded alongside yields
- US February consumer price index data is in focus as traders look for signs of inflation overheat
- The world’s largest bullion ETF saw continuous outflows as investors turned to riskier assets

Recommended by Margaret Yang, CFA
Get Your Free Gold Forecast
Gold prices retreated slightly during the APAC session on Wednesday as the US Dollar (DXY) index rebounded alongside longer-term Treasury yields. In the prior day, gold prices posted the biggest jump in two months as Treasury yields retreated after a strong 3-year note auction. A decent pullback in the US Dollar (DXY) index on Tuesday offered gold prices some relief after a prolonged selloff. This rebound may once again prove to be short-lived however, if yields resume their upward trajectory amid a broad reflationary theme. The upcoming 10- and 30-year Treasury note auctions will be in focus this week.
On the macro front, gold traders are eyeing US February consumer price index data for clues about the Fed’s future tapering trajectory. In view of an improved recovery outlook and surging raw material prices over the past few months, upward price pressure is expected to emerge in the months to come. Any signs of inflation overheating may intensify market speculation about the Fed tapering stimulus efforts and may fuel further strength in longer-dated yields as well as the US Dollar. This scenario may exert further pressure on precious metals.
Meanwhile, markets await a fresh US$ 1.9 trillion US Covid relief package to be approved by the House this week, though the expectation has largely been priced in and therefore should have limited market impact.
US real yields(nominal yield – inflation), represented by 10-year Treasury inflation-indexed securities, fell 7bps to -0.69% on March 9th from a day ago, offering bullion prices some relief. Real yields exhibit a historically negative correlation with gold, with their 12-month correlation coefficient standing at -0.89. Further rises in real yields may serve to undermine gold prices, which is non-yielding.
Gold Prices vs. 10-Year Treasury Inflation-Indexed Security
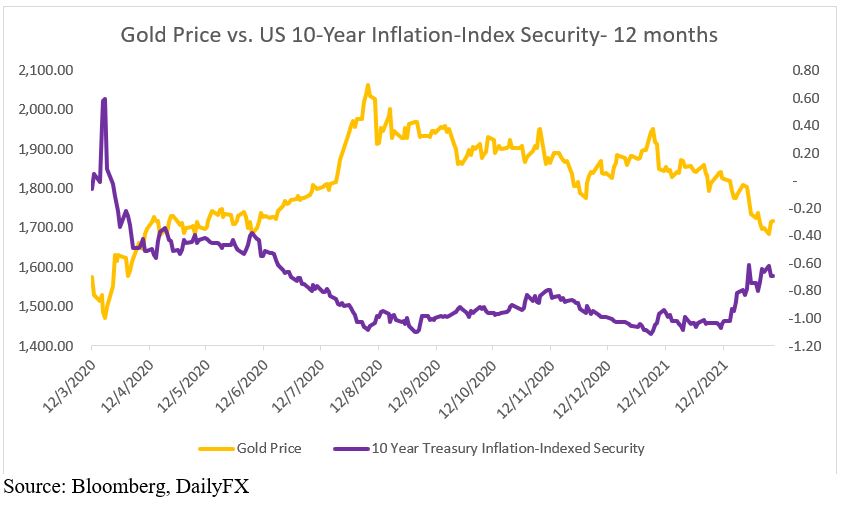
Source: Bloomberg, DailyFX
The release of US inflation figures may also lead to heightened volatility in the US Dollar (DXY) index, which tends to be inversely correlated to gold prices. They have a correlation coefficient of -0.69over the past 12 months.
Gold vs. DXY US Dollar Index – 12 Months

Source: Bloomberg, DailyFX
The world’s largest gold ETF – SPDR Gold Trust (GLD) – saw continuous net capital outflows over the past few weeks. The number of GLD shares outstanding fell to 364.3 million on March 9th from a recent high of 407.1 million observed on January 4th, marking a 42.8 million decline over two months. Gold prices have fallen by 11.6% during the same period, suggesting that capital was fleeing from the yellow metal into riskier assets looking for yield and growth. Gold prices and the number of outstanding GLD shares have exhibited a strong positive correlation of 0.92 over the past 12 months (chart below).
Gold Price vs. GLD ETF Shares Outstanding – 12 Months

Source: Bloomberg, DailyFX
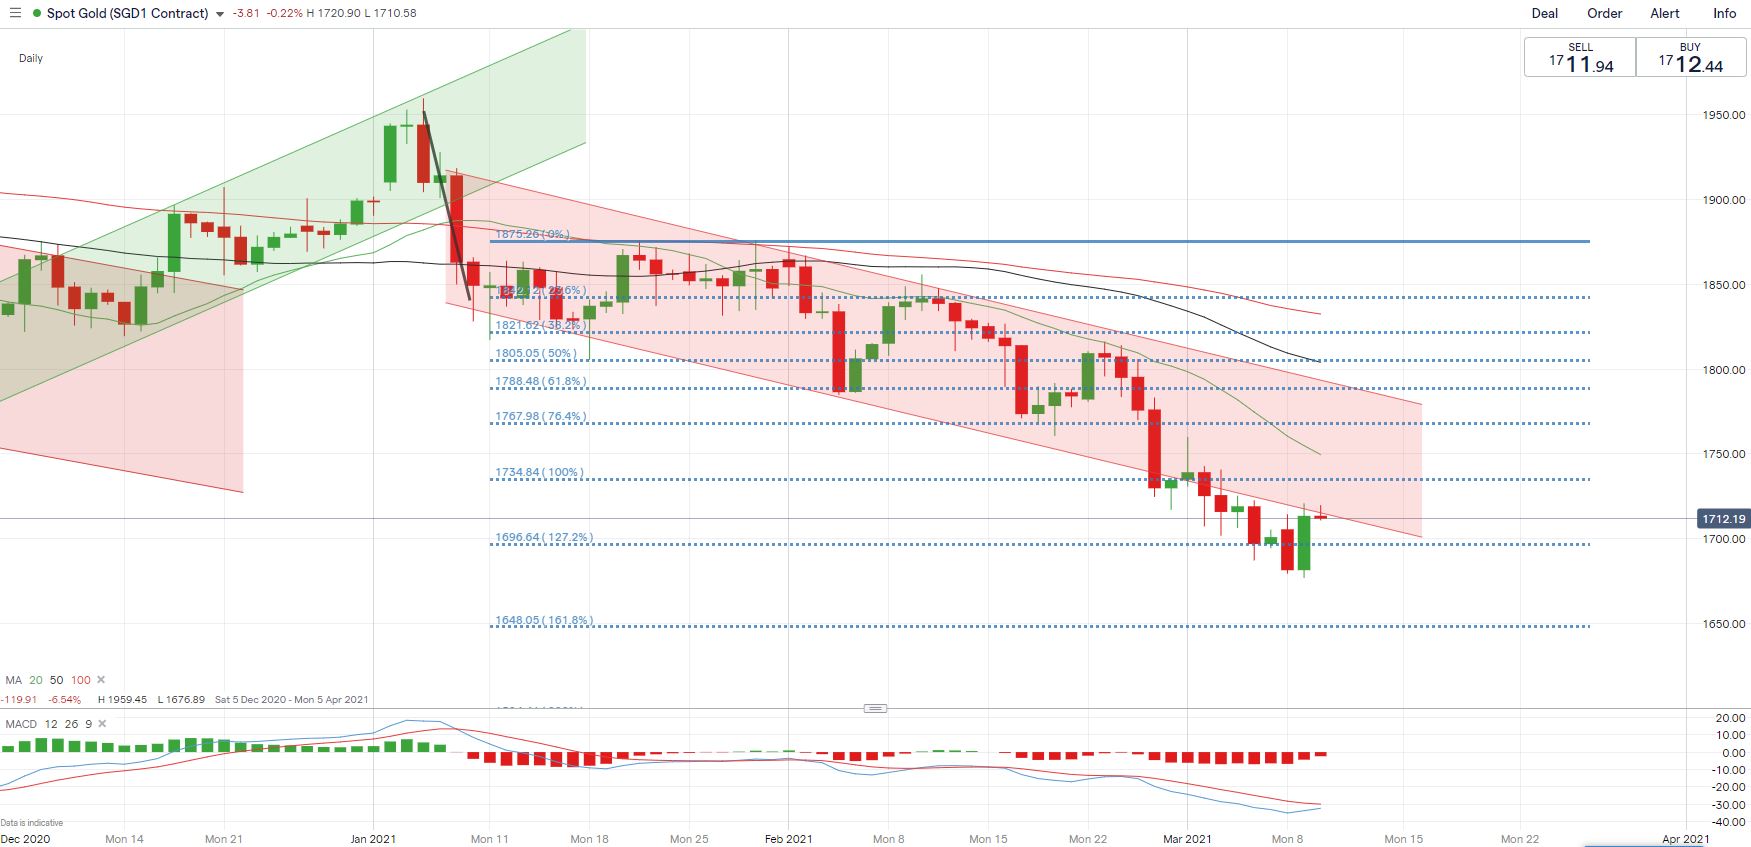
Technically, gold prices broke below the “Descending Channel” with strong downward momentum, with the floor of the “Descending Channel” becoming an immediate resistance level. The overall trend remains bearish-biased as suggested by downward-sloped moving averages. The MACD indicator is about to form a bullish crossover, suggesting that a near-term rebound is possible. A daily close above the floor of the “Descending Channel” may intensify near-term buying pressure and bring the 127.2% Fibonacci extension level (1,734) into the crosshairs.
Gold Price – Daily Chart
| Change in | Longs | Shorts | OI |
| Daily | -3% | 38% | 2% |
| Weekly | 5% | 5% | 5% |
IG Client Sentiment indicates that 84% of retail traders are net-long with the ratio of traders long to short at 5.25. The number of traders net-long is 4% lower than yesterday and 5% higher from last week, while the number of traders net-short is 38% higher than yesterday and 6% higher from last week.
We typically take a contrarian view to crowd sentiment, and the fact traders are heavily leaning to the long side suggests that gold prices may continue to fall.
However, traders are more net-short than yesterday and last week. Recent changes in sentiment warn that the price trend may soon reverse higher despite the fact traders remain net-long.
{{GUIDE|BUILDING_CONFIDENCE_IN_TRADING }}
— Written by Margaret Yang, Strategist for DailyFX.com
To contact Margaret, use the Comments section below or @margaretyjy on Twitter
Be the first to comment