

USD/CAD ANLAYSIS
- Will we see further central bank divergence come FOMC?
- Resilient CAD may be breaking down against USD.
- Falling wedge in focus next week.
Recommended by Warren Venketas
Forex for Beginners
USD/CAD FUNDAMENTAL OUTLOOK: BULLISH
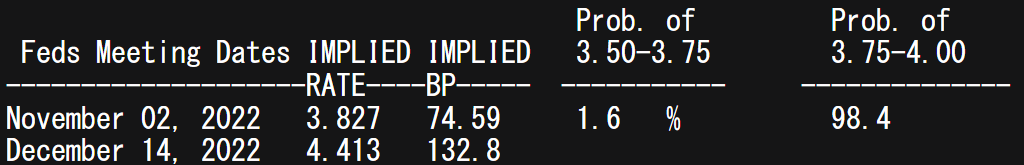
The Canadian dollar has been under pressure after last weeks Bank of Canada (BoC) interest rate decision fell short of expectations. This comes at a time when local demand in Canada still exceeds supply leading to higher inflationary pressures. This being said, global demand is slowing as recessionary fears escalate. Central banks are now being tested with local and global dynamics while the Federal Reserve shows little signs of slowing down their current aggressive monetary policy. Friday’s core PCE measure miss (the Fed’s preferred metric) sets up the forthcoming FOMC meeting to be rather interesting in terms of commentary post announcement. As it stands, markets are pricing in a 75bps rate hike with almost 100% conviction but guidance from the Fed during the press conference may turn more dovish than expected, possibly heightening the ‘Fed pivot’ narrative.
FEDERAL RESERVE INTEREST RATE PROBABILITIES
Source: Refinitiv
Overall, the loonie remains the strongest G10 currency against the greenback year-to-date (see graphic below) but could change as we await key economic data next week.
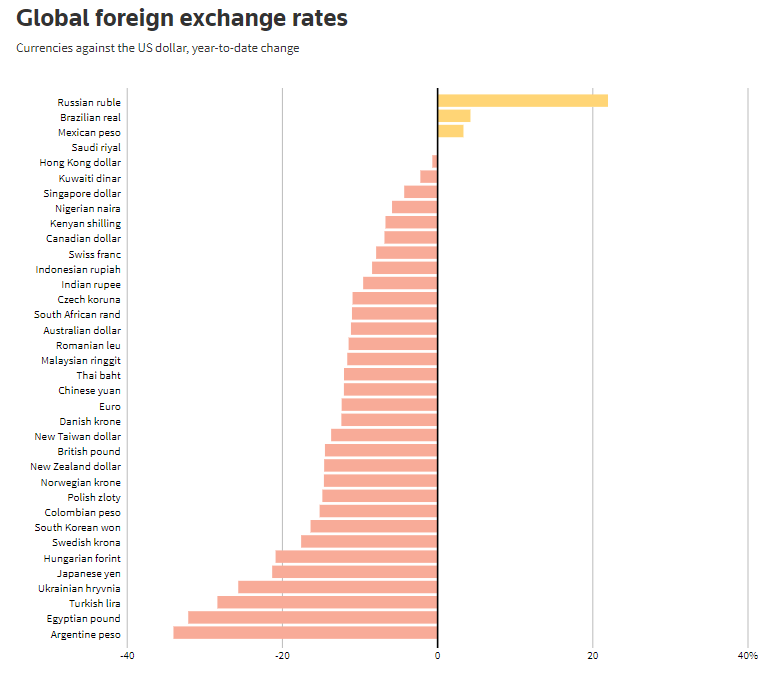
Source: Thompson Reuters
The economic calendar below looks to several key inputs with focus on the Fed interest rate decision and both Canadian and U.S. employment statistics.
USD/CAD ECONOMIC CALENDAR
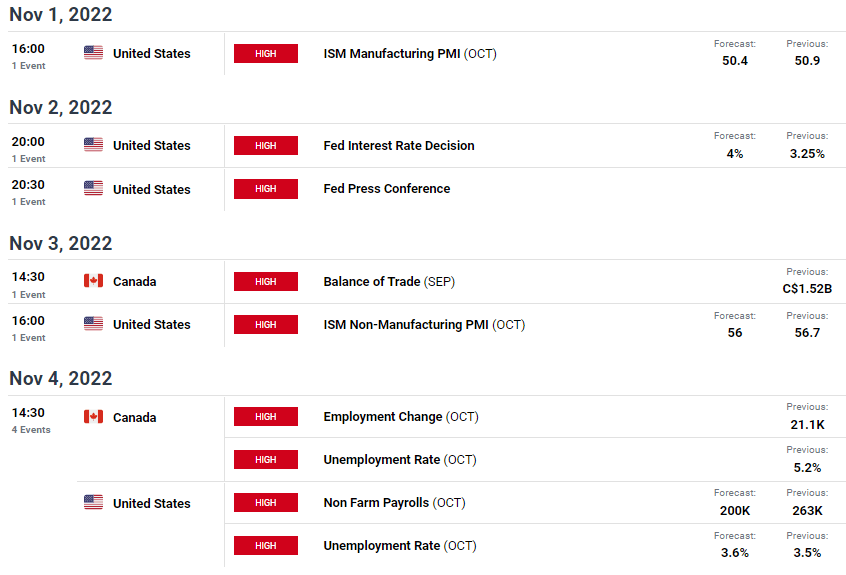
Source: DailyFX Economic Calendar
Crude oil prices are giving the loonie some support against the backdrop of a stronger USD. U.S. inventories last week showed signs of decline when removing the SPR release factor from the data and considering the OPEC+ view to curb output and forecasting increasing crude demand may help alleviate some of the dollar headwinds facing CAD bulls.
TECHNICAL ANALYSIS
USD/CAD DAILY CHART
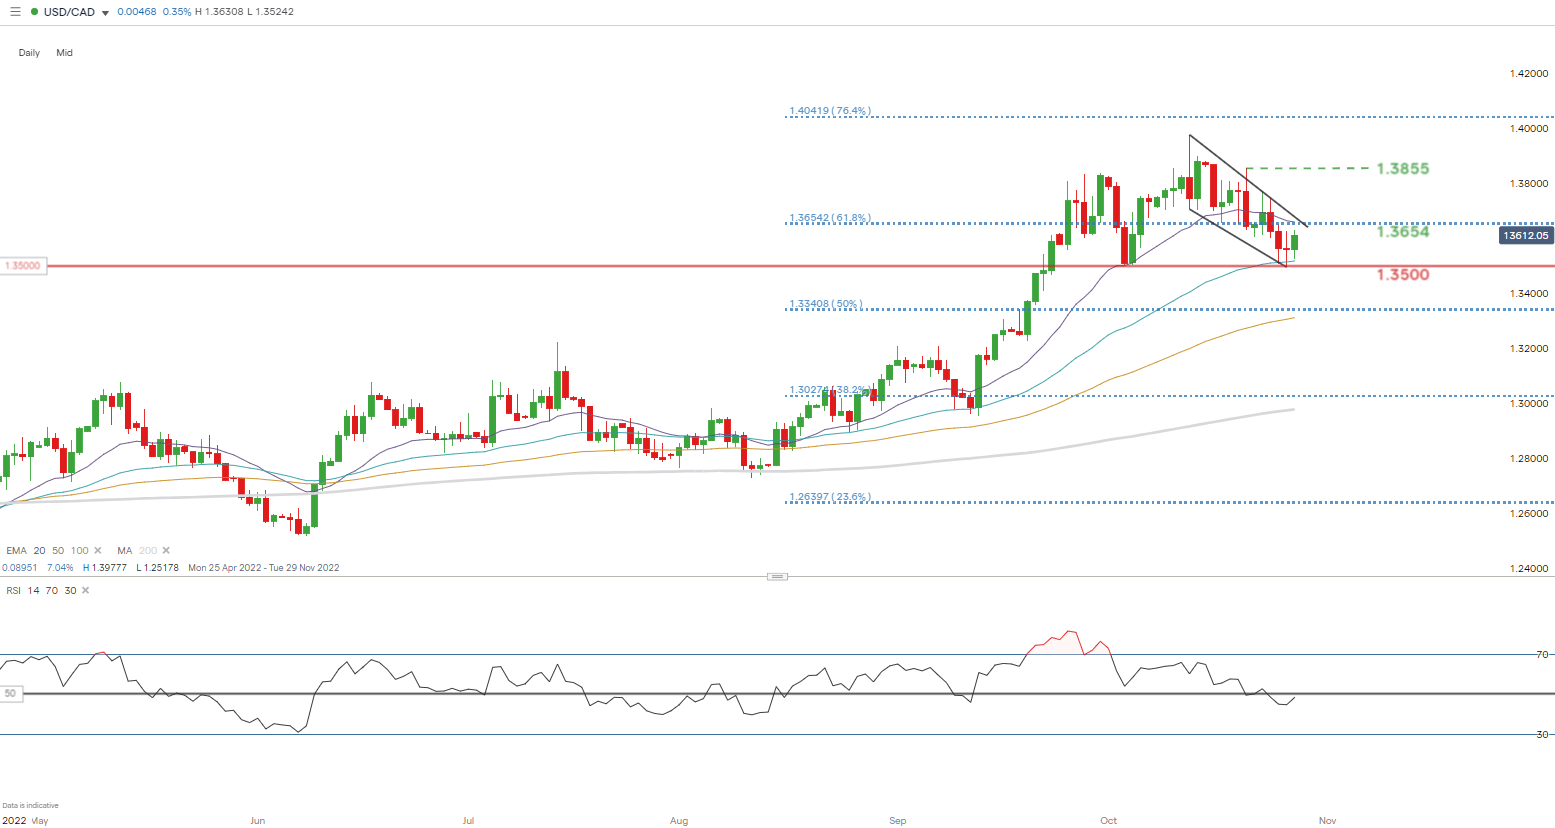
Chart prepared by Warren Venketas, IG
Price action on the daily USD/CAD chart looks to be developing into a falling wedge type chart pattern (black), which traditionally points to an upside breakout. With the BoC slowing down the pace of its rate hikes, should the Fed maintain an aggressive stance, the falling wedge may unfold as expected. From a bearish perspective, a push below 1.3500 will invalidate this short-term move and open up subsequent support zones.
Key resistance levels:
Key support levels:
Recommended by Warren Venketas
Improve your trading with IG Client Sentiment Data
IG CLIENT SENTIMENT DATA: MIXED
IGCS shows retail traders are currently LONG on USD/CAD with 58% of traders currently holding long positions (as of this writing). At DailyFX we typically take a contrarian view to crowd sentiment resulting in a short-term cautious bias.
Contact and follow Warren on Twitter: @WVenketas
Be the first to comment