

Upside Investing Is a Joint Investment/Spending Strategy to Ensure You Experience Only Upside Risk to Your Living Standard ThitareeSarmkasat
I’ve gambled at casinos twice. Each time I left my credit cards in the hotel room and took $100 in cash. This was the maximum I was prepared to lose doing what my economics training and common sense taught me was irrational – gambling at bad odds.
The stock market is a casino with great odds. Its annual real return averages 9.5 percent. But, there’s a 20 percentage-point standard deviation around that average. In mathematical terms, the stock market is a random walk with drift. The higher the drift (the higher the average return), the higher the chances your initial bucket of stocks will reach a big value after, say, 30 years. If you withdraw, say, 4 percent per year, you’ll lower the drift from 9.5 to 5.5 percent. This means less upside and more downside potential.
Withdrawing is said to generate sequence of return risk. But it’s simply reducing the drift of the market’s random walk, meaning that when stocks do well, you’ll have less money invested than would otherwise be the case.
Regardless of the drift, with a random walk there’s no telling how much a bucket of stocks will be worth when you need to cash out – leave the casino. If the U.S. market were, in real terms, to fall by half over the next 30 years, as the Japanese market did between 1990 and 2020, a $100K investment today, with no withdrawals, would cash out at just $51K in 2052, valued in today’s dollars.
Figures Lie and Liars Figure
You’re saying the U.S. stock market could have a negative return over 30 years? Are you nuts? The U.S. has never had a 30-year period with a negative return.
My answer: You’re right, but not really. The 63 observations of 30-year cumulative U.S. returns use overlapping annual data. Consequently, they don’t constitute independent observations!
Consider, by analogy randomly choosing an orange at Joe’s grocery story and putting it into a bag together with a previously chosen perfect orange. That’s orange bag one. Then you hold onto the perfect orange, return the other orange to the bin, mix up all the oranges, and grab another orange at random from the bin. Now you put the newly chosen orange in the bag with the same perfect orange. You repeat this, say, 63 times and then proclaim, “Every bag of two oranges I filled at Joe’s had at least one perfect orange.”
John Mitchell, Richard Nixon’s Attorney General, famously said, Figures lie and liars figure. Mitchell, by the way, was an expert on lying. He lied to Congress about Watergate and spent 19 months in jail for perjury.
The 98 years of U.S. annual stock return data provide just three independent estimates of the 30-year return on the U.S. market – just three bags of oranges where both oranges have been drawn randomly from the bin. (And, by the way, the 30-year annualized real return between 1928 and 1958 was just 0.5 percent.)
Unfortunately, when it comes to long-term stock returns, three data points tell us nothing. However, we do know something, indeed a lot about stock returns simply based on their underlying random walk process – on their mathematical formula. In particular, we know that the probability that a random walk with a lognormal distribution, which is the standard assumption about stock returns, falls below a given low level is more likely the more time you give the process. And once your bucket has lost all its value, it’s gone for good.
Yet, Wall Street talks about stocks as if they are safe long term. This helps sell product. But call Wall Street’s bluff and ask it to sell you insurance against the market underperforming safe assets (TIPS) as of date X. As Boston University finance professor emeritus, Zvi Bodie, shows, Wall Street will charge you more the further out is X.
Our Lives Are Outcomes, Not Averages
Consider these statements I collected in 20 seconds by Googling Bucket Strategy.
Morningstar: While the stock and bond markets can be risky in the short run, time has a moderating effect on market risk.
Smartasset.com: … the long-term bucket grow(s) your nest egg faster than inflation.
Fidelity: People get nervous when markets go down. So if you separate out cash mentally and know it can last you long enough for the tide to turn around, you feel better that you can ride it out.
This and similar implicit buy stocks “advice” comes with caveats. But the common, patently false message is that stocks are safe long term. Fidelity also suggests that depressed markets invariably rebound. This is called mean reversion, evidence for which is weak at best.
Mean reversion references a bigger chance of a higher than trend return this year if last year’s return was lower than trend. This means we need to control for trend (drift) in assessing mean reversion. If we simply consider, as many of us do, the value of the market through time, we see the market generally trending upward after a downturn. But that’s the market’s drift at play, not mean reversion.
Wall Street’s statements, whether referencing amounts or probabilities, mislead because they are about averages. But we can’t count on receiving the average return or dying at the average time or having average health or suffering the average house-fire damage or… As risk-averse humans, we care about our specific outcomes – precisely what happens to us. And we worry far more about the downside than the upside. The fact that the downside is so much worse than the upside is why a bucket of stocks gets riskier, not safer over time.
In sum, Wall Street’s Bucketing Strategy is a bad joke. Its focus on the market’s high average cumulative return or the high chance of doing well, on average, is akin to basing your financial plan on dying precisely at your life expectancy – at the date at which people like you will, on average, die. Worse, Wall Street takes you down another pretend-for-sure path. The pretense here is that, in bucketing you, it’s flooring your income and, by implication, your living standard. There are just two words: Caveat Emptor!
Upside Investing – Flooring Your Living Standard While Experiencing Only Upside Risk
Please return to the casino, not Caesars, but the stock market. Place some bets, line up some future bets, and then leave until some pre-set date. At that point, gradually start selling off your holdings. If you convert over, say, 15 years, take 1/15th out the first year, 1/14th out the next year, 1/13th out in year three, and so on.
Whenever you convert money from stocks, invest them in safe assets, e.g., TIPS. Clearly, how much you’ll be able to convert will depend on how well your stocks perform both before and as you are converting.
Now for the spending part of Upside Investing’s joint investment/spending strategy.
Set a base living standard assuming all money in the casino (stocks) and all money you intend to add to the casino (stocks) is entirely lost. When you run Upside Investing in MaxiFi Planner, the program determines this base living standard floor – the amount you can safely spend. And each year as you exit the casino – as you convert some of your remaining stocks to safe assets, you raise your living standard floor.
In sum, by not spending out of risky assets until they have been made safe, you can only experience upside living standard risk – positive, if uncertain increases to your sustainable discretionary spending per household member.
Illustrating Upside Investing Using MaxiFi Planner
Consider 50-year-old Joe who is single and lives in Georgia. Joe just netted $10 million by selling his startup and immediately retired. His big problem – how to manage his money. Joe has no Social Security, no pension, no retirement accounts – just $10 million sitting in his bank account.
Suppose Joe invests safely all $10 million in a ladder of TIPS earning 50 basis points. He can spend $171,878 per year, valued in today’s dollars, straight through age 100. This spending is after covering his taxes.
Next, let’s run Joe through Upside Investing assuming he puts $5 million in the market and withdrawals between ages 65 and 80. His base living standard takes a big hit. It drops from $171,878 per year to $91,672 per year. On the other hand, as the chart below shows, Joe’s upside is tremendous. Consider, for example, the blue curve. It’s the living standard trajectory that produces the 50th highest lifetime spending. By age 80, its value reaches $294,950 per year. That’s over three times higher than his base living standard.
Joe likes the Upside Strategy. Having worked so hard to make his money, Joe wants to sleep at night knowing his living standard won’t go puff if the market crashes. Upside Investing does this for him.
But Joe’s not sure the upside is worth the sacrifice – giving up almost half of his base living standard floor for the next 15 years in order to likely have a far higher living standard thereafter. And there is a small chance of no upside.
So, Joe considers putting only 20 percent in the market. Now Joe’s base floor is $140,608. This much smaller hit to his floor comes at a cost to his upside, as the second chart shows. The blue 50-percentile curve levels out at $222,572.
- Joe recognizes what most of us would recognize. Putting only 20 percent in the market guarantees him a much higher base living standard, while still providing him an excellent shot at a higher upside. Moreover, as Joe looks more closely at the charts, he sees that his 5th percentile curve is actually higher when he invests 20 percent, not 50 percent in the market. It’s $172,399 compared with $163,407. The reason is that Joe’s base living standard is higher, so all the trajectories have a head start in terms of their ultimate levels.
Controlling Your Living Standard Risk
Joe considers his options. As Joe says to himself: I risked plenty to get where I’m at. I’m tired of wondering what tomorrow will bring. I want to make sure I can always live well. On the other hand, I want to place a decent-sized bet on the market. A 20 percent investment seems like a great sweet spot.
Joe Invests $5 mil in Stocks Producing a Low Floor High Upside
MaxiFi.com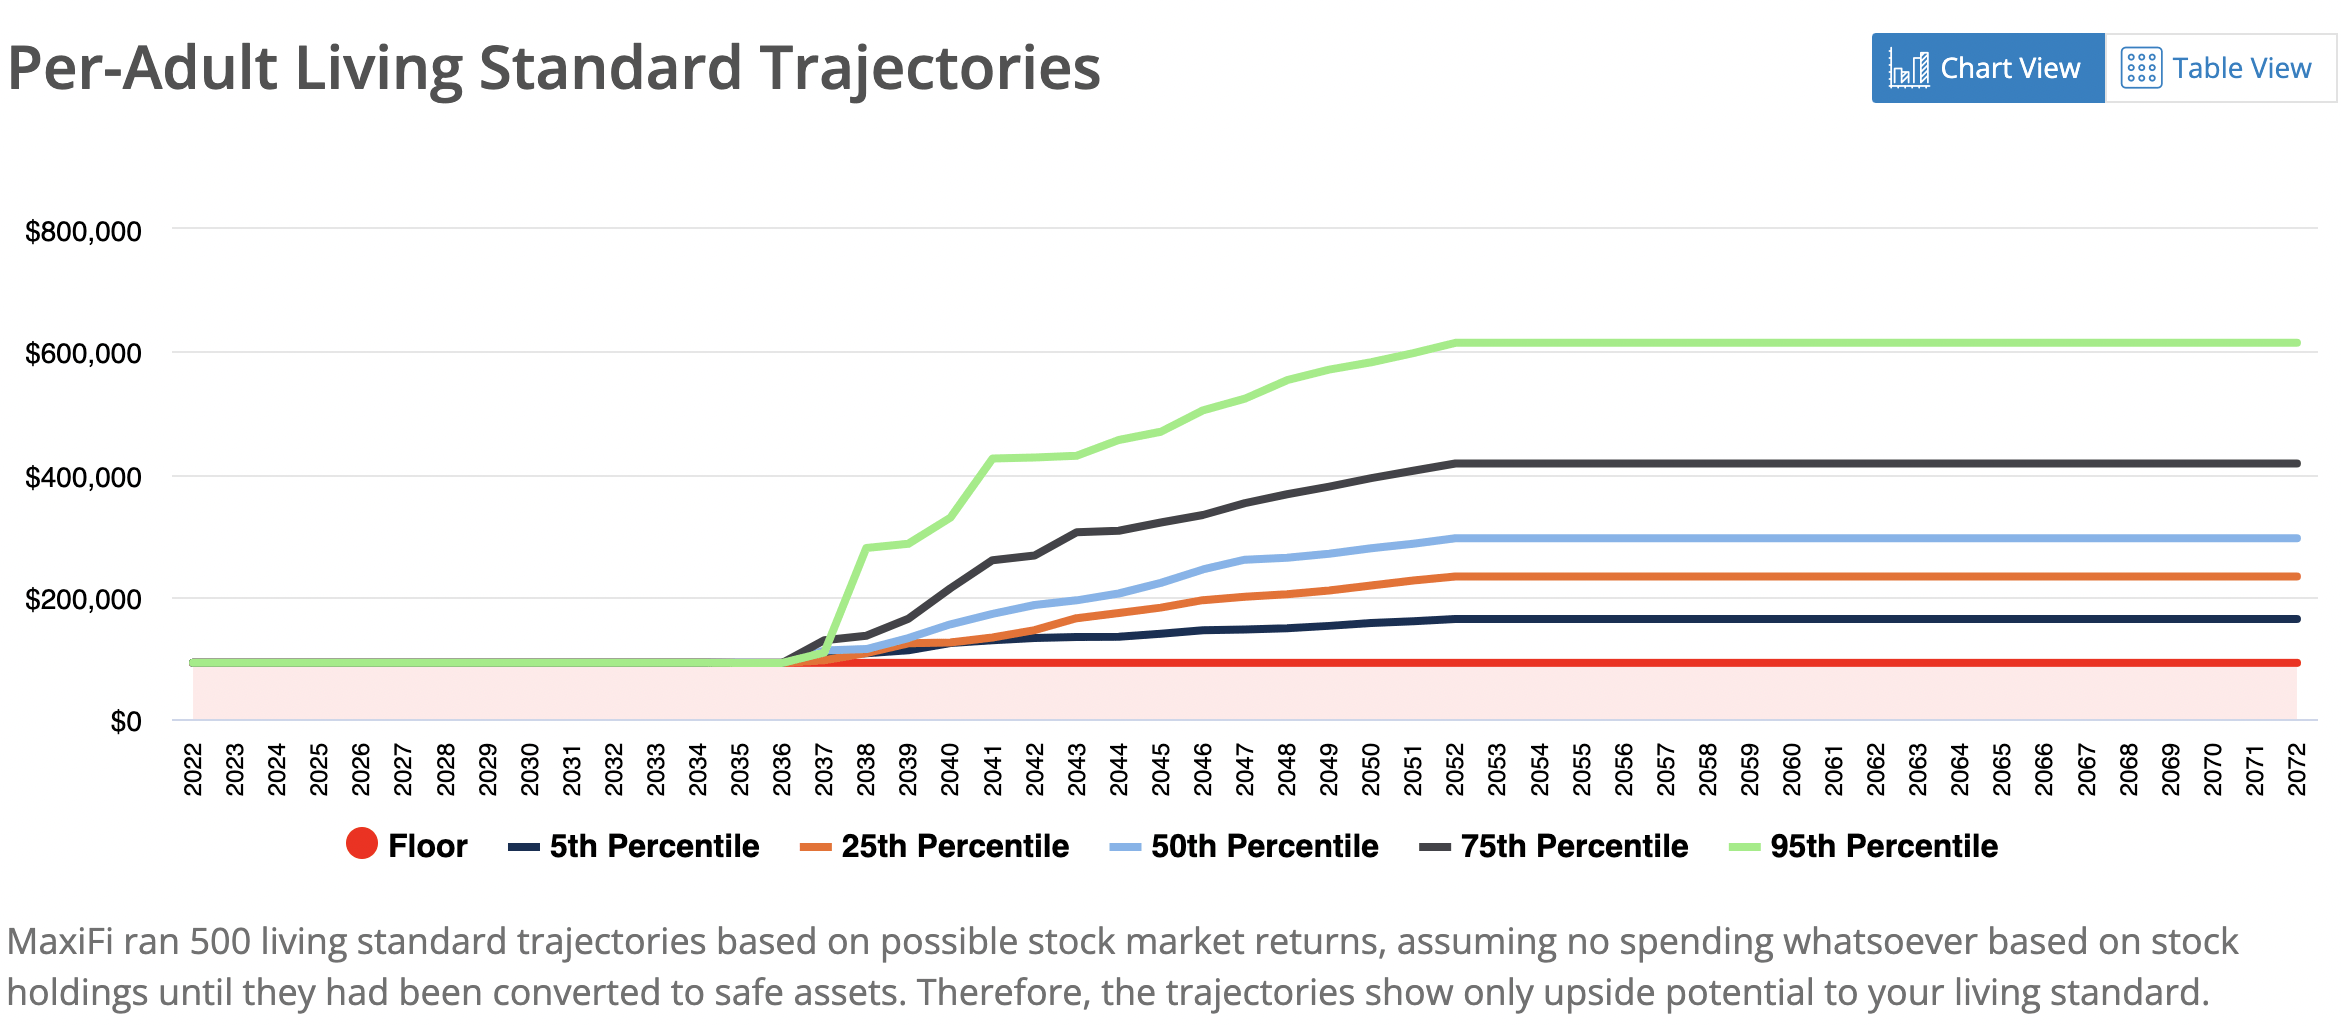
Joe Invests $2 mil in Stocks Producing a Higher Floor, But Less Upside
MaxiFi.com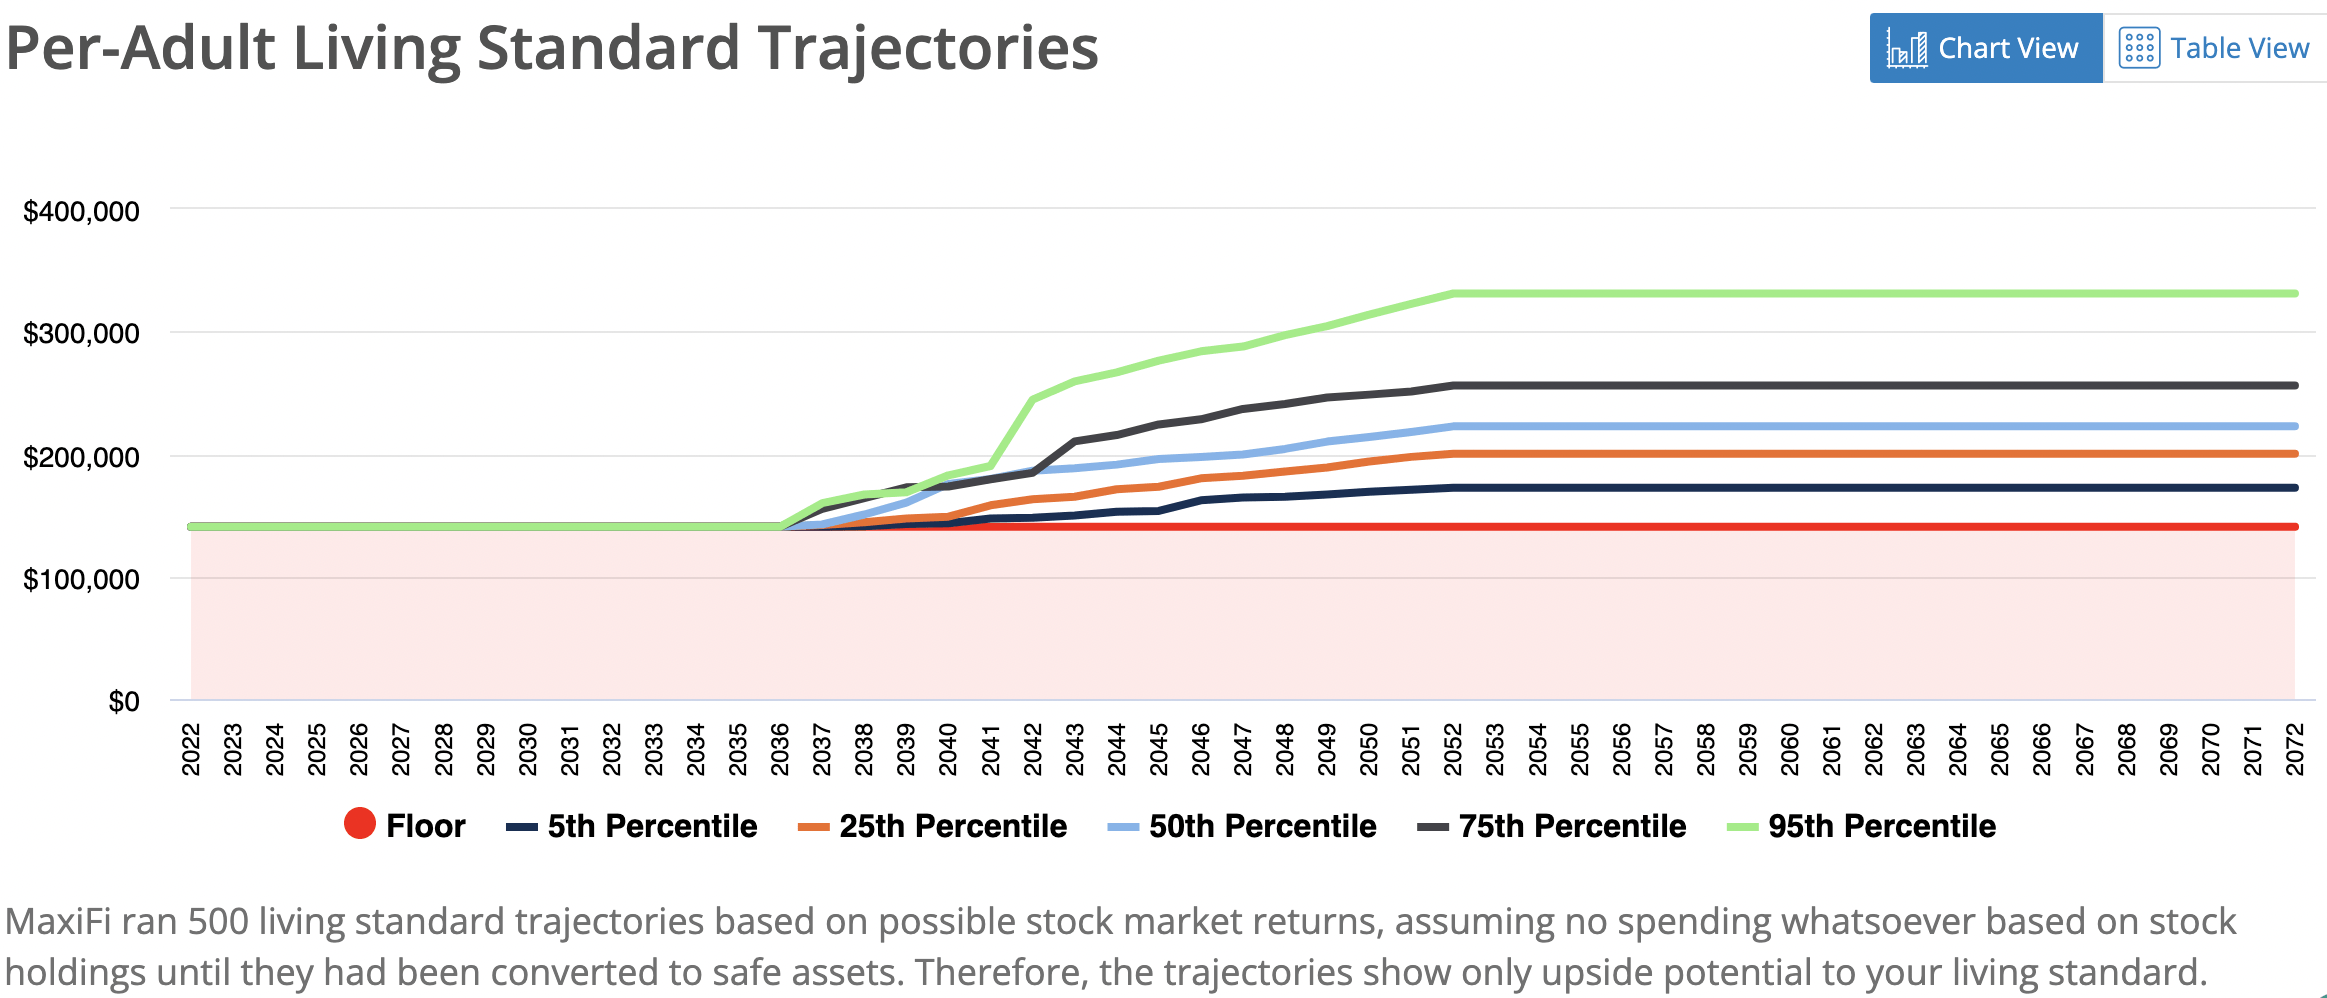
Be the first to comment