

pastorscott/E+ via Getty Images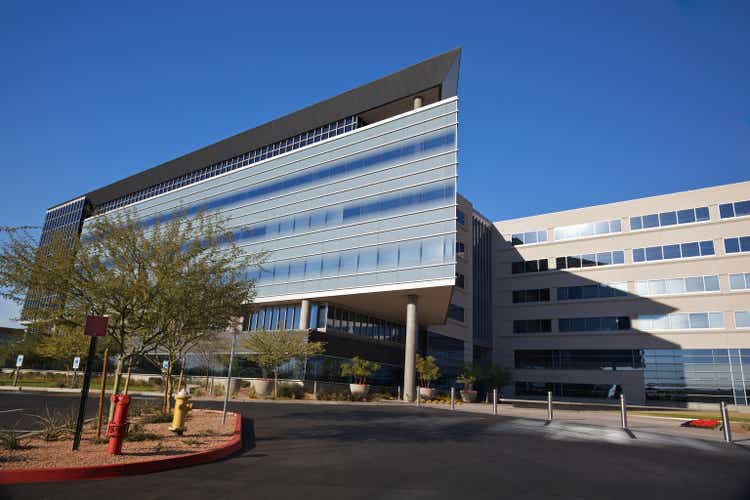
Thesis: Steady Long-Term Performer With a 5.4% Yield
Universal Health Realty Income Trust (NYSE:UHT) is a $730 million market cap healthcare REIT that primarily owns medical office buildings (“MOBs”). The REIT is externally managed by hospital operator Universal Health Services (UHS), which also happens to be UHT’s largest tenant at around 40% of revenue.
This year, hospital operators like UHS have suffered under the weight of surging labor costs (and labor shortages generally) while also not enjoying the wave of elective surgeries that had been widely expected to materialize coming out of the pandemic. UHT’s stock price has trended in roughly the same direction as that of UHS:
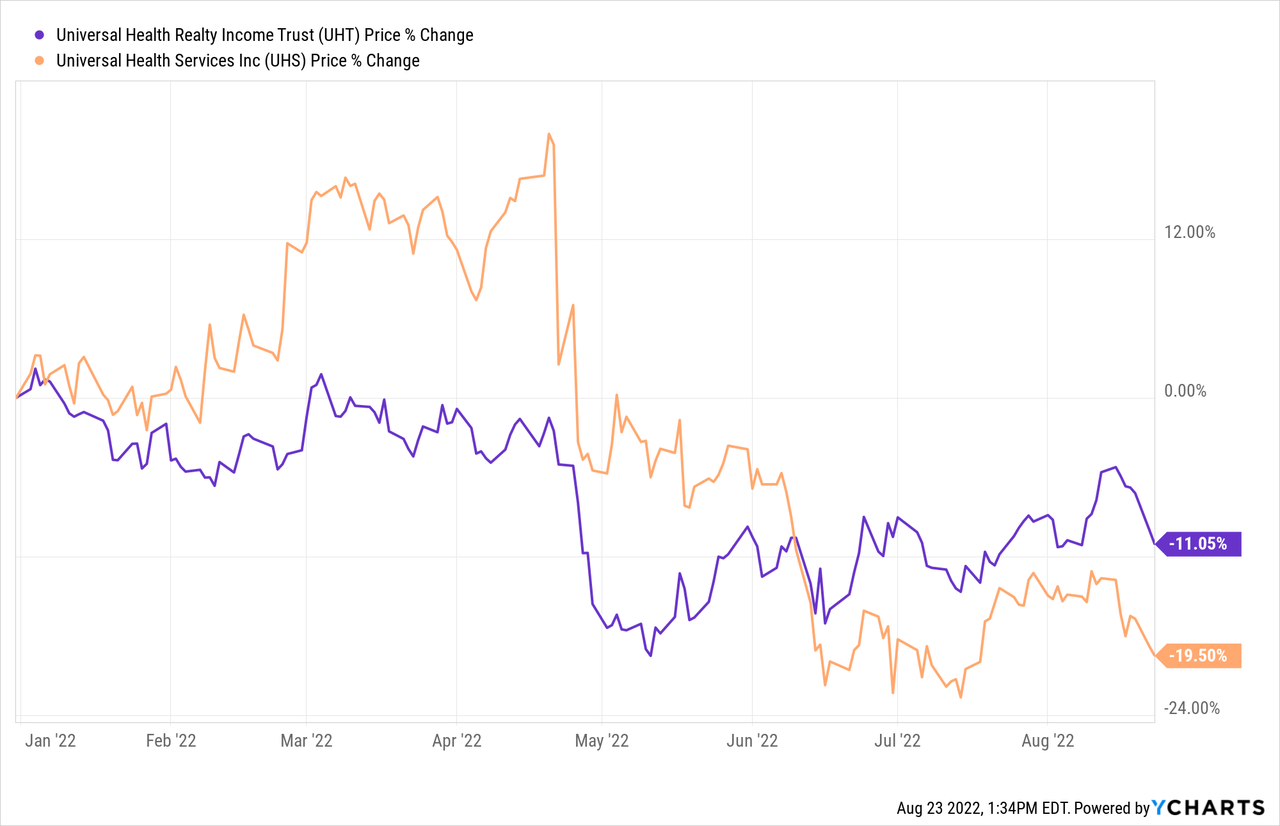
But UHT is a landlord, not a healthcare operator. UHT’s revenue has grown 6.7% year-to-date. Operating income is up 6.0% YTD. Funds from operations (“FFO”) per share, however, is actually down 3.3% YTD, from $1.84 last year to $1.78 this year.
In my last article on UHT in June, I focused on the REIT’s heavy use of floating rate debt via its credit facility and why that isn’t as big a weakness as one might think. Interest expense is up only 8.4% in Q2 and 6.3% YTD, and that is largely because of increased borrowings on the credit facility for the purpose of property acquisitions.
But in this article, after briefly reviewing the basics of UHT, I want to talk about why FFO per share has dropped this year and why UHT’s status as a solid long-term performer remains intact.
Universal Health Realty Overview
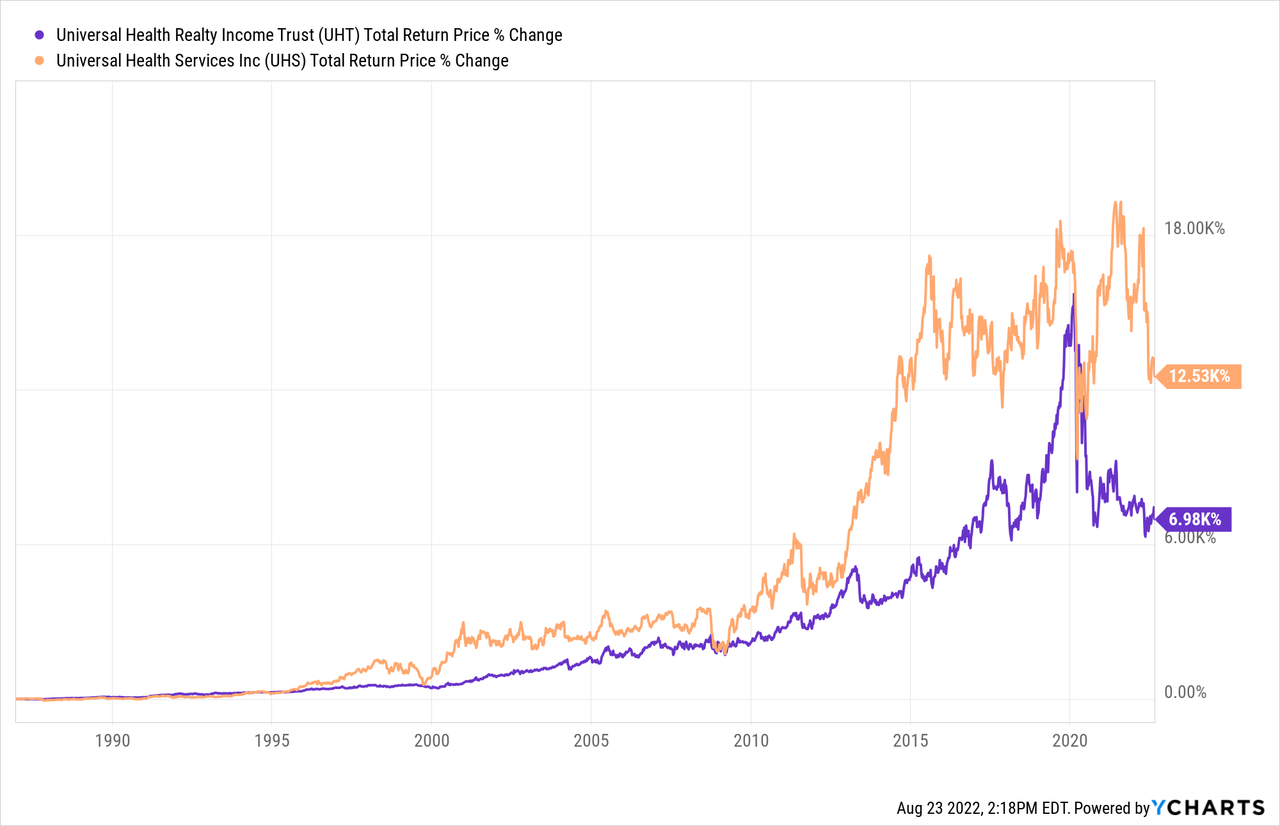
UHT began its life as a public REIT three and a half decades ago as a spinoff from UHS when the hospital operator decided to split its healthcare operations segment from its real estate. There does not appear to have been grand plans for the REIT other than as a financing vehicle for UHS, but the arrangement has worked out nicely for both companies.
Both UHT and UHS have performed well since the 1986 spinoff – the latter especially taking off after the Affordable Care Act was implemented in the early 2010s.
Since 1986, when 100% of UHT’s properties were leased to UHS, the REIT has diversified its tenant base such that, today, about 60% of its revenue derives from non-UHS tenants.
As for the property portfolio, about 2/3rds of asset value is in MOBs, with the remaining third split among hospitals, behavioral health facilities, and a few smaller categories.
Universal Health Realty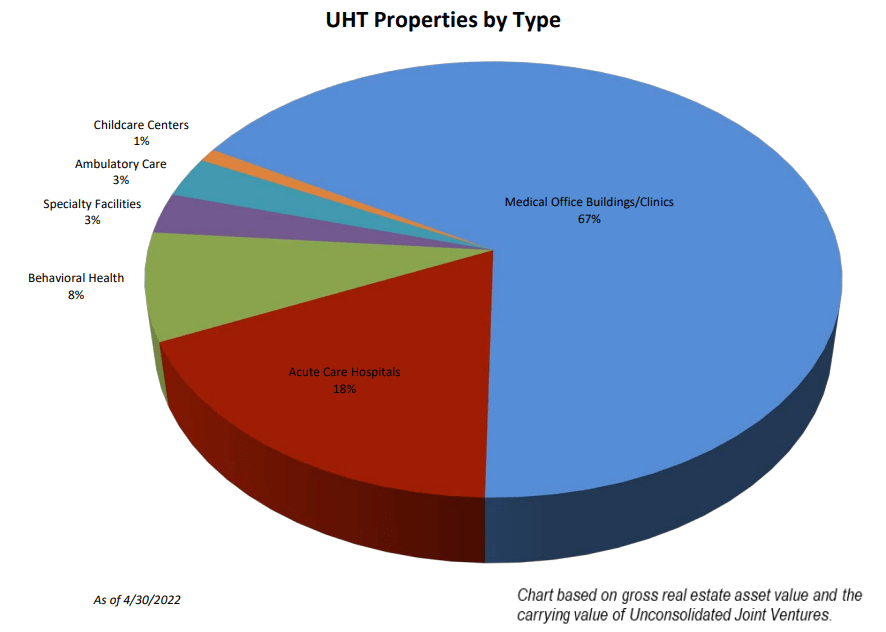
About 85% of the portfolio is in traditional healthcare facilities.
UHT’s properties are spread across the country with particular concentrated clusters in Dallas/Fort Worth, Houston, Las Vegas, Phoenix, and Atlanta.
Universal Health Realty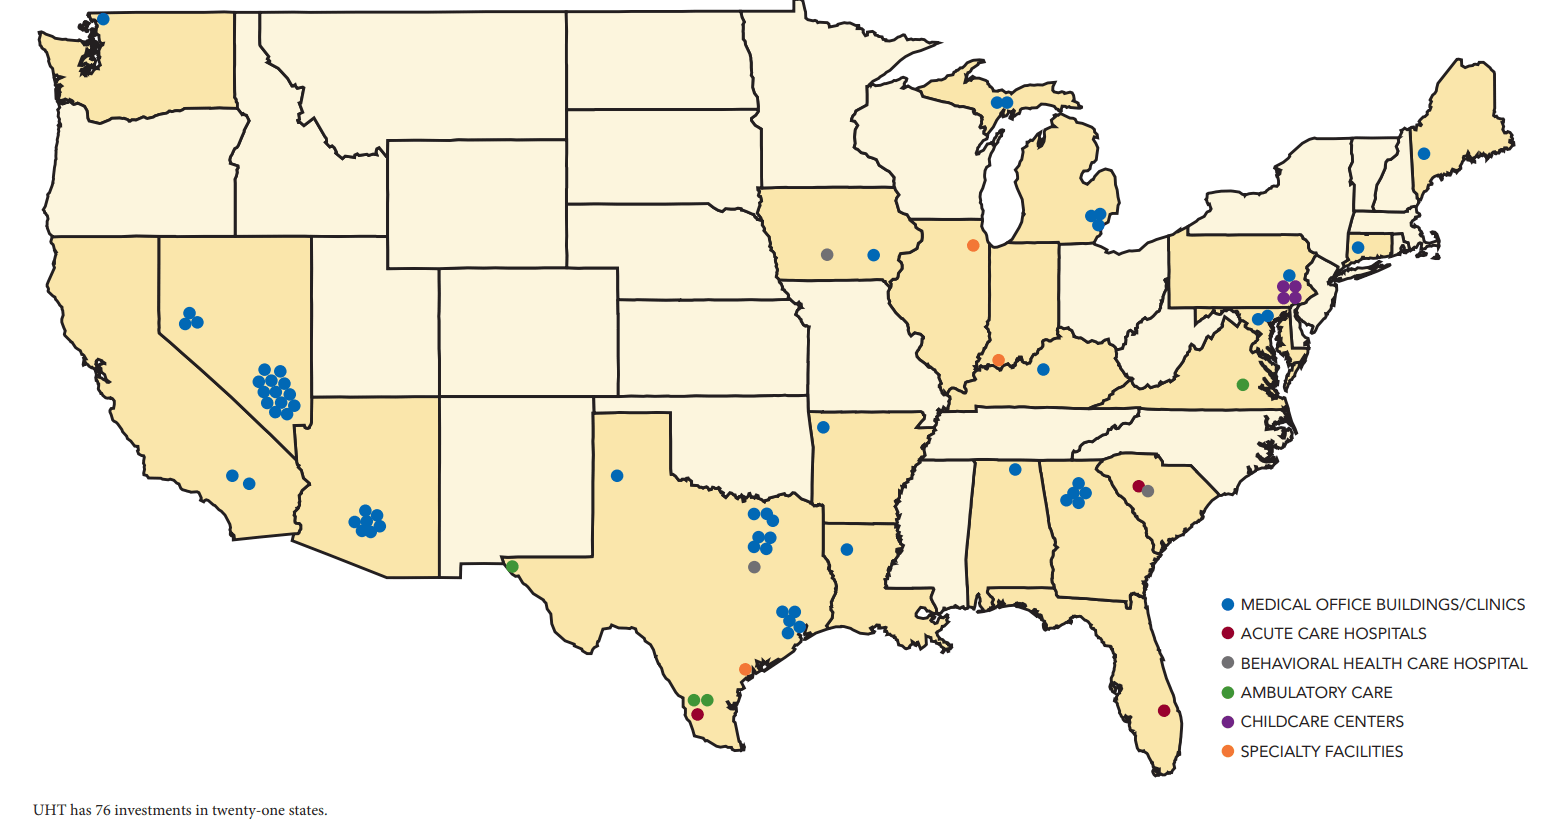
Though I am not sure if management intended to accomplish this with the portfolio, it does seem to be largely weighted toward the Sunbelt rather than the population centers on the West Coast and Northeast.
Here are some examples of properties in the portfolio:
Universal Health Realty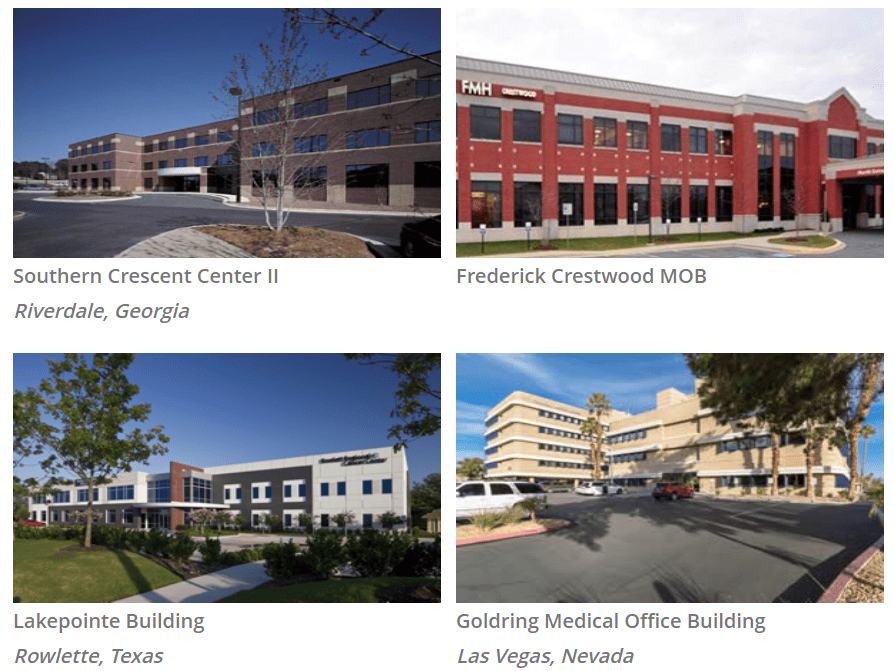
And here are some more:
Universal Health Realty
Let’s compare UHT’s valuation and dividend yield to its MOB REIT peers: Healthcare Realty Trust (HR), Physicians Realty Trust (DOC), and Global Medical REIT (GMRE).
| UHT | HR | DOC | GMRE | |
| Price to FFO | 14.7x | 14.7x | 16.3x | 11.9x |
| Dividend Yield | 5.4% | 4.8% | 5.3% | 7.3% |
Though GMRE is the cheapest, it is also the most heavily indebted and carries the most perceived risk. Among the other three, HR has some execution risk with its merger integration with the former Healthcare Trust of America (HTA), and DOC has a high payout ratio (high 80% range).
In comparison, UHT has a relatively low valuation and a slightly higher dividend yield, bolstered by a lower payout ratio of around 79% YTD.
Over the last five years, GMRE’s higher risk strategy has paid off, but in the face of rising interest rates this year, the REIT has sold off by ~35% YTD.
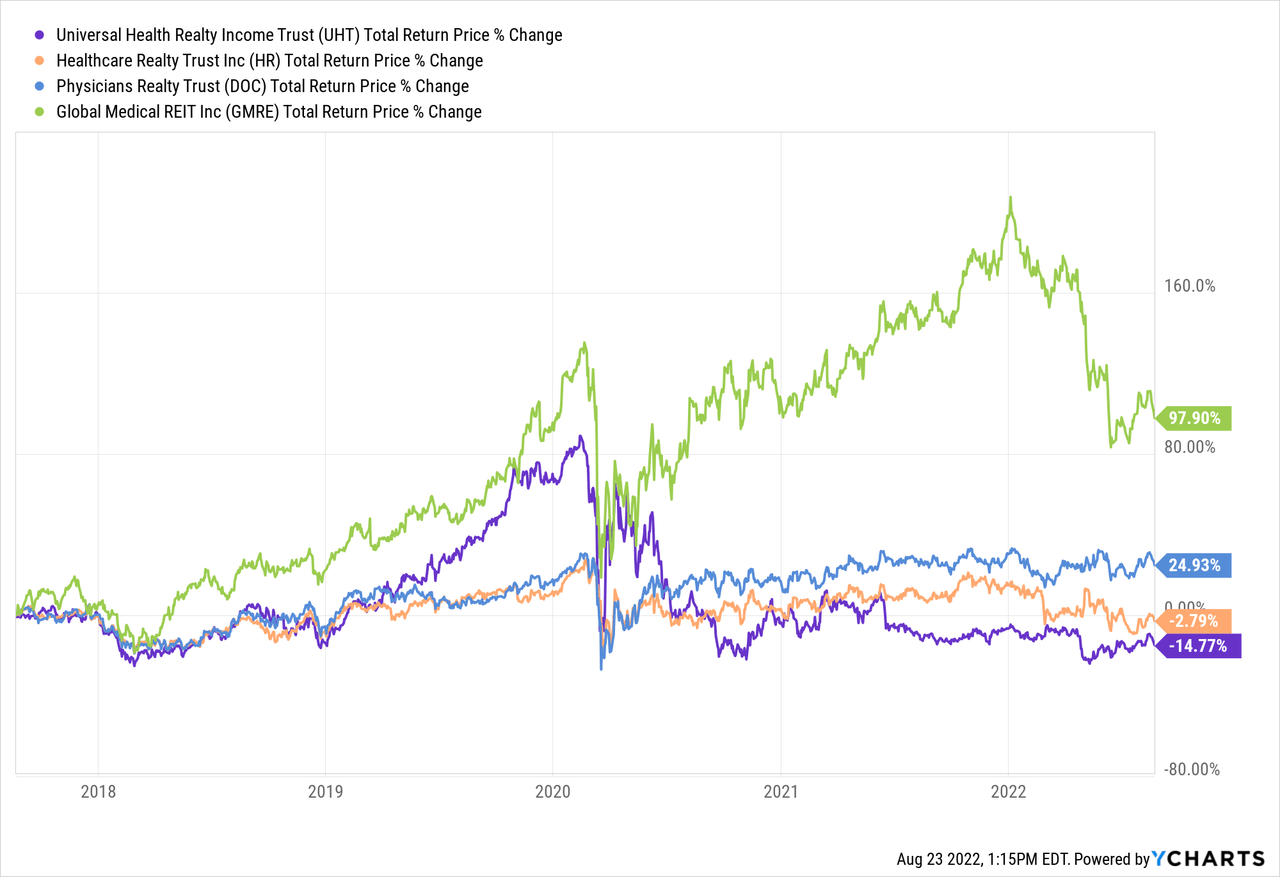
Meanwhile, as you can see below, UHT has underperformed both over the last five years and especially the last two years.
Does UHT deserve to underperform? I don’t think so.
Sure, UHT is slow-growing, but each of its closest peers is slow-growing. And yes, UHT is externally managed, but its external manager keeps fees low and has grown UHT’s dividend for over 30 consecutive years (albeit at a slow pace). And yes, UHT does heavily utilize its floating rate credit facility, but that only results in a minor headwind during rising rate environments.
Perhaps the most fundamental reason why UHT has underperformed has to do with property vacancies. UHT primarily owns single-tenant, net leased properties, which means that tenant vacancies can have an outsized effect on earnings. Moreover, UHT’s small size also makes it vulnerable to any of its larger properties going vacant.
That is exactly the reason for UHT’s FFO per share decline this year, as we will turn to now.
Year-To-Date Performance
As previously stated, despite growth in revenue and operating income, UHT’s FFO per share declined by 3.3% in the first half of the year.
The primary reason for this is that the tenant of a specialty hospital in Chicago chose not to renew their lease, which ended at the end of 2021. Last year, UHT generated $1.6 million in rental revenue from this property. This vacancy alone caused a $0.05 drop in FFO per share YoY.
As such, if not for the new vacancy, UHT’s Q2 2022 FFO per share would have been $0.93, a one penny increase from Q2 2021’s $0.92. Offsetting this ding from the Chicago hospital vacancy were a few points in UHT’s favor:
- A rent increase at Wellington Regional Medical Center, raising FFO per share by $0.02.
- An acquisition of another UHS-leased property, adding another $0.02 to FFO per share.
- Rent increases at various other properties in UHT’s portfolio, collectively amounting to an additional $0.01 of FFO per share.
Management is of course marketing the vacant property for re-leasing, but would also likely be willing to sell it for the right price.
The bigger problem is that this is not the first sizable property in UHT’s portfolio to become vacant. Nor is UHT’s record of re-leasing or selling vacant properties that good in recent years. The REIT has two other specialty healthcare facilities that have been vacant since 2019. Management has been trying unsuccessfully to replace the lost tenants, and the ongoing vacancies have been a drag on FFO growth.
Whether this Chicago hospital will just become a third long-term vacancy that management can’t seem to re-tenant is an open question.
The good news, however, is that the portfolio continues to grow, and rents are going up over time as leases are renewed. These beneficial factors will offset the (hopefully temporary) headwinds from the drag of vacant properties, rising interest rates, and weak hospital operational fundamentals.
Bottom Line
UHT’s management has exhibited a long-term, patient, slow-and-steady approach over the decades, without which the REIT would not have been able to raise its dividend every year for 36 years.
As just stated above, the three headwinds UHT faces right now are:
- Three property vacancies creating expenses with no revenue
- Rising interest rates, pushing up expenses from its floating rate debt
- Stock price weakness from close association with a hospital operator
How worried should investors be? I would argue: Not very. UHT is not overleveraged at a net debt to EBITDA of about 5.8x (my estimate). And the payout ratio remains in sustainable territory at 79% YTD.
UHT is the opposite of a sexy investment, and resolving any of these headwinds won’t suddenly transform it into a growth monster. But I believe the downside is mostly priced in to the stock already, giving investors the opportunity to add shares yielding 5.4%. The dividend should continue to creep up in the low single-digits over time.
Admittedly, UHT’s return profile will elicit yawns even from many conservative dividend growth investors. But if you know what you are getting into and set your expectations accordingly, UHT’s slow-and-steady growth can be a nice addition to a diversified dividend growth portfolio that allows one the mental freedom to pursue higher risk/higher reward/faster growth investments elsewhere.
Be the first to comment