

Tryaging
Better and Bolder represents a well-defined corporate strategy on which many managements strongly rely. Better is about putting the customer experience first and constantly improving efficiency. Bolder means creating greater value for the customer and United Parcel Service, Inc. (NYSE:UPS) through sustainable growth and the use of cutting-edge digital solutions.
By analyzing the fundamentals in terms of revenue and profit factor, we can state that with an annual growth of 8.9% (Revenue) in the last 5 years and with a stable EBIT Margin of 13.7% (TTM), the corporate strategy, at moment, is bringing excellent results, especially when compared with the main competitors. ROCE (Return on Capital Employed) also depicts a growing trend aided by the efficient use of capital.
My concern is related to my so-called hidden debts. The company is constantly increasing the expense of the lease, and this could represent a risk if a certain limit is exceeded.
The market has recognized the results achieved by the company and at the moment the share price is, in my opinion, overvalued. Should it drop below $150, this could represent an interest price to open a long position. My rate for United Parcel Service, Inc. is, by now, hold.
Quick Overview
United Parcel Service, Inc. is a worldwide logistics company with more than 100 years of activity (founded in 1907). It is also the world’s top player in package delivery and a leader in global supply chain solutions.
UPS offers transportation, distribution, warehouse logistics, sea, and air freight solutions.
UPS operates in North and Latin America, Europe, the Middle East, Africa, and Asia Pacific.
The company divides two reporting sectors: U.S. Domestic Package and International Package.
Ease and speed can represent the two keywords in the company philosophy and strategy that puts customer service first.
Financial & Highlights
Revenue and Profitability
UPS 10-K Forms + Author Graph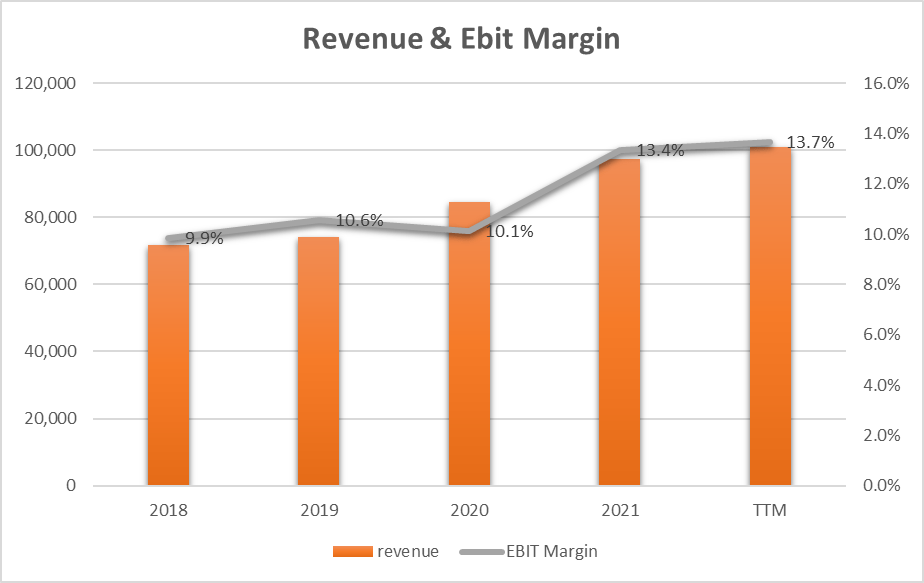
The graph represents an increasing linear trend both in terms of revenue and in terms of EBIT Margin. In particular, revenue has recorded an annual growth (CAGR) since 2018 equal to 8.9% while EBIT has managed to reach double digits: it has gone from 9.9% to a surprising 13.7% in continuous growth. In particular, the EBIT growth is concentrated entirely on the upper part of the income statement or on the Gross Profit, which managed to increase by more than 4 points going from 20.5% to 24.7%. We can hypothesize a great job done by the company in terms of price/product mix and at the same time an efficiency improvement on direct costs.
An example of how they have succeeded and are managing to improve efficiency is explained to us in the latest earnings call:
“Our biggest productivity initiative is total service plan, which is performing as planned. Since the launch on July 11, we’ve improved our driver dispatch timeliness by 13%.”
And
“a big turning point for our company is when we invested in fastest ground ever, improving our time in transit. And yes, we are advantaged or at parity in 17 of the top 25 markets. We offer 7-day residential service, Saturday pickup for our business customers. So this has made a significant difference in our business.”
UPS 10-K Forms + Author Calculation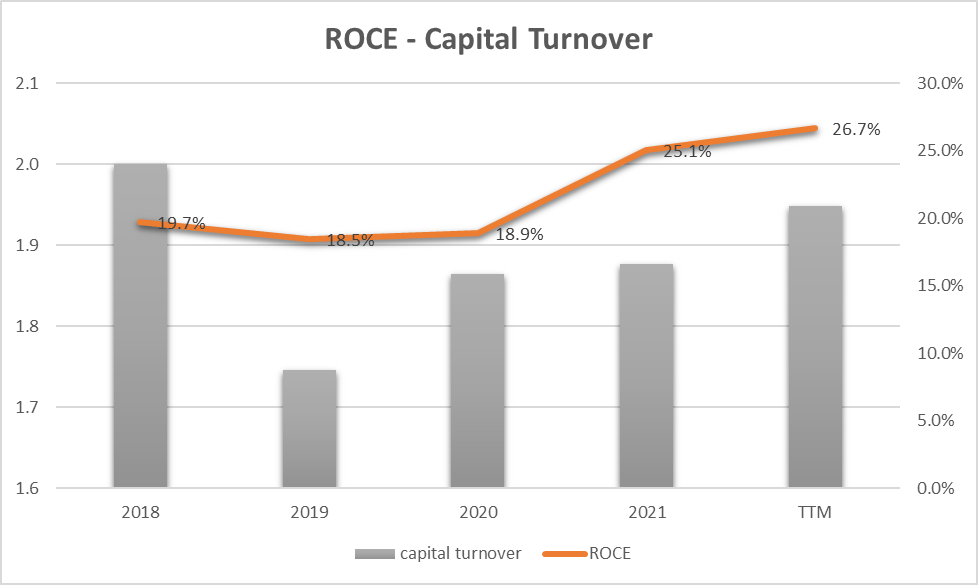
Another excellent example of good profitability is given by the analysis of the Return on Capital Employed. We have seen how the trend of the EBIT Margin is growing strongly and, closely, is followed by the ROCE with a multiplication factor also dictated by the Capital Turnover. With a small decrease in 2019 due to an increase in the net value of plants and equipment, capital turnover began to grow following the trend in revenue, up to generating (TTM) $2 in sales for every dollar of capital employed in the company.
ROCE grew faster than EBIT thanks to the combined factor of growth also in Capital Turnover. The latest figure (TTM) of 26.7% represents a peak of excellence.
Free Cash Flow, EPS, and Dividend
Seeking Alpha + Author Graph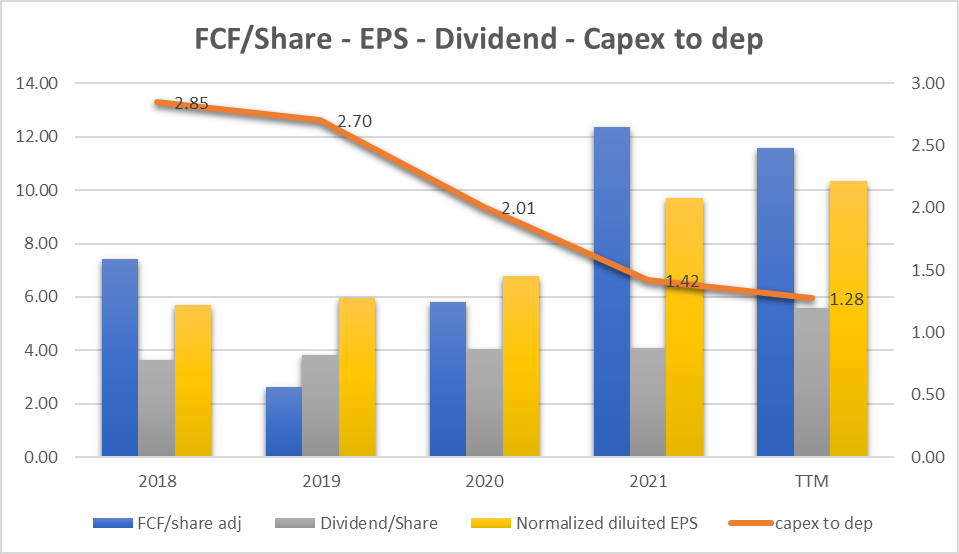
The graph shows (yellow bars) the EPS growth: from 2018, we can see a constant growth at an annual rate of 16.2% (passing from $5.68 to $10.34 per share). The EPS growth in the last 5 years was 16.2%. It is higher than that recorded in the last 10 years (9.1%). This means an acceleration that follows the reasons identified on the EBIT trend (see the previous paragraph).
The blue bar shows the Free Cash Flow (“FCF”) per Share. The trend is less constant but still growing (the Cash Flow from Operations grows at an annual rate of 6.9% lower than the EPS). The trend indicates also the company’s ability to transform profits into Cash Flow constantly. The Free Cash Flow also represents a strong point as it allows extraordinary operations such as the acquisition of strategic companies such as Bomi Group as UPS management underlines in the last earnings call:
“Another example of better and bolder is our pending acquisition of Bomi Group, whose network of healthcare facilities in Europe and Latin America and expertise in cold chain will help accelerate growth in complex healthcare. Along with our recent expansion of UPS Premier in Europe, we are on track to generate at least $10 billion in healthcare revenue in 2023.”
We can, therefore, also identify the next target in terms of Revenue in a very strategic sector (Healthcare) or $10B.
The gray bars show the dividends per share trend. As can be seen, the bars follow the EPS trend and are lower than the FCF bars. The trend indicates dividend sustainability and adequate growth in the long term (which however was 11.3% yearly in the last 5 years).
It is therefore possible to certify a constant and sustained growth of profits, cash flow, and also dividends (3.48% dividend yield at the moment). The question that arises is whether the company is investing enough to sustain these growth rates.
To answer the question, the ratio given by spending in terms of CAPEX vs the value of depreciation/amortization comes in handy. The orange line in the graph shows the trend of the ratio. In 2018 and 2019, UPS invested heavily ($6.3B yearly) in asset maintenance. This spending has reduced significantly in 2022 ($3.9B) and has come very close to the value of depreciation ($3B). As a result, the ratio went from 2.85 to 1.28, and this represents a virtuous trend. The company probably spent a lot 5 years ago, but today these investments are bringing results.
Valuation
Earnings Power Value Model
To be conservative and assume that the cash profit remains constant over the long term, I use the EPV (earnings power value) method to calculate the share price.
The method starts with EBIT. The second step is to add depreciation and amortization and then subtract stay-in-business CAPEX.
The result is the Cash Trading Profit.
I then subtract the taxes by calculating the amount using the actual tax rate that the company pays.
The result is the After-Tax Cash Trading Profit.
At least to calculate the total company enterprise value I divide the After-Tax Cash Profit by the interest Rate I define as fine for this kind of Company (UPS is a large and less risky company so I decided to use 8%).
The result is the Total Company Earnings Power Value. Dividing the result by the total number of shares we find the value per single share.
The table below shows the calculation for UPS:
| EBIT | $ 13,828.00 |
| Dep & amort | $ 3,054.00 |
| CAPEX | $ -3,902.00 |
| Cash Trading Profit | $ 12,980.00 |
| Effective TAX Rate | 21.9% |
| TAX | $ -2,842.62 |
| After TAX cash profit | $ 10,137.38 |
| Interest Rate | 8.0% |
| EPV | $ 126,717.25 |
| Share in issue | 865.0 |
| EPV per share | $ 146.5 |
$146.5 represents the share price valuation using the EPV method. If we compare the data with the current market price ($179.5) we see that the current price already incorporates future earnings growth and is overstated by 22.5% (=(179.5-146.5)/146.5).
FCF/Share Model
To define a maximum buying price, I use also a formula based on FCF/Share and interest rate.
The formula is:
Maximum buying price = Cash profit per Share/interest rate – 20% (safety discount).
If TTM Cash Profit per share is $11.58.
Interest Rate=inflation Rate = 7.75%.
Maximum price before Safety discount = 11.58/7.75%= $154.4.
The maximum price at 20% discount = $128.7.
Under the FCF/Share analysis, it seems that the actual price of $179.5 is overrated.
Both methods (converging on a value below $150) indicate that the current share price already contains future earnings growth. In my opinion, if the market offers the opportunity to buy at a price below $150, it might be appropriate to enter a long position.
Peers
To compare UPS with similar companies in terms of market capitalization in the Air Freight and Logistics sector, I have defined the following peers:
• Deutsche Post AG (OTCPK:DPSGY)
• FedEx Corporation (FDX)
• DSV A/S (OTCPK:DSDVY)
Seeking Alpha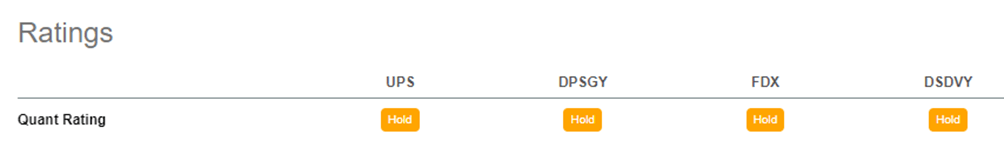
Using Seeking Alpha’s Quant Ratings, we have a parity verdict between the various companies that have a “hold” rating.
Going deeper into the parameters characterizing UPS, we can take a look at the Profitability Factors.
Seeking Alpha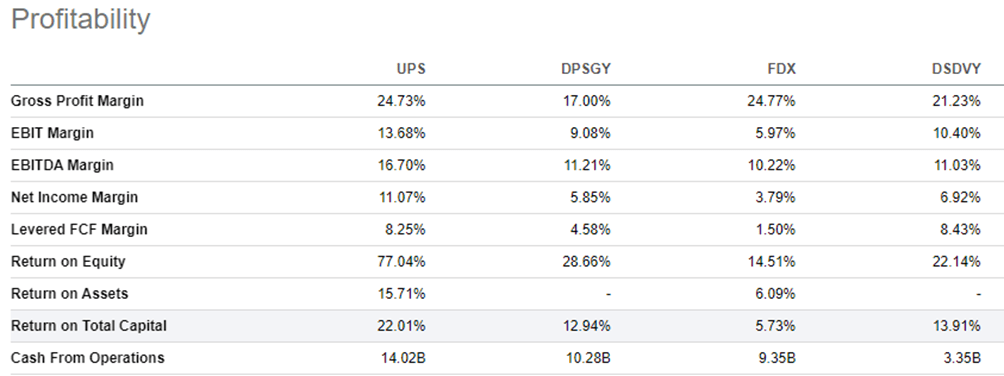
The table shows the main profitability parameters in comparison between the various companies. I underline how the UPS Gross Margin (24.73%) represents (on a par with FedEx) the best result. In terms of EBIT Margin, UPS’s 13.68% is by far the best metric even compared to DSV (10.4%) which ranks second. Finally, the Cash From Operation with $14B also underlines the strength of the company compared to its competitors.
In conclusion, if we look at the company from the profitability point of view, it appears to be by far the best.
Hidden Debts as Potential Risk
UPS 10-K Form + Author Calculation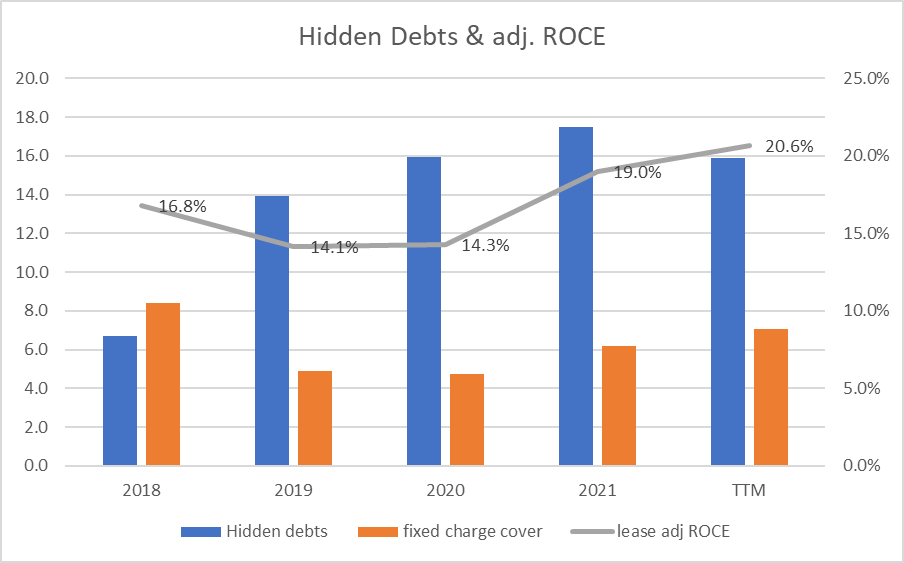
UPS makes extensive use of leases and rentals for equipment (plant, aircraft, trucks…) and this represents a hidden debt not reflected in the balance sheet items. To weigh these costs correctly, I calculated a capitalization of the leases with a multiplication factor equal to 7 for the annual rental cost. The blue bars in the graph represent the trend of this hidden debt item.
As we can see, the trend is growing and could represent a risk factor if the fixed charge to cover drops too much. The parameter indicates how many times profits can pay the interest payments on lease and rental expenses.
The formula is:
fixed charge cover = (EBIT + operating lease expense)/(net interest + operating lease expenses).
The higher is better and if it falls to 5 it could represent a risk.
The orange bars show the evolution of the fixed charge cover. In 2020 the parameter dropped to a value of 4.73 and today stands at 7.04. If it will drop under 5 in the future it will represent a red flag.
Finally, the graph represents the ROCE recalculated on the Capital Employed adjusted with the leased capital. The trend is growing and the last value of 20.6% represents a very positive figure.
Bottom Line
In terms of revenue growth and profitability, UPS represents, from my point of view, the best solution for investing in the Air Freight and Logistics market. The fundamental metrics identify a solid and rapidly growing company. The Cash Flow deriving from Operations should not be forgotten, which can amply cover the dividend and also the possibility of capital employed in strategic acquisitions. The United Parcel Service, Inc. share price valuation appears a bit high, and therefore, in my opinion, it is better to wait for a possible correction of the price (below $150) to open a long position. My rate for United Parcel Service, Inc. is Hold.
Be the first to comment