

kojihirano
Introduction
As a long-term dividend growth investor, owning companies with reliable cash flows is paramount. Therefore, well-established railroad companies such as Union Pacific Corp. (NYSE:UNP) and Norfolk Southern Corp. (NYSE:NSC) prove to be ideal candidates for further investigation.
These U.S. Class I railroads have a wide moat due to their distinctive networks, which present insurmountable barriers to entry. They benefit from cost advantages over airlines and trucks, primarily due to better fuel/freight economics, but of course that only applies to freight with a high volume-to-value ratio. A review of their operating networks and the increasing importance of intermodal freight makes it hard to imagine that both UNP and NSC will face increasing competition in the coming years and probably decades.
In this article, I will present my due diligence on the two companies, focusing on their operations over the past decade. I will highlight key differences and similarities, discuss operational performance, strength of balance sheets, and sustainability of shareholder returns. I will also highlight the risks underlying an investment in rail companies and conclude with a comparative valuation assessment to make sense of the current share prices.
Overview Of Union Pacific And Norfolk Southern
Union Pacific’s rail network connects 23 states in the western two-thirds of the United States, and it owns about 80% of the 32.5k route miles it operated in 2021. Norfolk Southern operates primarily in the eastern, southeastern, and Midwestern United States, but its network is considerably smaller than UNP’s. It covers 19.3k route miles, of which NSC owns about 75%. Union Pacific generated about $672 per route mile in 2021, while that metric for Norfolk Southern is only $577 per route mile. In other words, UNP is only 68% larger in terms of route miles operated, but almost twice as large as NSC in terms of revenue. In terms of operating margin, the two companies are very close, with three-year averages of 41% and 40%, respectively.
Intermodal transportation is playing an increasingly important role for both companies (22% and 28% of UNP and NSC 2021 revenues, respectively). This segment has recovered significantly from 2020 lows for both companies, with intermodal revenues increasing more for NSC, even on a two-year comparable basis (5.8% vs. 4.6% annualized for NSC and UNP, respectively).
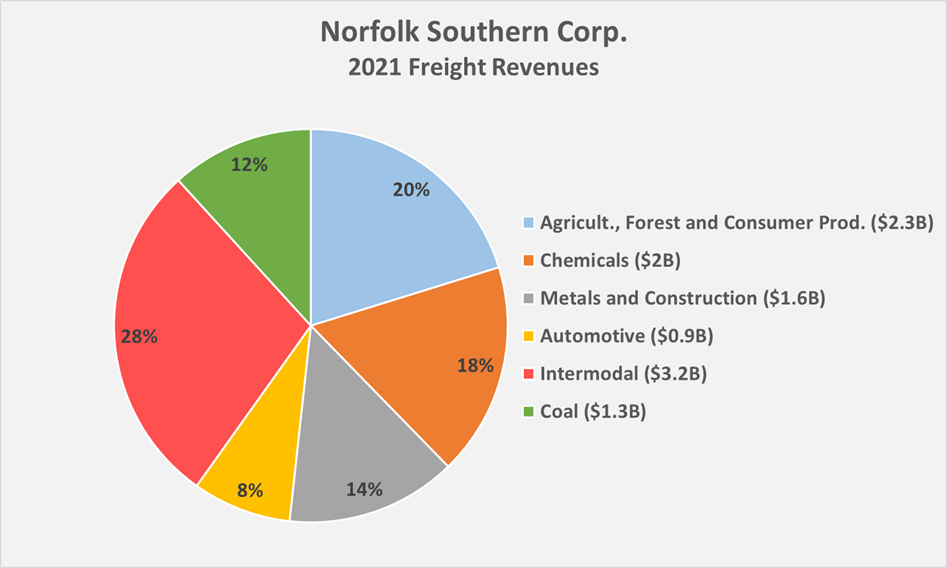
UNP and NSC primarily carry raw materials, intermediate goods, but also finished goods. As such, they are both important for coal shipments, which have experienced a renaissance due to the global energy crisis. However, over the long term, the secular decline in coal use for thermal and electric power generation remains intact (see my overview of three major U.S. utilities). Therefore, the current increased demand should be viewed more as a temporary tailwind. Given NSC’s presence in the eastern third of the U.S., it is hardly surprising that coal shipments still play a larger role (12% of 2021 freight revenue) than for Union Pacific (9% of 2021 freight revenue, including renewables). Figure 1 and Figure 2 show the segment freight revenues of UNP and NSC for 2021.
Figure 1: 2021 segment freight revenues of Union Pacific Corp. (own work, based on the company’s 2021 10-K) Figure 2: 2021 segment freight revenues of Norfolk Southern Corp. (own work, based on the company’s 2021 10-K)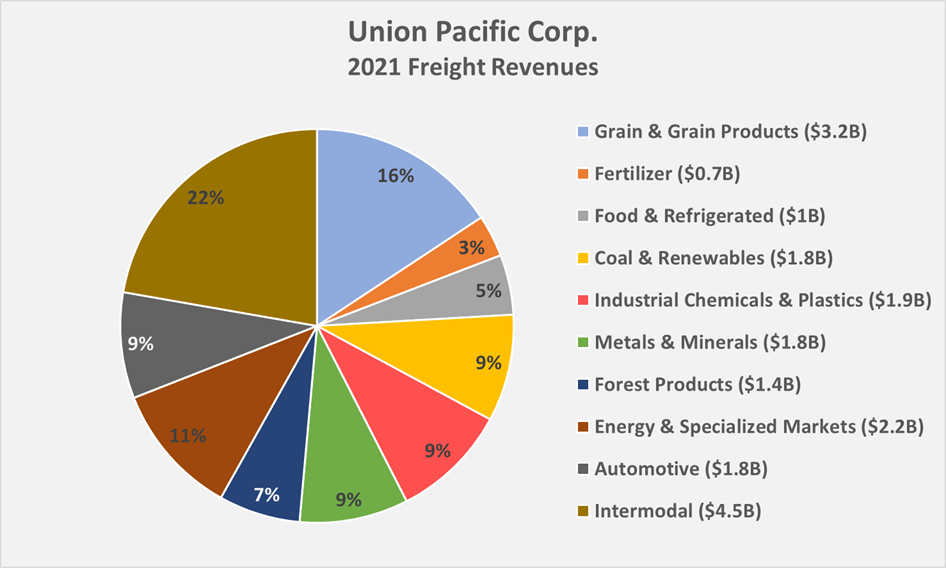
Growth And Profitability
Over the last ten years, revenues of both companies have grown in the low single digits. However, over the last three years, UNP’s revenue growth has outpaced NSC’s at nearly 5% compared to an annual average of 3.6%. From an operating income perspective, both railroads grew at healthy mid-single-digit compound annual growth rates (CAGR), while free cash flow, normalized in terms of working capital movements and adjusted for stock-based compensation expenses and impairment charges, grew at CAGRs of 9.3% and 12.3%, respectively. The fact that NSC was able to grow its normalized free cash flow (nFCF) at a significantly higher rate, despite weaker revenue growth, can be explained in part by the company’s improved cash conversion cycle (Figure 3). Asset turnover at UNP and NSC declined by about 22% and 24%, respectively, over the past decade, but has been very stable since 2016.
It appears that the surprisingly strong nFCF growth – for railroads – over the past decade is largely due to margin expansion, also as both companies benefit from precision scheduled railroading, and little to revenue growth. It is therefore not surprising that nFCF growth has slowed in recent years, by 2.4 and 6.6 percentage points at UNP and NSC, respectively, when comparing 10- and 3-year CAGRs – there is simply a limit to improving operational efficiency.
Figure 3: Cash conversion cycles of UNP and NSC (own work, based on the companies’ 2012 to 2021 10-Ks)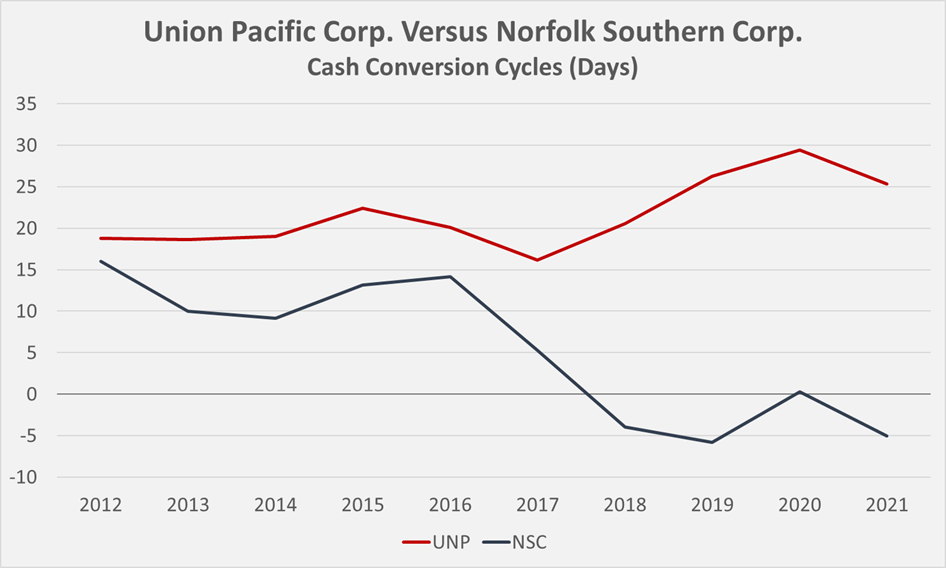
Going forward, analysts of UNP and NSC expect revenue growth of 4.4% and 4.3%, respectively. It seems reasonable to assume that free cash flow – and thus shareholder returns – will grow at similar rates. Of course, a significant economic downturn could quickly lead to downward revisions, as shown by revenue performance during the Great Financial Crisis (GFC, Figure 4). However, I do not want to imply here that the U.S. is facing a recession of similar magnitude, because I personally believe that the U.S. is much better prepared for any upcoming challenges than Europe, for example.
Figure 4: Revenue trajectories of UNP and NSC during the Great Financial Crisis; year-over-year growth rates in parentheses (own work, based on the companies’ 2006 to 2010 10-Ks)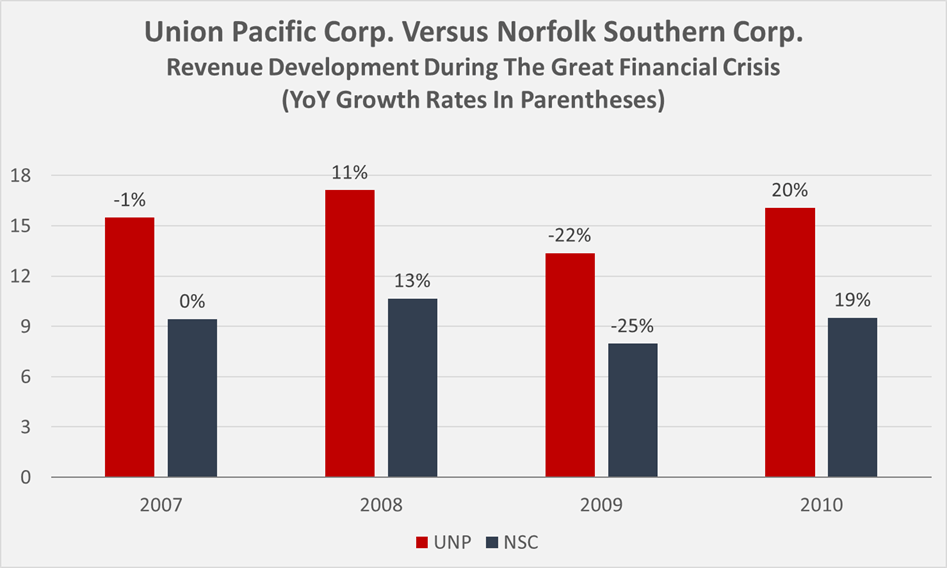
Besides growth and margins, it is worth taking a closer look at shareholder return in terms of return on invested capital (ROIC), the most important profitability metric in my opinion. However, since I am a cash flow-oriented investor, I replace net operating profit after tax with nFCF. Cash ROIC (CROIC) is much less susceptible to manipulation and provides a very clear picture of the potential excess return shareholders can expect over the cost of capital. Similar to ROIC, CROIC can be compared to the company’s cost of capital, but since nFCF is a shareholder-oriented measure, it should be compared to the cost of equity rather than the weighted average cost of capital. Given that railroads give rise to very dependable cash flows, investors should be comfortable with a somewhat below-average cost of equity, and I personally believe a 4% equity risk premium is appropriate. Due to the recent increases in risk-free rates, the cost of equity for UNP and NSC therefore currently equals approximately 7.3%. In Figure 5 and Figure 6, I show the CROIC of UNP and NSC compared to the cost of equity, using the risk-free rate at the end of each fiscal year. It should be noted that I have moved to two approaches to calculate the denominator (invested capital). Therefore, I have included error bars in the figures to illustrate the uncertainty of each company’s CROIC.
Figure 5: UNP’s cash return on invested capital, compared to the cost of equity, which is based on a 4% equity risk premium and the federal funds rate at the end of each full year reporting period (own work, based on the company’s 2012 to 2021 10-Ks, the third-quarter 2022 earnings release, and own estimates) Figure 6: NSC’s cash return on invested capital, compared to the cost of equity, which is based on a 4% equity risk premium and the federal funds rate at the end of each full year reporting period (own work, based on the company’s 2012 to 2021 10-Ks, the second-quarter 2022 earnings release, and own estimates)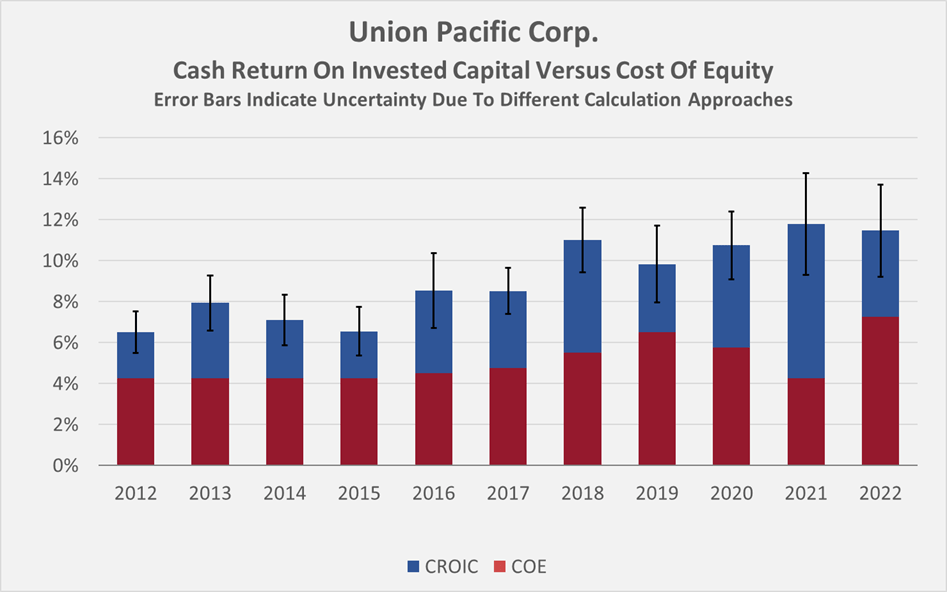
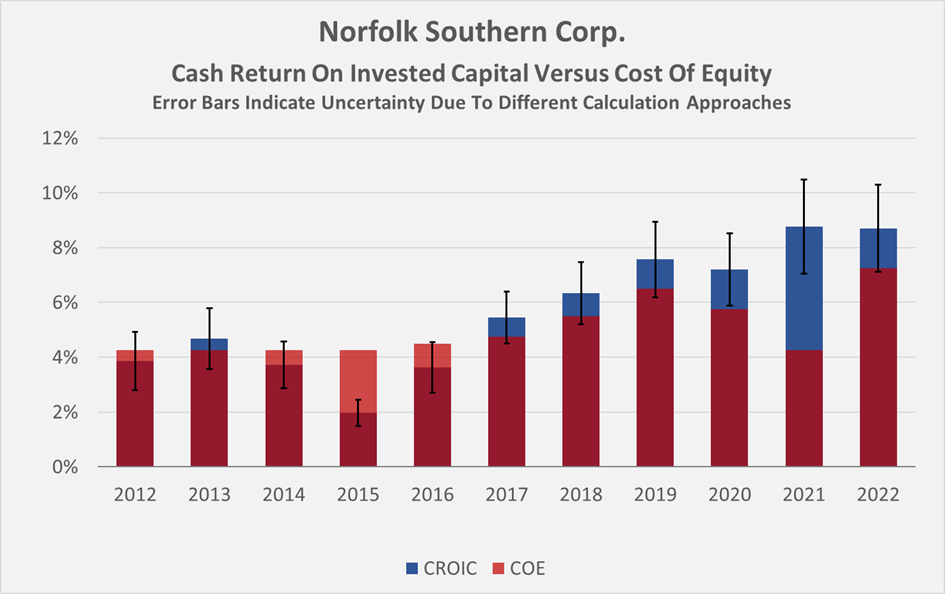
While UNP has delivered consistent excess returns over the past decade and will certainly continue to deliver double-digit CROICs in 2022, NSC went through a period of weakness between 2012 and 2016, with no excess returns on invested capital in most years. This was largely due to significant capital expenditures in 2015 and poor working capital management. Since 2017, NSC’s performance has steadily improved, although not to the level of UNP.
Balance Sheet Quality And Dividend Safety
Union Pacific and Norfolk Southern are both investment grade rated companies. Moody’s assigned UNP’s long-term debt a rating of A3 (A- S&P equivalent) with a stable outlook at the end of July 2022, while it assigned NSC’s long-term debt a Baa1 rating (BBB+ S&P equivalent) some time ago, but also with a stable outlook. The difference of just one notch can hardly be called significant. But even if the balance sheets of both companies carry solid ratings, it should not be forgotten that debt knew only one direction over the last ten years – up and to the right. Since 2012, UNP’s net debt (including discounted lease obligations) has more than doubled (2.4x), while NSC’s obligations have increased 1.6 times (Figure 7). Of course, railroads are very capital-intensive businesses with constant maintenance and expansion needs, and considering the nFCF growth over the same period, the expansion in net debt seems reasonable with CAGRs of 9.3% and 5.0% for UNP and NSC, respectively. As a result, it is not surprising that the leverage ratios of both companies are still very acceptable (Figure 8). The five-year credit default swaps (CDS) available for UNP and NSC also do not indicate any problems. Spreads have widened in recent months, but this is understandable given rising interest rates. UNP’s five-year CDS spread is currently at 39 basis points, while it peaked at 55 basis points in early 2020 and 150 basis points during the GFC. Although NSC is a much smaller company, its five-year CDS spread is at the same level as UNP’s. During the peak of the pandemic and the GFC, NSC’s CDS spread tracked that of UNP surprisingly well.
Figure 7: UNP’s and NSC’s historical net debt including discounted lease obligations (own work, based on the companies’ 202 to 2021 10-Ks, the third-quarter 2022 earnings release by UNP and the second-quarter 2022 earnings release by NSC) Figure 8: UNP’s and NSC’s historical leverage ratios (own work, based on the companies’ 202 to 2021 10-Ks, the third-quarter 2022 earnings release by UNP and the second-quarter 2022 earnings release by NSC)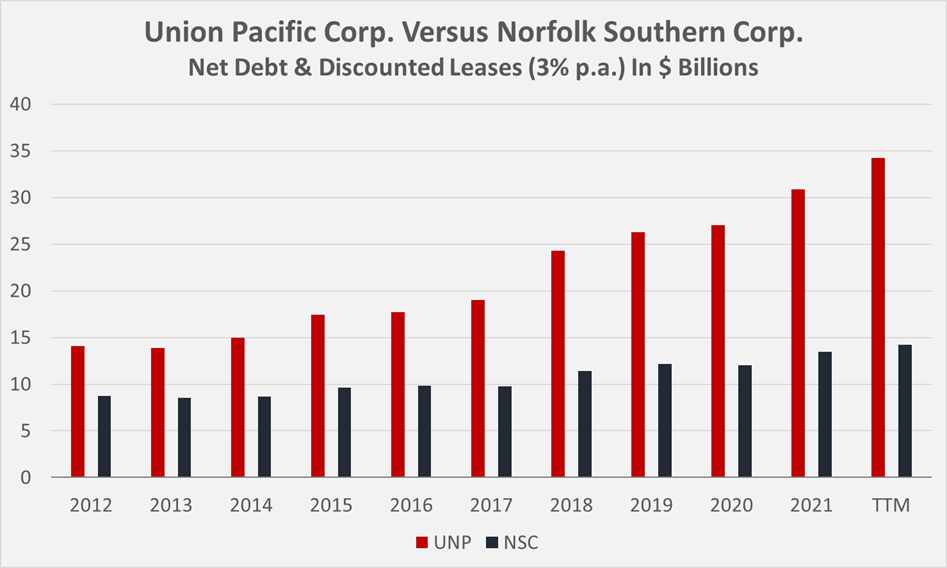
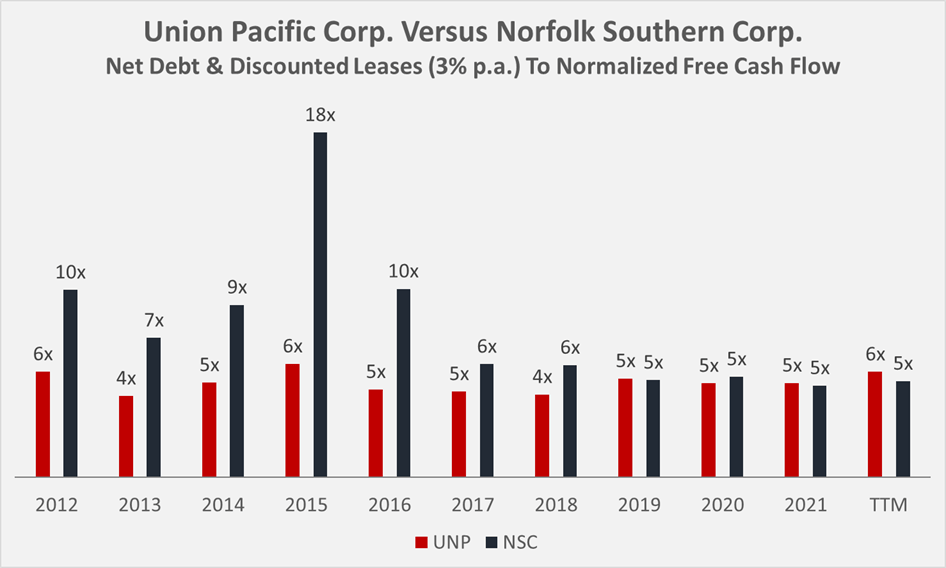
However, even if the debt levels are acceptable for such capital-intensive companies, it is still important to put free cash flow in relation to cash returns for shareholders, as increasing debt can also be a sign of unsustainable dividends and/or share buybacks.
Both companies pay a steadily increasing dividend. UNP is looking back at 15 years of uninterrupted dividend growth. NSC’s track record is also very solid, although it is marred by the stagnant dividend in 2020, when the company paid the same quarterly dividend of $0.94 for six consecutive quarters. As a conservative investor, I don’t mind such management decisions, especially given the significant uncertainties during the first year of the pandemic.
At first glance, both dividend track records look very solid, with ten-year compound annual growth rates of 15.1% for UNP and 9.2% for NSC. UNP’s somewhat overly aggressive dividend growth results in a higher, but still acceptable, payout ratio of 50% of nFCF, while NSC’s payout ratio is currently 40% of nFCF. UNP and NSC currently offer a yield of 2.67% and 2.30%, respectively. From a payout ratio perspective, UNP investors should expect a lower dividend growth rate in the future. However, considering that Norfolk Southern has about 20% higher interest expense on a relative basis, and likely due to management’s somewhat more conservative approach to dividend growth, not much difference is expected. Dividend growth rates at both companies declined in recent years, but both are still handsomely beating also currently high rates of inflation.
However, when share buybacks are taken into account, both companies have stretched their balance sheets. UNP and NSC generated normalized free cash flow of $42.1 billion and $15.5 billion, respectively, between 2012 and 2021, but distributed $63.2 billion and $20.6 billion, respectively, to shareholders through dividends and share repurchases. A conservative investor might view such behavior as financial engineering, given that earnings per share have increased 51% and 34%, respectively, since 2012 due to the reduction in shares outstanding. Conversely, such aggressive share buybacks could also be viewed as opportunistic exploitation of the low interest rate environment. After all, the maturity profiles of UNP and NSC are both very conservative (Figure 9) – about 80% of each company’s total debt matures in 2027 or later. For example, NSC’s recent bond issues include $500 million maturing in 2031 (2.30% coupon), $600 million maturing in 2051 (2.90%), and another $600 million maturing in 2121 (4.10%).
Figure 9: UNP’s and NSC’s debt maturity profiles (own work, based on the companies’ 2021 10-Ks)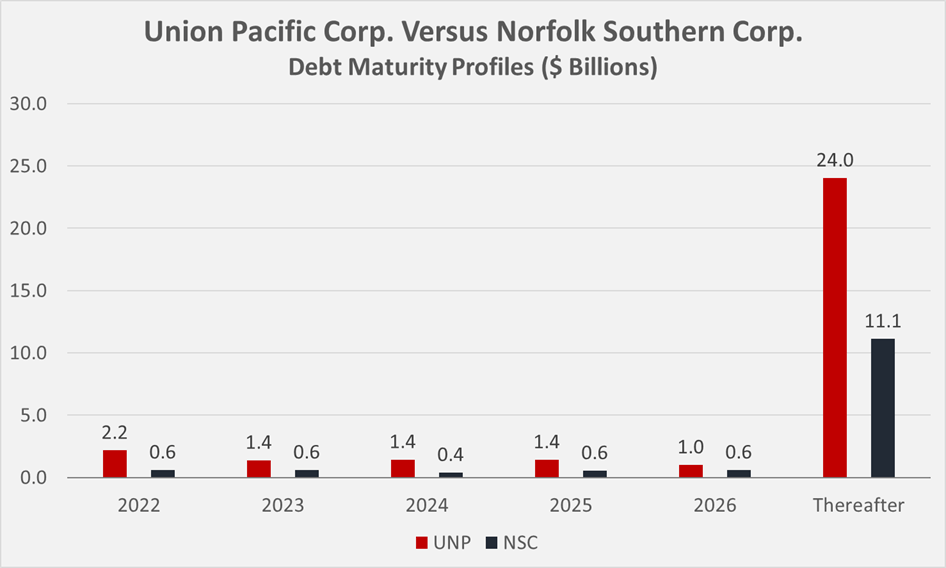
Risks
Commonly understood risks include declining revenues and profits due to an economic downturn or conventional balance sheet risks due to excessive debt. As discussed above, the balance sheets of both companies are in order, and I do not consider them to be at risk of insolvency even if an excessive downturn were to occur. Given their large asset bases, long-standing histories, and monopolistic tendencies, railroads such as NSC and UNP have ample borrowing capacity, which should ensure dividend security even if cash flows decline temporarily.
Currency risks in the traditional sense are not applicable. However, as UNP and NSC are significantly active in commodity transportation, they are indirectly exposed to exchange rate fluctuations and moderate cyclicality is to be expected.
In this context, it is also worth noting that transportation companies are generally sensitive to the price of oil, which directly affects fuel prices, a major cost for railroads (10.1% and 7.2% of UNP and NSC revenues in 2021, respectively).
In his excellent article, fellow contributor Chuck Walston pointed out the risk of strikes, since the vast majority of railroad workers are organized in unions, which would understandably have a significant impact on stock prices. However, such events are usually temporary in nature, as the article points out, and I would even go so far as to view such risk as an opportunity for someone looking to build a position in a railroad stock. Less risk-averse investors, however, should be aware of the threat of strikes and the associated share price volatility.
Other risks to consider include potential natural disasters that would lead to temporary breakdowns in transportation routes, but also litigation related to hazardous materials accidents, headwinds from restrictive legislation in the context of fossil-fuel powered trains, and to a lesser extent litigation risks and terrorist attacks.
Stock Valuation: UNP Vs. NSC
Union Pacific and Norfolk Southern caught my attention because they are currently trading about 30% below their respective 52-week highs. As mentioned earlier, UNP’s dividend yield is higher than NSC’s and therefore, all else being equal, more interesting to an income-oriented investor like myself.
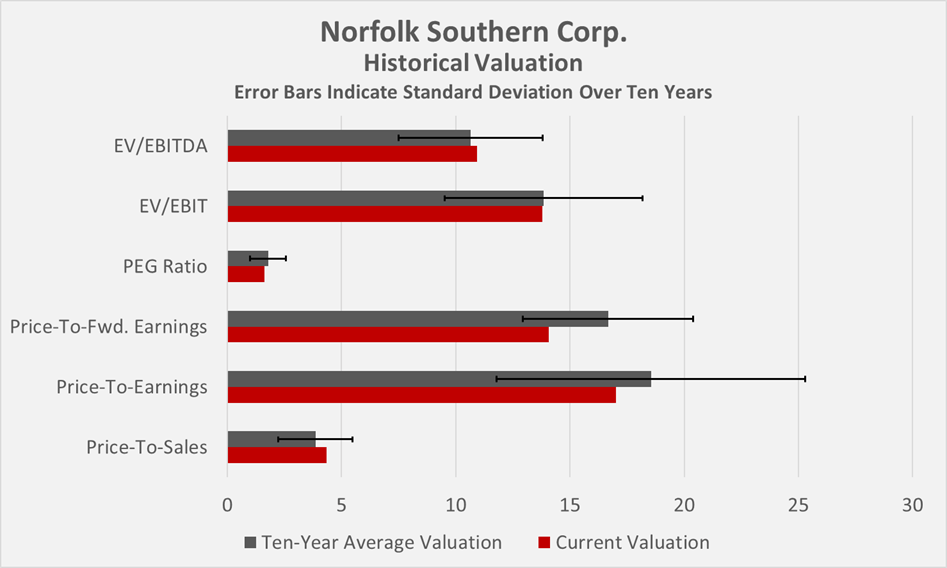
Figure 10 and Figure 11 show historical valuations of UNP and NSC, taking into account the last ten years of data. It is evident that both stocks went through a period of significant overvaluation in 2021 and are now trading at near fair valuations. However, it is important to remember that these valuations are the product of what was likely the strongest bull market in modern history. As of October 24, Morningstar rates NSC as a four-star stock and considers it 12% undervalued, while the investor service firm rates UNP as a three-star stock based on its current discount of only 4%.
Figure 10: Historical valuation of Union Pacific stock (own work) Figure 11: Historical valuation of Norfolk Southern stock (own work)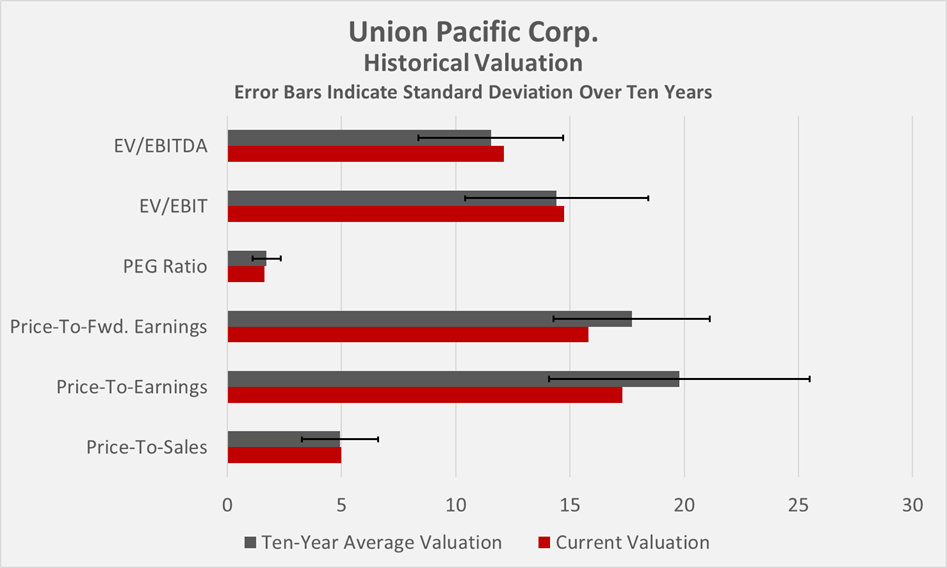
Discounted cash flow analyses based on average normalized free cash flows for the 2019-2021 period suggest that both stocks are currently fairly valued, assuming a cost of equity of 7.3% (i.e., a 4% risk premium) and terminal growth rates of 3.0% (Figure 12). Such implied terminal growth rates do not seem particularly optimistic to me, given the past performance of both companies and their continued resilience in the current high inflationary environment.
Figure 12: Discounted cash flow sensitivity analyses for UNP and NSC (own work)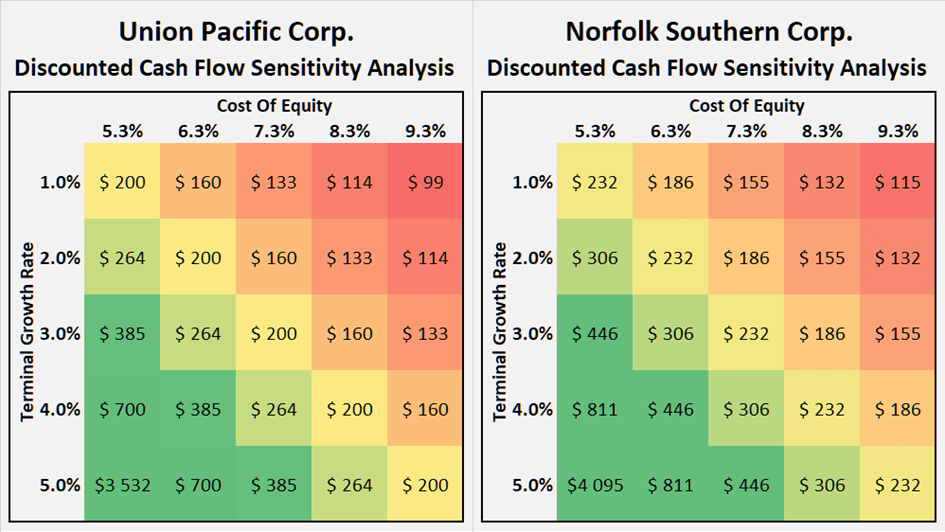
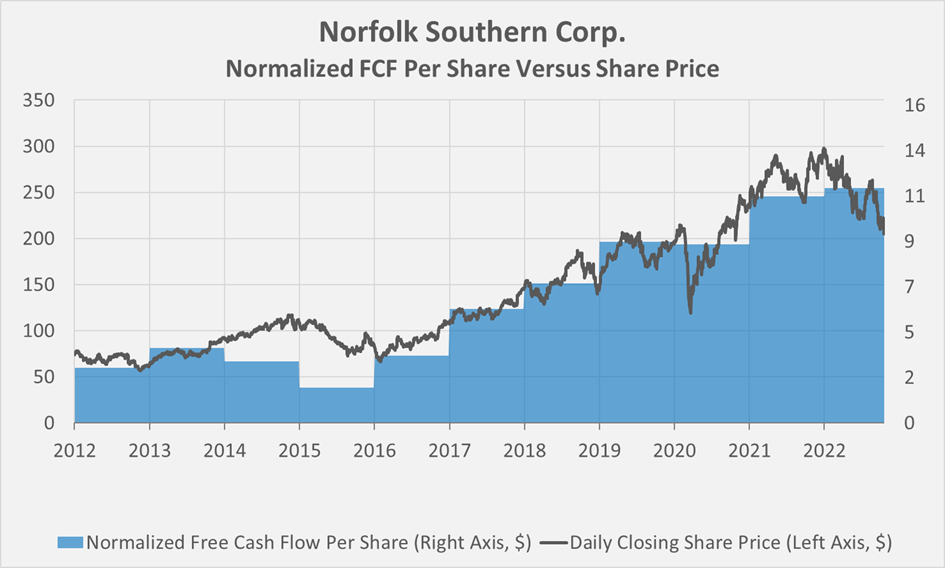
Finally, Figure 13 and Figure 14 show FAST Graphs-inspired plots of each company’s normalized free cash flow per share versus the daily closing share price. Note that for the 2022 periods, I have included my own estimates of this year’s free cash flow for UNP and NSC, and included the weighted average diluted shares outstanding in Q3 and Q2, respectively. Even after these representations, both stocks appear to be roughly fairly valued at present.
Finally, Figure 13 and Figure 14 show FAST Graphs-inspired plots of each company’s normalized free cash flow per share against the daily closing share price. Note that for the 2022 periods, I included my own estimates for this year’s free cash flow of UNP and NSC, and took the weighted-average diluted shares outstanding in Q3 and Q2 into account, respectively. Also according to these representations, both stocks appear to be roughly fairly valued at present.
Figure 13: Overlay of UNP’s normalized free cash flow per share and daily closing share price (own work, based on the company’s 2012 to 2021 10-Ks and the third-quarter 2022 earnings release and own estimates) Figure 14: Overlay of NSC’s normalized free cash flow per share and daily closing share price (own work, based on the company’s 2012 to 2021 10-Ks, the second-quarter 2022 earnings release and own estimates)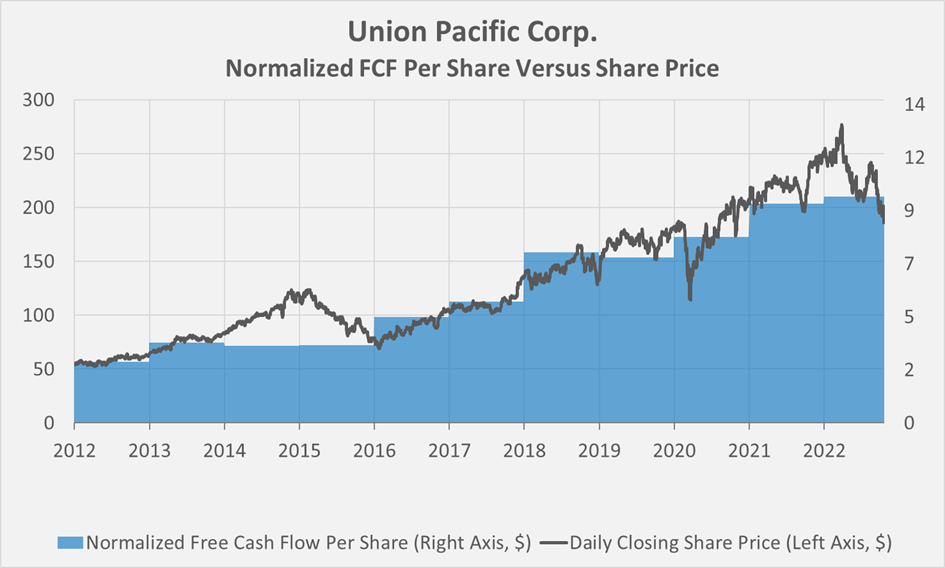
Key Takeaways
- Union Pacific and Norfolk Southern are both reliable railroad companies with solid free cash flow, wide economic moats, and consequently very high barriers to entry. Rail transportation is much more efficient than trucking when it comes to high volume-to-value freight.
- A look at their operating networks and the increasing importance of intermodal freight makes it hard to imagine that both UNP and NSC will face increasing competition in the coming years and probably decades.
- Coal shipments, which continue to be in secular decline despite their temporary renaissance, play a smaller role at UNP, which generally strikes me as the more diversified company.
- NSC in particular has improved in recent years in terms of free cash flow efficiency, but UNP has performed more reliably and is also much larger in terms of revenue and route miles operated.
- The revenue decline during the GFC was similar for UNP and NSC. Also in 2022, both have the flexibility in their balance sheets to weather a deep recession.
- UNP’s management appears to be a bit more shareholder-friendly, but both companies look very attractive to me from the perspective of an income-oriented investor. Payout ratios are conservative, and dividend growth is expected to continue to outpace inflation.
- After an exuberant 2021, UNP and NSC are finally trading at reasonable valuations again. However, as a conservative value investor, I do my best not to overpay for my investments, so I’d like to see the stocks with at least a 10% margin of safety, i.e., prices below $180 and $200, respectively.
- Investing in both UNP and NSC is probably the lower risk approach, but I personally would start with a position in UNP as it is the larger railroad company with more reliable results, stronger excess CROIC and also a higher starting yield of 2.7% currently.
Thank you very much for taking the time to read my article. In case of any questions or comments, I am very happy to hear from you in the comments section below.
Be the first to comment