

Angel Di Bilio/iStock Editorial via Getty Images
Union Pacific Corporation (NYSE:NYSE:UNP) has been in my family portfolio for almost 12 years. With our focus on enduring companies with shares bought at value prices, UNP stands out as a defensive industrials sector staple in the North American railroads’ oligopoly.
I had initially covered UNP on Seeking Alpha in an Editor’s Pick article in 2017.
Seeking Alpha Premium
This updated primary ticker research report puts Union Pacific and its common shares through my market-beating, data-driven investment research checklist of the value proposition, shareholder yields, fundamentals, valuation, and downside risk.
The resulting investment thesis:
Despite a premium valuation and typical debt levels for a railroad, Union Pacific is a wide-moat, fundamentally sound, high margin dividend-payer that should be a core forever holding in any quality stock portfolio.
My current overall rating: Buy.
Unless noted, all data presented is sourced from Seeking Alpha and YCharts as of the market close on June 23, 2022, and intended for illustration only.
Market-B eating High-Quality Business Model
Union Pacific is a dividend-paying large-cap stock in the industrials sector’s railroads industry.
Through its subsidiary, the Union Pacific Railroad Company, Union Pacific Corporation operates in the railroad freight business in the United States. As of December 31, 2021, its rail network included 32,452 route miles connecting Pacific Coast and Gulf Coast ports with the Midwest and Eastern United States gateways. The company was founded in 1862 and is headquartered in Omaha, Nebraska.
My value proposition elevator pitch for Union Pacific:
Union Pacific owns the highest quality business model in the North American freight rail oligopoly.
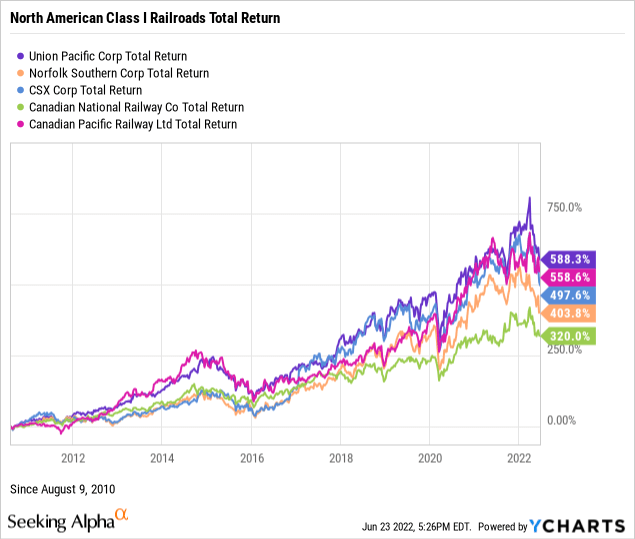
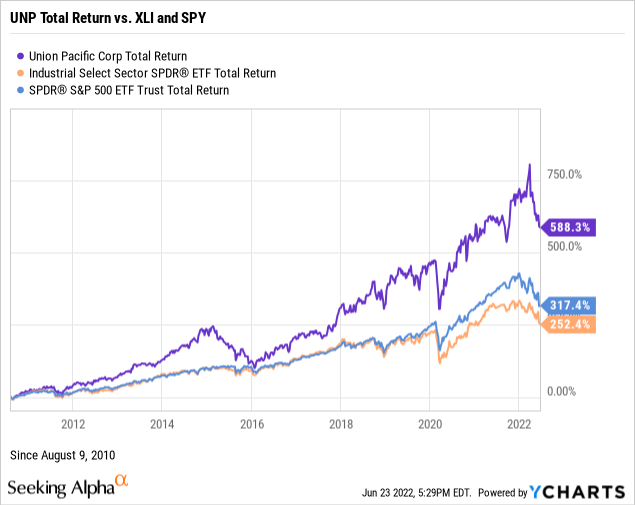
The charts below illustrate the stock’s performance against the North American Class I railroads, the Industrial Select Sector SPDR® Fund ETF (NYSE:XLI), and the SPDR S&P 500 ETF Trust (NYSE:SPY), since adding the shares to our family portfolio on August 9, 2010.
The Class I railroad group includes Norfolk Southern (NYSE:NSC), CSX (NASDAQ:CSX), Canadian National Railway (NYSE:CNI), and Canadian Pacific Railway (NYSE:CP).
Ultimately, investing in individual common stocks should aim to beat the benchmark indices over time. For example, UNP has convincingly outperformed the total returns of its industry, sector, and market peers for a dozen years during a bull market for indices. Now that’s primary ticker dominance.
For a more in-depth analysis of the all-important value proposition, readers should visit Union Pacific’s investor relations webpage and most recent Form 10-K Annual Report.
My value proposition rating for UNP: Bullish.
Yield on Cost Seven Times Forward Yield
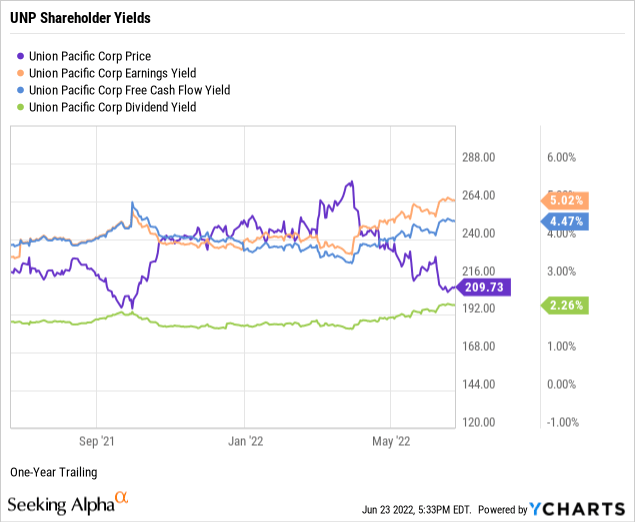
As part of my due diligence, I average the total shareholder yields on earnings, free cash flow, and dividends to measure how a targeted stock compares to the prevailing yield on the 10-year Treasury benchmark note. In other words, what is the equity bond rate of the common shares?
Screen for an earnings yield greater than 6 percent or the equivalent P/E multiple below 17 times. UNP is just under the floor at 5.02%, as demonstrated in the below chart.
Target a free cash flow yield or FCFY of 7 percent and higher or the equivalent of fewer than 15 times the inverted price-to-free cash flow multiple. At 4.47%, UNP is under the threshold.
Whether or not you are a yield-motivated investor, consider dividend-paying stocks for compensation in the short term while waiting for capital gains to compound over time. Union Pacific offers a dividend yield of 2.26% with a moderate 42.74% payout ratio, below my 60% payout ratio ceiling, thus indicating a safe, well-covered dividend with room for increases.
Chase high dividend yields only when calculated on a cost basis. For example, UNP was yielding a whopping 17.14% on our portfolio’s adjusted cost basis of $30.33 per share since August of 2010, more than seven times the current forward yield. Another reminder that buy-and-hold quality value investing works.
Next, take the average of the three shareholder yields to measure how the stock compares to the prevailing yield of 3.09% on the 10-year Treasury benchmark note. The average shareholder yield for UNP was 3.92% but 8.88% using the stock’s dividend yield on cost in our family portfolio. Arguably, equities are deemed riskier than U.S. bonds. However, securities that reward shareholders at higher yields than the government benchmark, especially long-held shares such as UNP, favor owning the stock instead of the bond.
Remember that earnings and free cash flow yields are inverses of valuation multiples and suggest that UNP is fairly valued. We’ll further explore valuation later in this report.
My shareholder yields rating for UNP: Bullish.
Superior Management Performance
Let’s explore the fundamentals of Union Pacific, uncovering the performance strength of the company’s senior management.
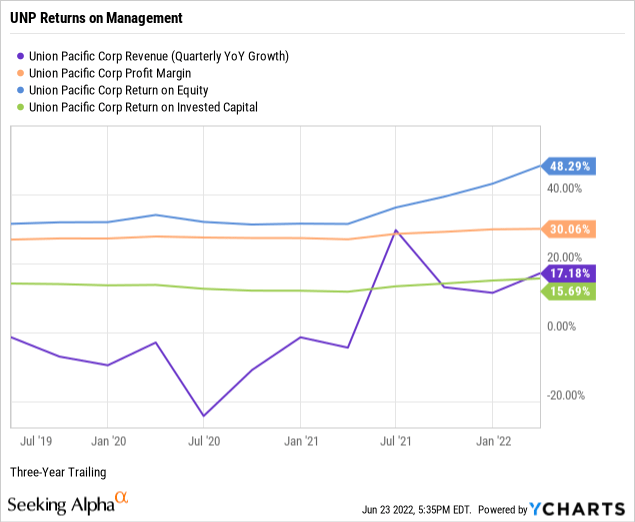
When analyzing a business, stay biased toward established growth instead of executive guidance and sell-side analyst projections. For example, per the below chart, Union Pacific had three-year revenue growth of 17.18%, almost triple the 6.10% median growth for the industrials sector.
Union Pacific had a trailing three-year pre-tax net profit margin of 30.06%, far exceeding the sector’s median net margin of 6.71%. Remember, screen for profitable companies to avoid unnecessary speculation. Union Pacific’s double-digit margin is extraordinary.
Return on equity, or ROE, reveals how much profit a company generates from shareholder investment in the stock. Target an ROE of 15 percent or higher to discover shareholder-friendly management. For example, Union Pacific was producing trailing three-year returns on equity of 48.29% against a median ROE of 14.36% for the sector. UNP’s compelling net income contributes to its excellent returns on equity.
Target a return on invested capital or ROIC above 12%. At 15.69%, Union Pacific exceeds the threshold and the sector’s median ROIC of 7.08%, indicating that senior executives are highly efficient capital allocators. Return on invested capital measures how well a company invests its resources to generate excess returns.
ROIC needs to exceed the weighted average cost of capital or WACC by a comfortable margin, giving management’s ability to outperform its capital costs. UNP had a trailing WACC of 9.18% (Source: GuruFocus). The sufficient spread between ROIC and WACC combined with double-digit growth, a spectacular net profit margin, and compelling returns on equity and capital indicate superior management performance at Union Pacific.
My fundamentals rating for UNP: Bullish.
Premium Priced Stock of a Quality Operator
A savvy retail investor can rely on just four valuation multiples to estimate the intrinsic value of a targeted quality enterprise’s stock price.
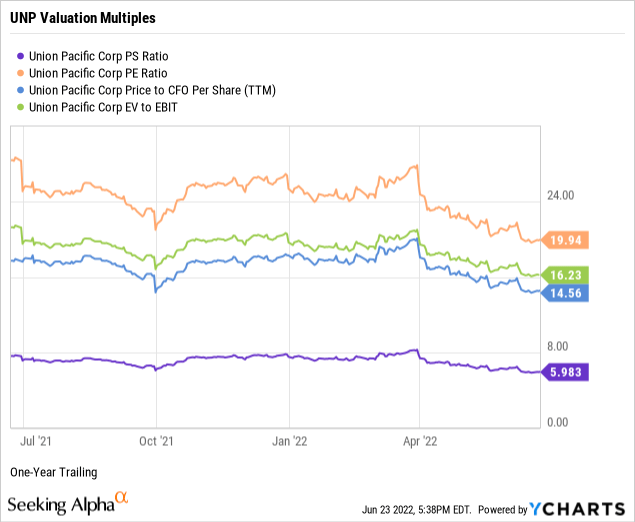
The price-to-sales ratio or P/S measures the stock price relative to revenues. Target fewer than 2.0 times, but at 5.98, UNP was trading well above the ceiling. In addition, the trailing P/S ratio was an appealing 1.28 times for the industrials sector and a modest 2.27 times sales for the S&P 500. Thus, the weighted industry plus market sentiment suggests an overvalued stock relative to Union Pacific’s topline.
Remember, with its predictable revenues, finding bargain price-to-sales ratios in the railroads space is challenging.
Although often a hit or miss multiple, target price-to-trailing earnings or P/E multiples fewer than 17 times or below the target stock’s sector averages. UNP had a price-to-earnings multiple of 19.94 against a sector P/E of 17.20 times, indicating investor sentiment places a modest premium on the stock price relative to earnings per share. Notably, UNP was trading at a slight discount to the S&P 500’s recent overall P/E of 20.33 times. (Source of S&P 500 P/E: Barron’s).
Target single-digit price-to-operating cash flow multiples for the best value. At 14.56 times, UNP was trading above the ceiling but slightly below the sector’s median of 15.05, indicating the market reasonably values the stock price relative to current cash flows.
Enterprise value to operating earnings or EV/EBIT measures whether a stock is overbought, a bearish signal, or oversold, a bullish signal, by the market. Target an EV/EBIT of fewer than 15 times. Against the broader sector median of 15.31 times, UNP was trading at 16.23 enterprise value to operating earnings signaling the stock was perhaps slightly overbought by the market.
Weighting the preferred valuation multiples suggests the market places a premium on Union Pacific’s stock price to sales and enterprise value but fairly values the shares to earnings and free cash flow. Therefore, based on the fundamentals and valuation metrics uncovered in this report, risks and potential catalysts notwithstanding, I would call UNP a premium-priced stock of an enduring quality operator within the railroads industry.
My valuation rating for UNP: Neutral.
Wide Moat But Average Risk from Debt Levels
When assessing the downside risks of a company and its common shares, focus on five metrics that, in my experience as an individual investor and market observer, often predict the potential risk/reward of the investment. Hence, assign a downside risk-weighted rating of above average, average, below average, or low, biased toward below average and low-risk profiles.
Alpha-rich investors target companies with clear competitive advantages from their products or services. An investor or analyst can streamline the value proposition of an enterprise with an economic moat assignment of wide, narrow, or none.
Morningstar assigns Union Pacific a wide moat rating.
In our view, each of the North American Class I railroads we cover, including Union Pacific, enjoys a wide economic moat rooted in cost advantages and efficient scale. Core pricing and margin resilience in past freight recessions and in the face of substantial coal volume losses over the past decade-plus are a testament to their robust competitive positioning. With near certainty, we expect the rails to continue to turn their two core moat sources into economic profit for the next 10 years, and more likely than not 20 years from now.
– Matthew Young, CFA, Equity Analyst, April 25, 2022
A favorite of the legendary value investor Benjamin Graham, long-term debt coverage demonstrates balance sheet liquidity or a company’s capacity to pay down debt in a crisis. Generally, at least one-and-a-half times current assets to long-term debt is ideal. Notably, as reported on its March 2022 quarterly financial statements, Union Pacific’s long-term debt coverage of 0.13 was far below the threshold.
In theory, the company could not pay off its longer-term debt obligations using its liquid assets such as cash and equivalents, short-term investments, accounts receivables, and inventories.
In the debt-laden railroads industry, liquidity is virtually a non-existent reality.
Current liabilities coverage or current ratio measures the short-term liquidity of the balance sheet. Although a debt-savvy investor should target higher than 1.00, UNP’s short-term debt coverage was 0.71. But, again, typical of a hard asset-laden railroad, the balance sheet provides insufficient liquid assets to pay down 100% of its current liabilities, such as accounts payable, accrued expenses, and income taxes.
As a long-term investor, use a five-year beta trend line and screen for stocks lower than 1.25 or no more than 125% volatility in the market. UNP’s trailing beta was 1.18. However, its shorter-term 24-month beta was at a less volatile 0.74. With price volatility hovering around the S&P 500 standard of 1.00, UNP presents a stable holding across market cycles.
The short interest percentage of the float for UNP was 1.04%, well under my recommended 10% ceiling. So perhaps the near-sighted bears view the stock as a safe, predictable revenue and earnings staple in the near-monopolistic railroad industry.
Despite industry typical debt levels, Union Pacific is a fundamentally sound, wide moat company with an acceptable risk profile.
My downside risk rating for UNP: Average.
UNP Catalysts and Final Thoughts
Catalysts confirming or contradicting my overall bullish investment thesis on Union Pacific Corporation and its common shares include, but are not limited to:
- Confirmation: UNP remains the highest quality business model in the North American Class I freight rail oligopoly for years to come.
- Contradiction: A prolonged recession and inflation could derail UNP’s outstanding revenue growth and cash flows, but its monopolistic track mileage and 30% net profit margin leave plenty of room to weather downturns.
I believe that Union Pacific remains worthy as a core forever holding in any quality-focused portfolio. Add to an existing low-cost basis holding, or initiate a new holding if the broader market continues into the bear cave, thereby depressing UNP’s stock price further despite its strong fundamentals.
Be the first to comment