

Kativ
The U.S. dollar index measures the value of the U.S. currency against other leading reserve foreign exchange instruments, including the euro, British pound, Japanese yen, Canadian dollar, Swedish krona, and Swiss franc. All these currencies, including the U.S. dollar, are freely exchangeable and highly liquid. Reserve currencies are integral for government holdings or savings and are routinely used for cross-border transactions and trade.
The euro is the second-leading reserve currency, so the dollar index holds a 57.6% exposure to the European foreign exchange instrument. Therefore, the euro versus the U.S. dollar currency relationship is the most significant factor driving the dollar index higher or lower.
After reaching a low of 89.165 in early 2021, the dollar index blasted off on the upside, rising 22.4% at the most recent high on July 14. Since then, the index has corrected and was below the 105.50 level on August 1, 2022. The Invesco DB US Dollar Index Bearish Fund (NYSEARCA:UDN) moves higher when the dollar index falls.
A two-decade high in July
The dollar index made higher lows and higher highs from the January 2021 89.165 low, reaching a peak in July 2022.
Three Year Chart in the US Dollar Index Futures Contract (Barchart)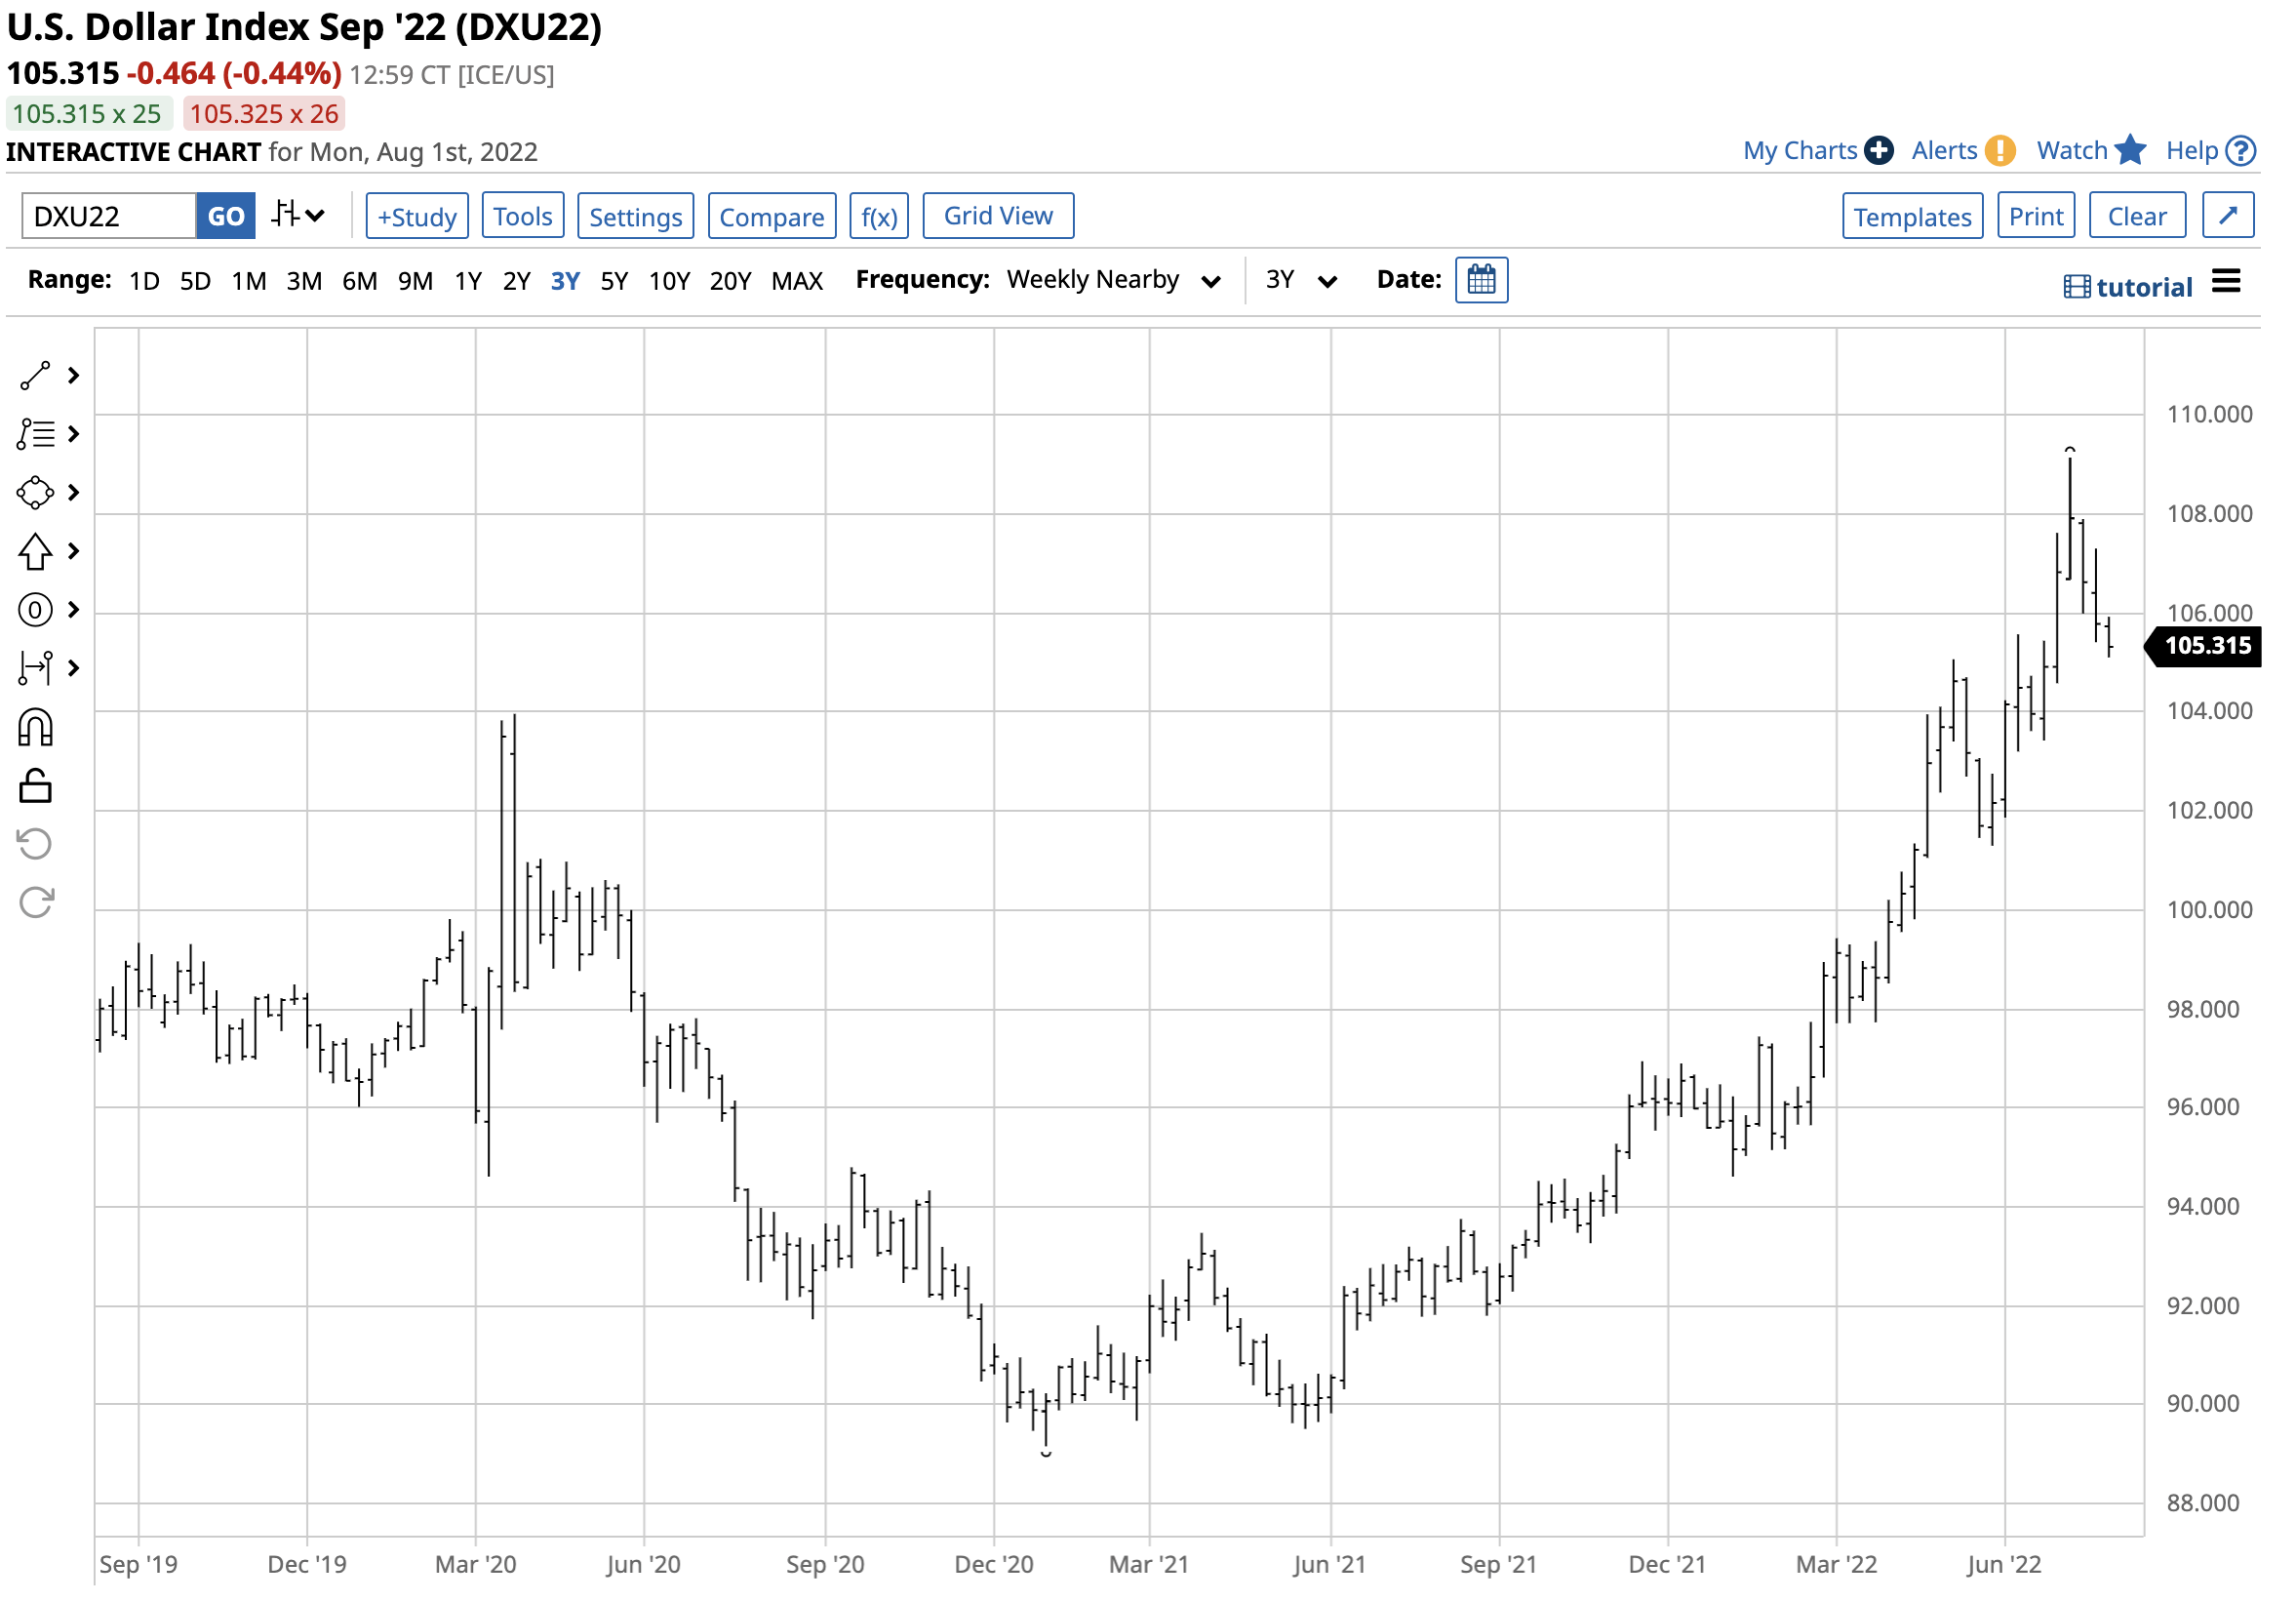
The chart highlights the 22.4% rally that took the index to 109.140 on July 11.
Long-Term Chart in the US Dollar Index Futures Contract (Barchart)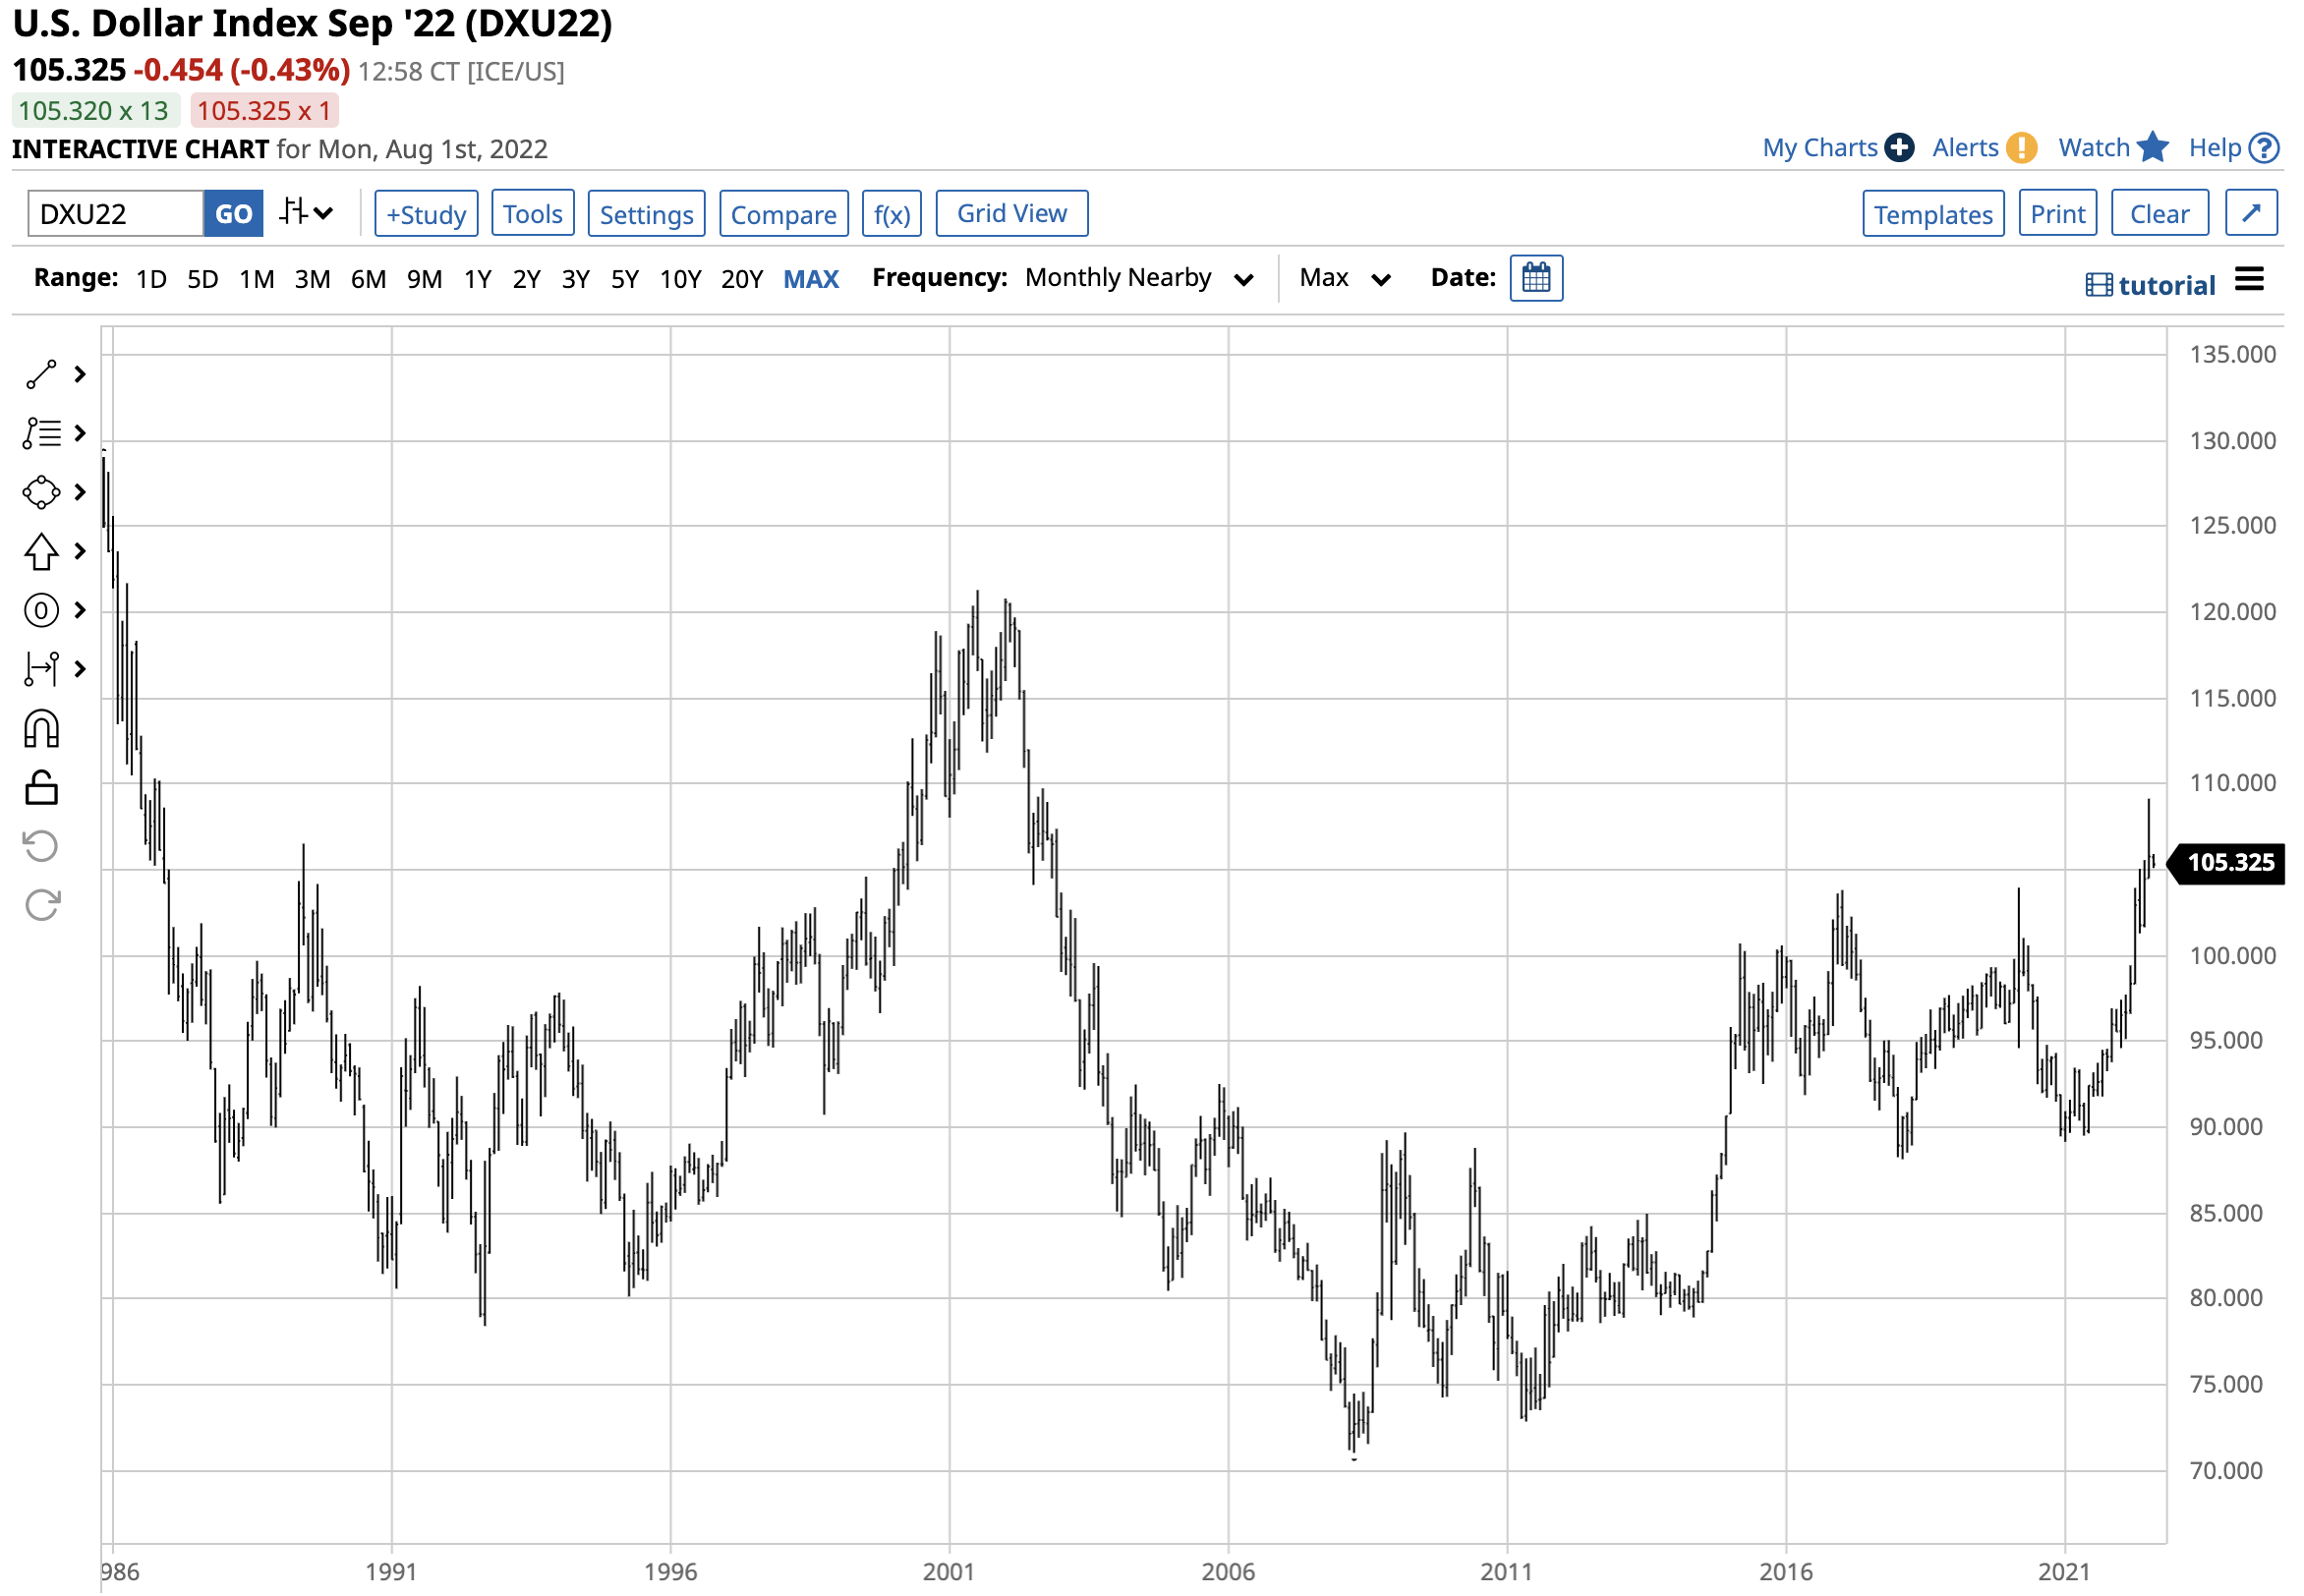
The long-term chart illustrates the dollar index rose to the highest level in two decades, since September 2002.
Interest rate differentials and the war were bullish
The dollar and the euro are the two leading reserve currencies. In late 2021, the U.S. Federal Reserve decided that inflationary pressures were not “transitory” and began to plan for a monetary policy path that addresses rising prices. Rising U.S. interest rates make holding dollars more attractive. As the gulf between the U.S. and European interest rates increased, the dollar gained in value against the euro and other currencies in the dollar index, pushing it higher and above a critical technical resistance level at the March 2020 103.96 high.
Meanwhile, the event that sent the dollar index above that technical level was Russia’s invasion of Ukraine, which started the first major war in Europe since World War II. The war at NATO and Western Europe’s doorstep weighed on the euro currency, causing it to decline to a two-decade low.
Long-Term Chart in the Euro Versus the US Dollar Currency Relationship (Barchart)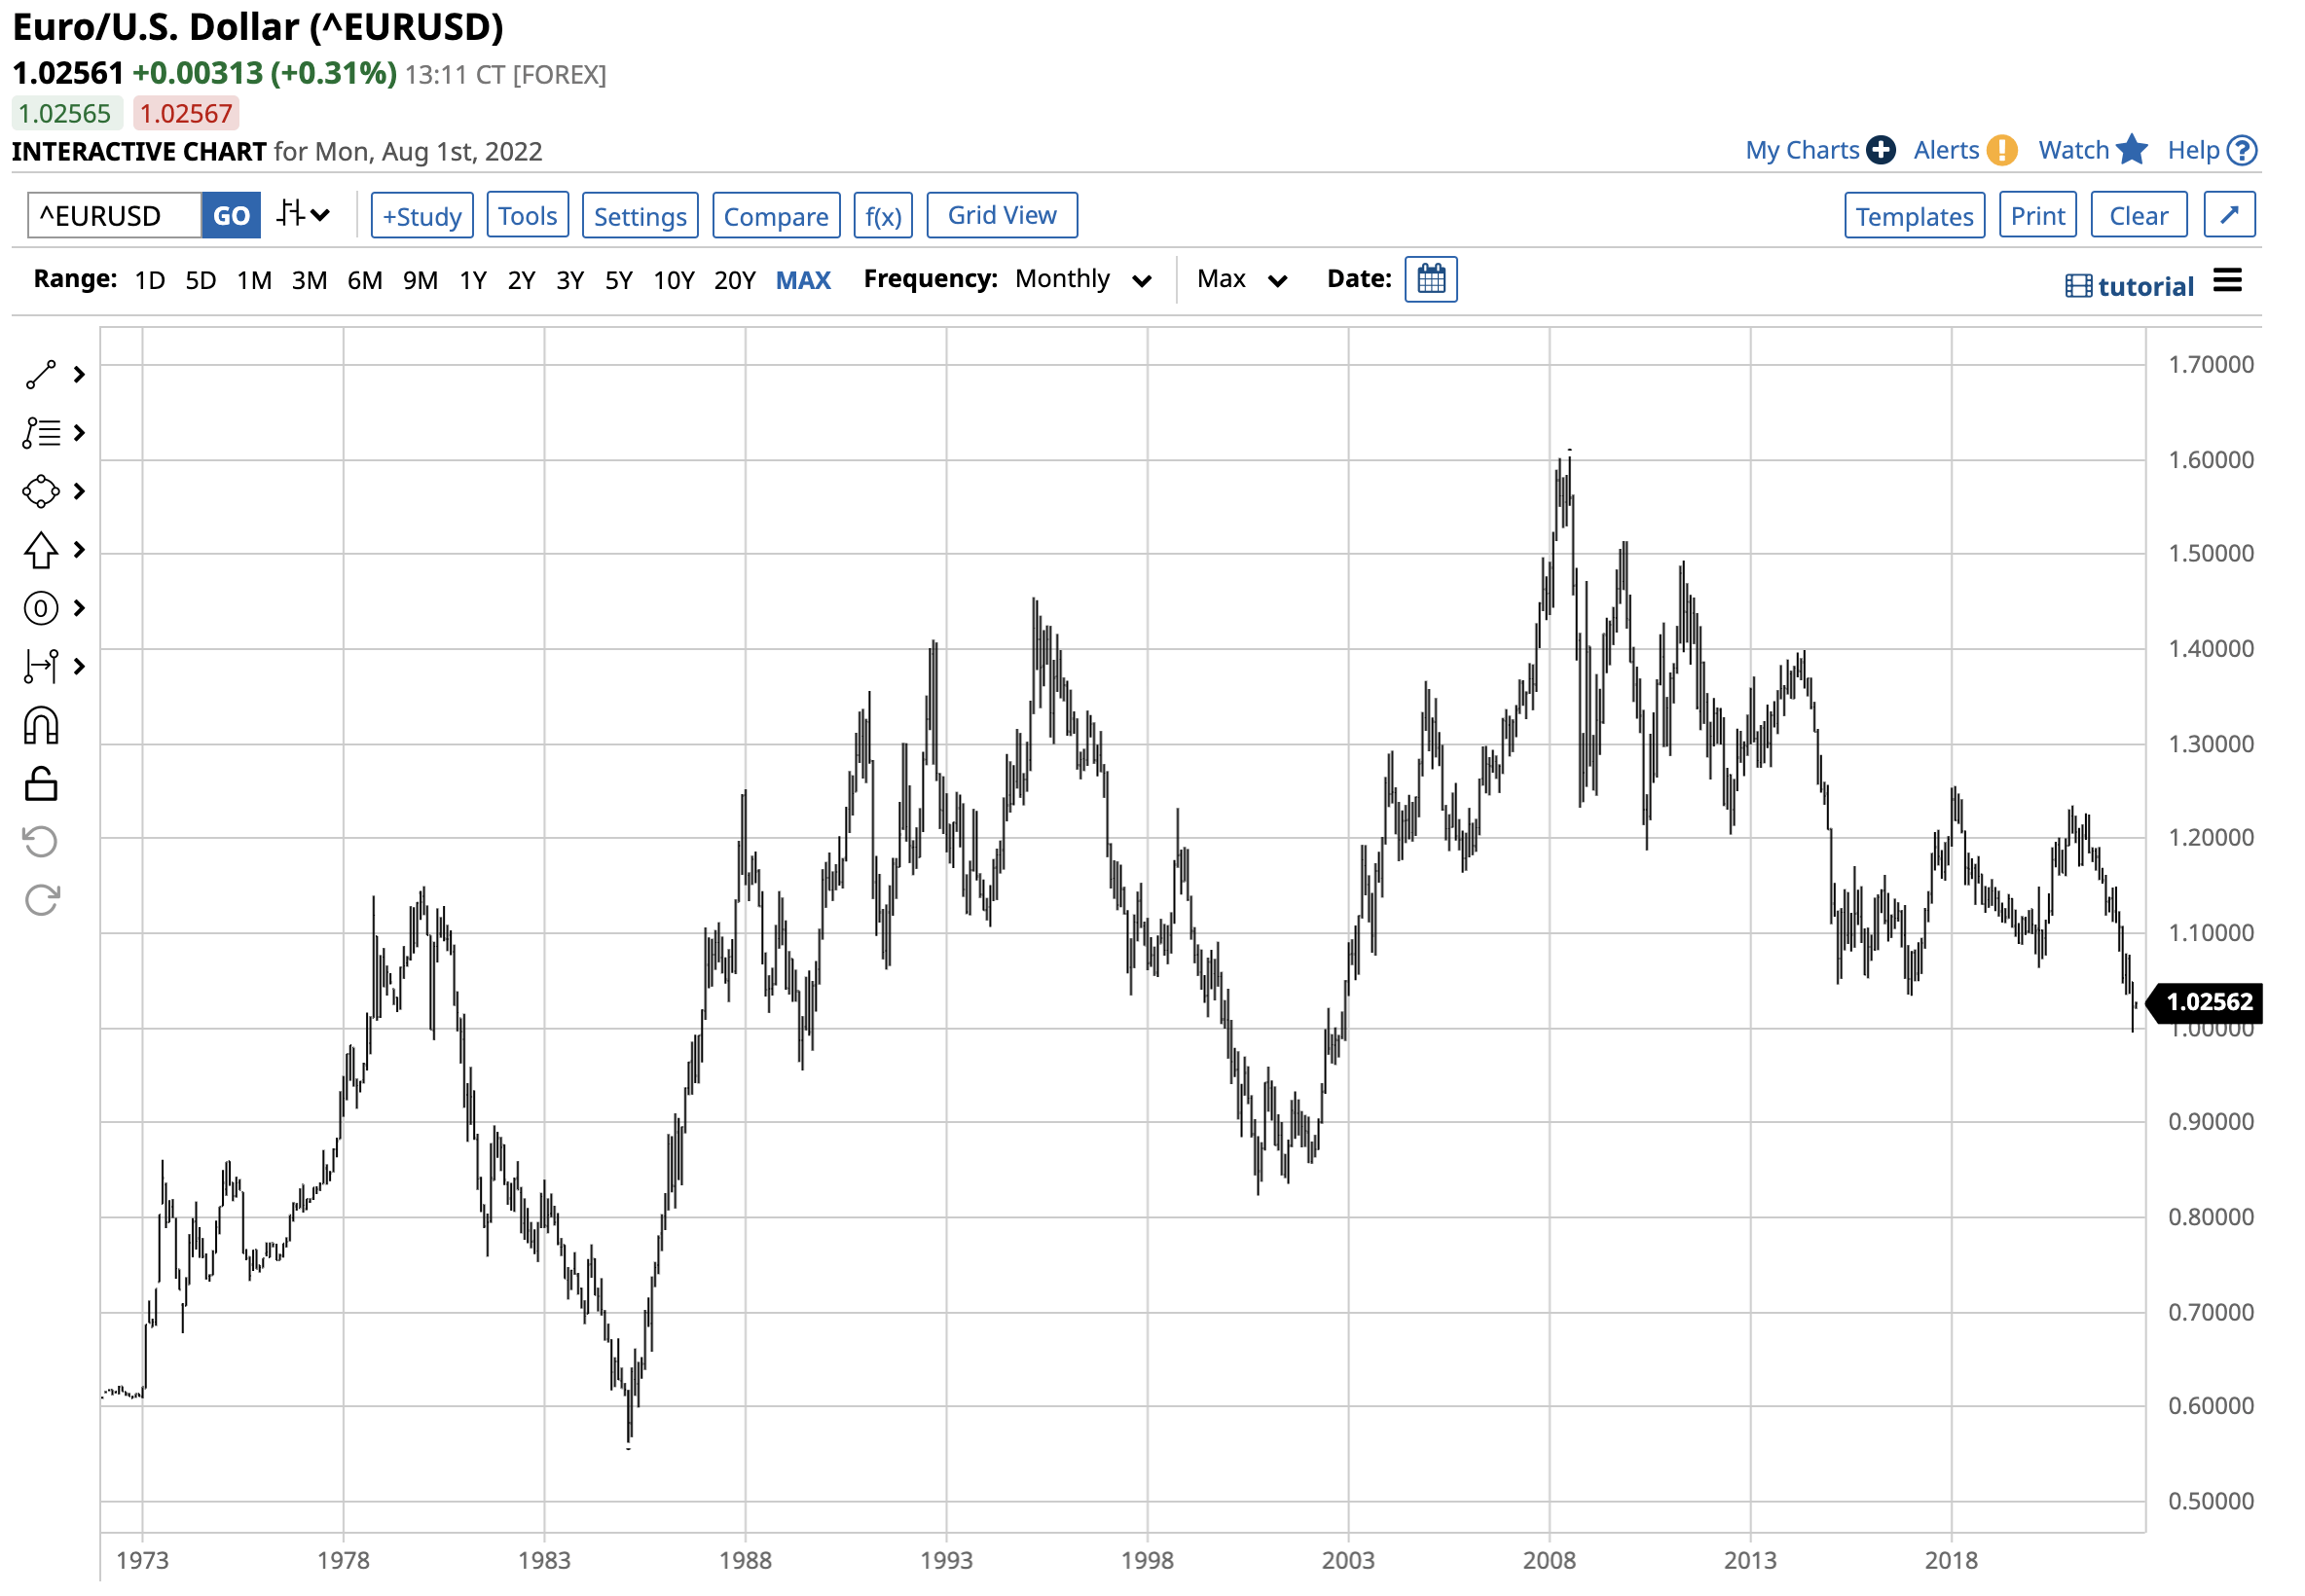
The chart of the euro versus the U.S. dollar currency relationship highlights the decline in the euro that took the European currency to the lowest level since 2002. The euro briefly probed below parity against the dollar in July. Since the euro accounts for over 50% of the dollar index, it soared above the 109 level.
Inflation and recession are challenging
The U.S. June consumer and producer price indices rose by 9.1% and 11.3%, respectively. The inflation indicators rose to a more than four-decade high. Inflation has caused the Fed to follow a hawkish path with a pair of 75 basis point hikes in the short-term Fed Fund rate in June and July. After the latest meeting, the rate sits at the 2.25% to 2.50% level, with most analysts looking for a rise to at least 3% by the end of 2022.
Meanwhile, Q2 U.S. gross domestic product declined by 0.90%, marking the second consecutive quarterly decline, after falling 1.6% in Q1 this year. The textbook definition of a recession is two successive quarters of GDP declines.
The Federal Reserve’s dual mandate is price stability and maximum sustainable employment. When it comes to jobs, a recession threatens sustainability as companies trim expenses to weather a downturn in the economy.
Rising interest rates to battle inflation are not necessarily compatible with addressing recessionary pressures, creating a challenge for the central bank over the coming months.
Procrastination in 2021 and again in 2022
The Fed fell far behind the inflationary curve in 2021 when the central bank and administration attributed rising prices to pandemic-related supply chain bottlenecks. After months of calling inflationary pressures “transitory,” the ascent of CPI and PPI data caused an epiphany that led to the current hawkish monetary policy approach. The central bank and administration adopted addressing inflation as the number one goal in 2022. After falling asleep at the inflationary wheel in 2021, it now looks like Washington D.C. is making the same mistake regarding data pointing to economic contraction.
Over the past weeks, the Fed and administration have denied that the economy is in recession. Some administration officials have gone as far as calling the current economic contraction a “transition” instead of a recession. In 2021, they blamed pandemic-related factors. In 2022, the excuse has become Russia’s war in Ukraine.
If they are making the same mistake as last year, it may not be long before the Fed awakens and decides to slow the aggressive approach to increasing interest rates to stem economic contraction. The market’s reaction to the latest GDP data suggests that the trajectory of interest rate hikes is likely to slow over the coming months. The days of 75 basis point increases could be over after the July FOMC meeting. After the June meeting, the stock market rallied, gold and cryptocurrencies moved to the upside, and the dollar index corrected.
Short-Term trend in the US Dollar Index Futures Contract (Barchart)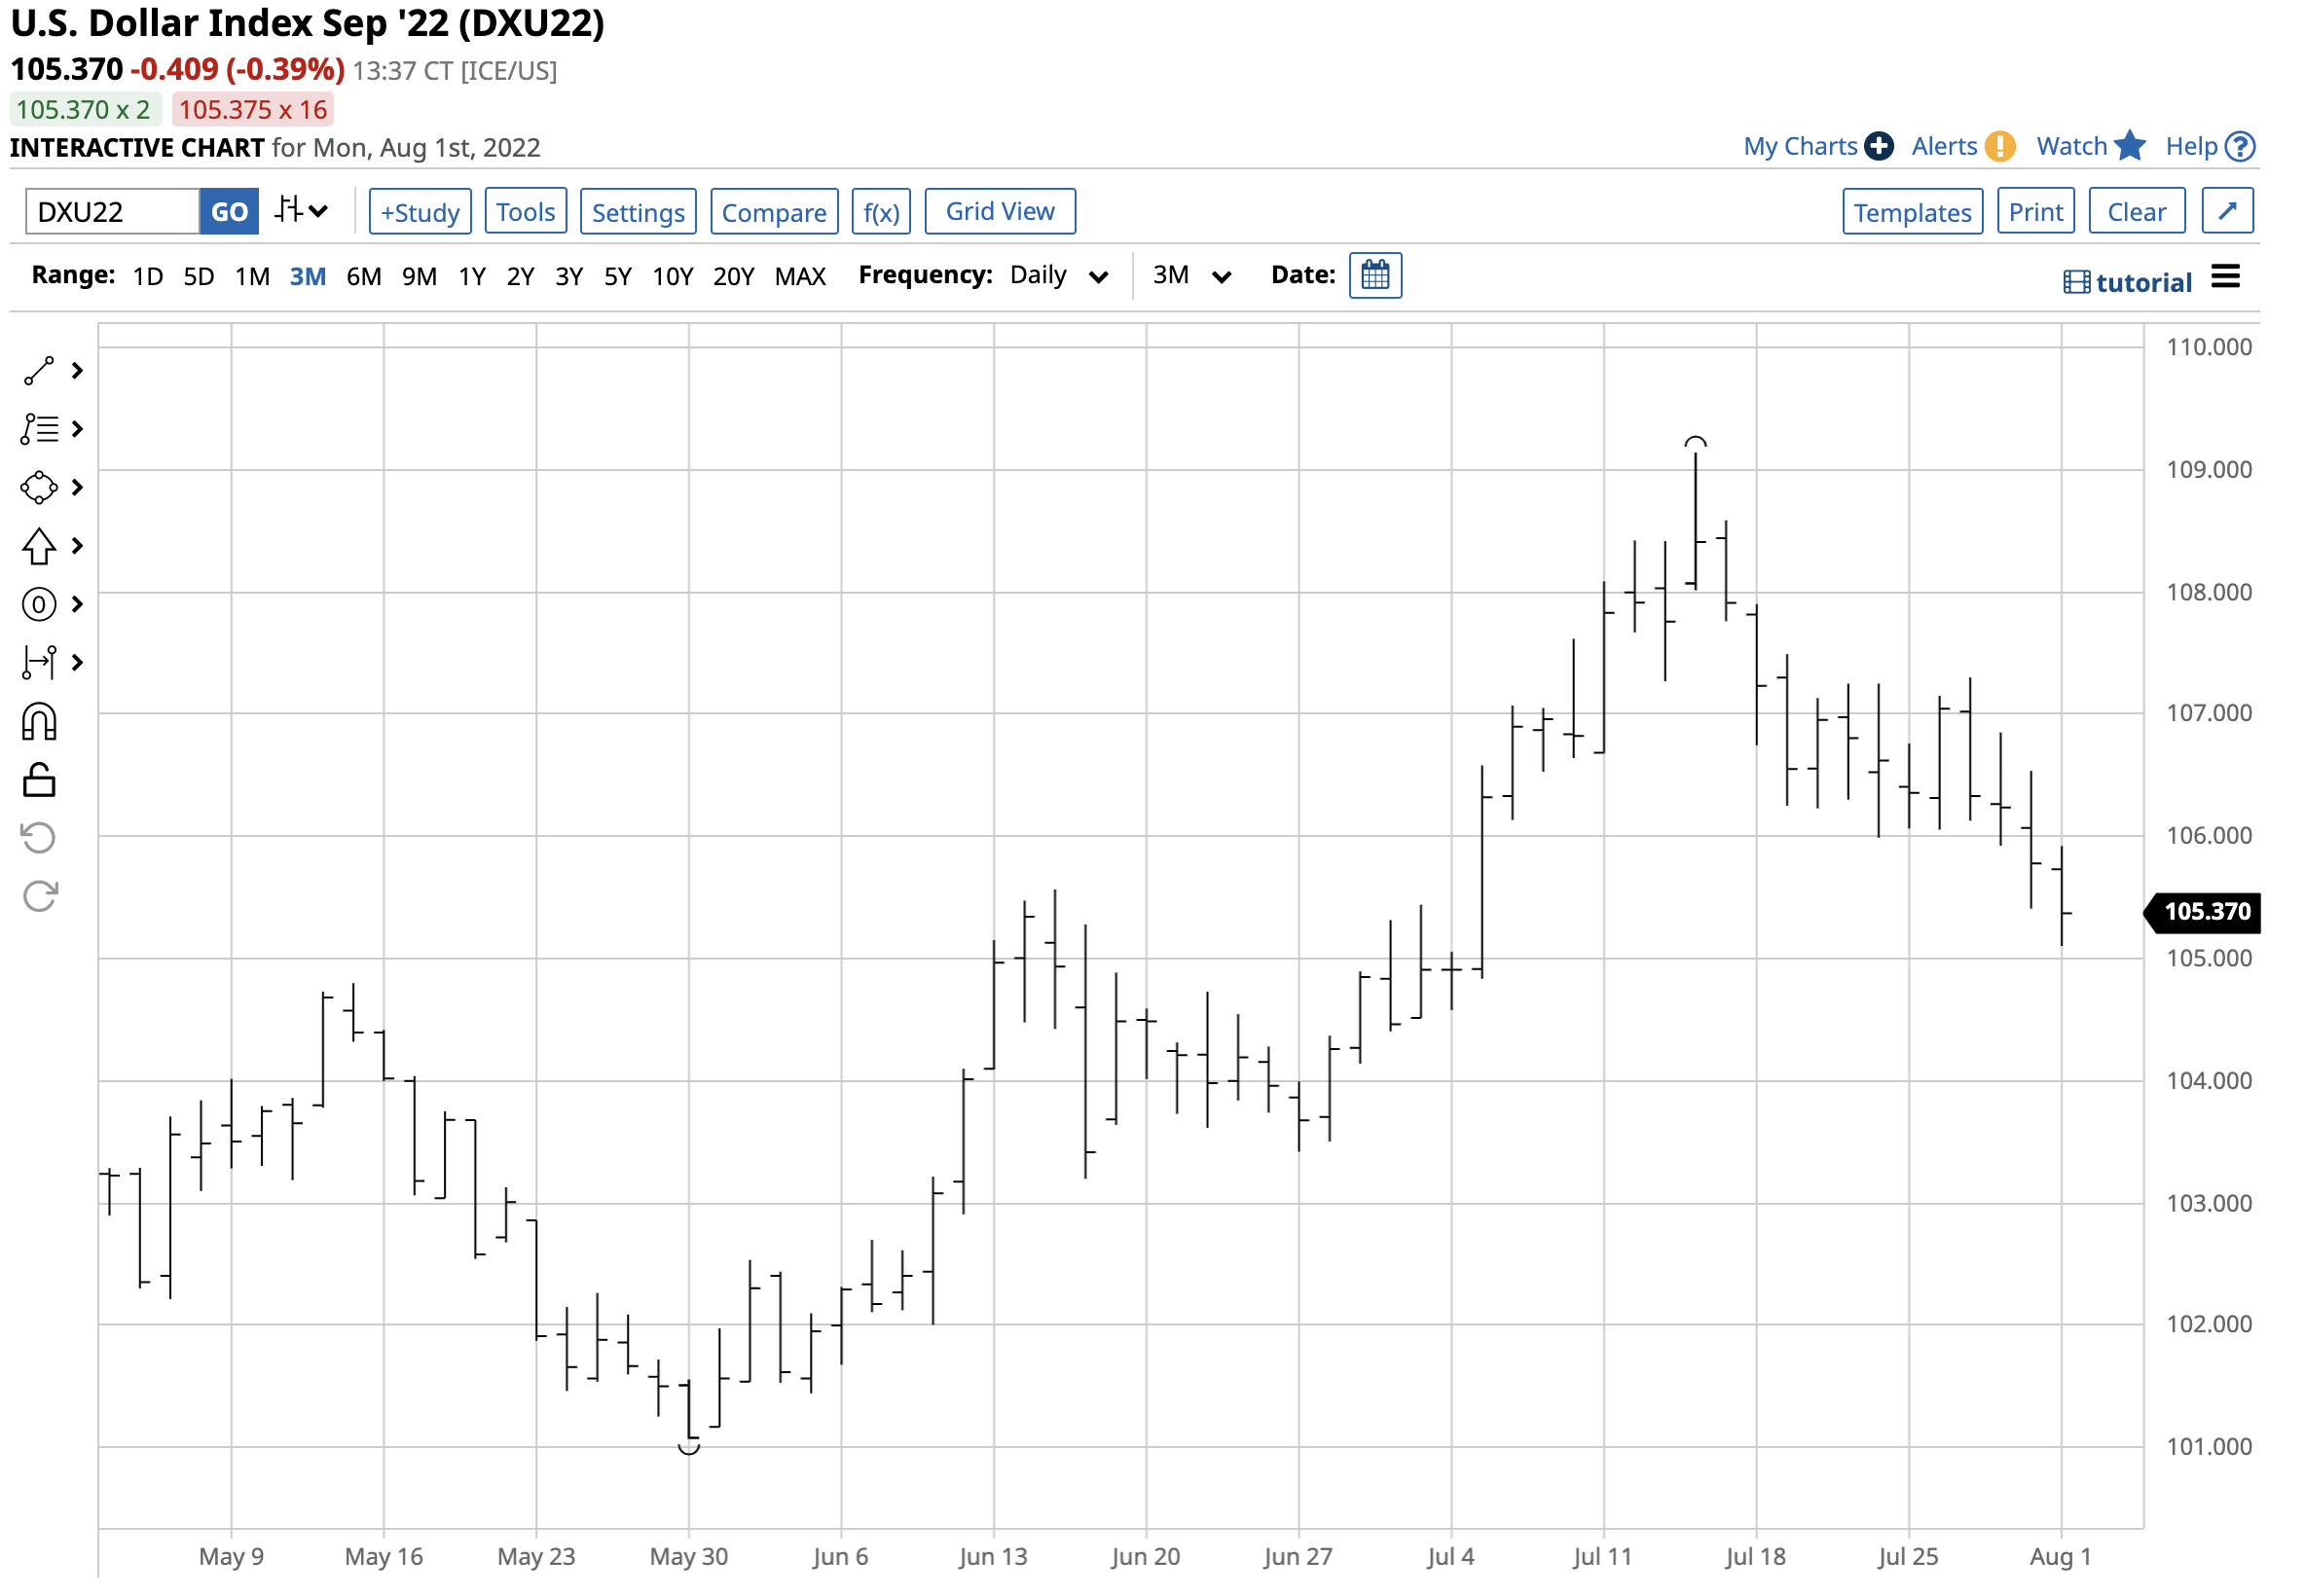
The chart shows the descent of the dollar index from the July 14 high. Over the past weeks, the index has made lower highs and lower lows, falling below the 105.50 level on August 1. At 105.375, the dollar index corrected by 3.5%.
The UDN will move higher as the dollar index corrects
The move in the dollar index and other markets suggests that the Fed will slow the trajectory of rate hikes over the coming months to address recessionary pressures. The trend in any market is always your best friend until it bends, and it appears to have done that in the U.S. dollar index since mid-July.
The most direct route for a risk position in the dollar index is via the futures and futures options on the Intercontinental Exchange. If the dollar index continues to decline, the optimal approach is a short position. The Invesco DB US Dollar Index Bearish Fund provides an alternative to a short position in the futures arena, as UDN moves higher when the dollar index declines. The index has fallen 3.5% since the June 14 peak.
Short-Term Chart in the UDN Product (Barchart)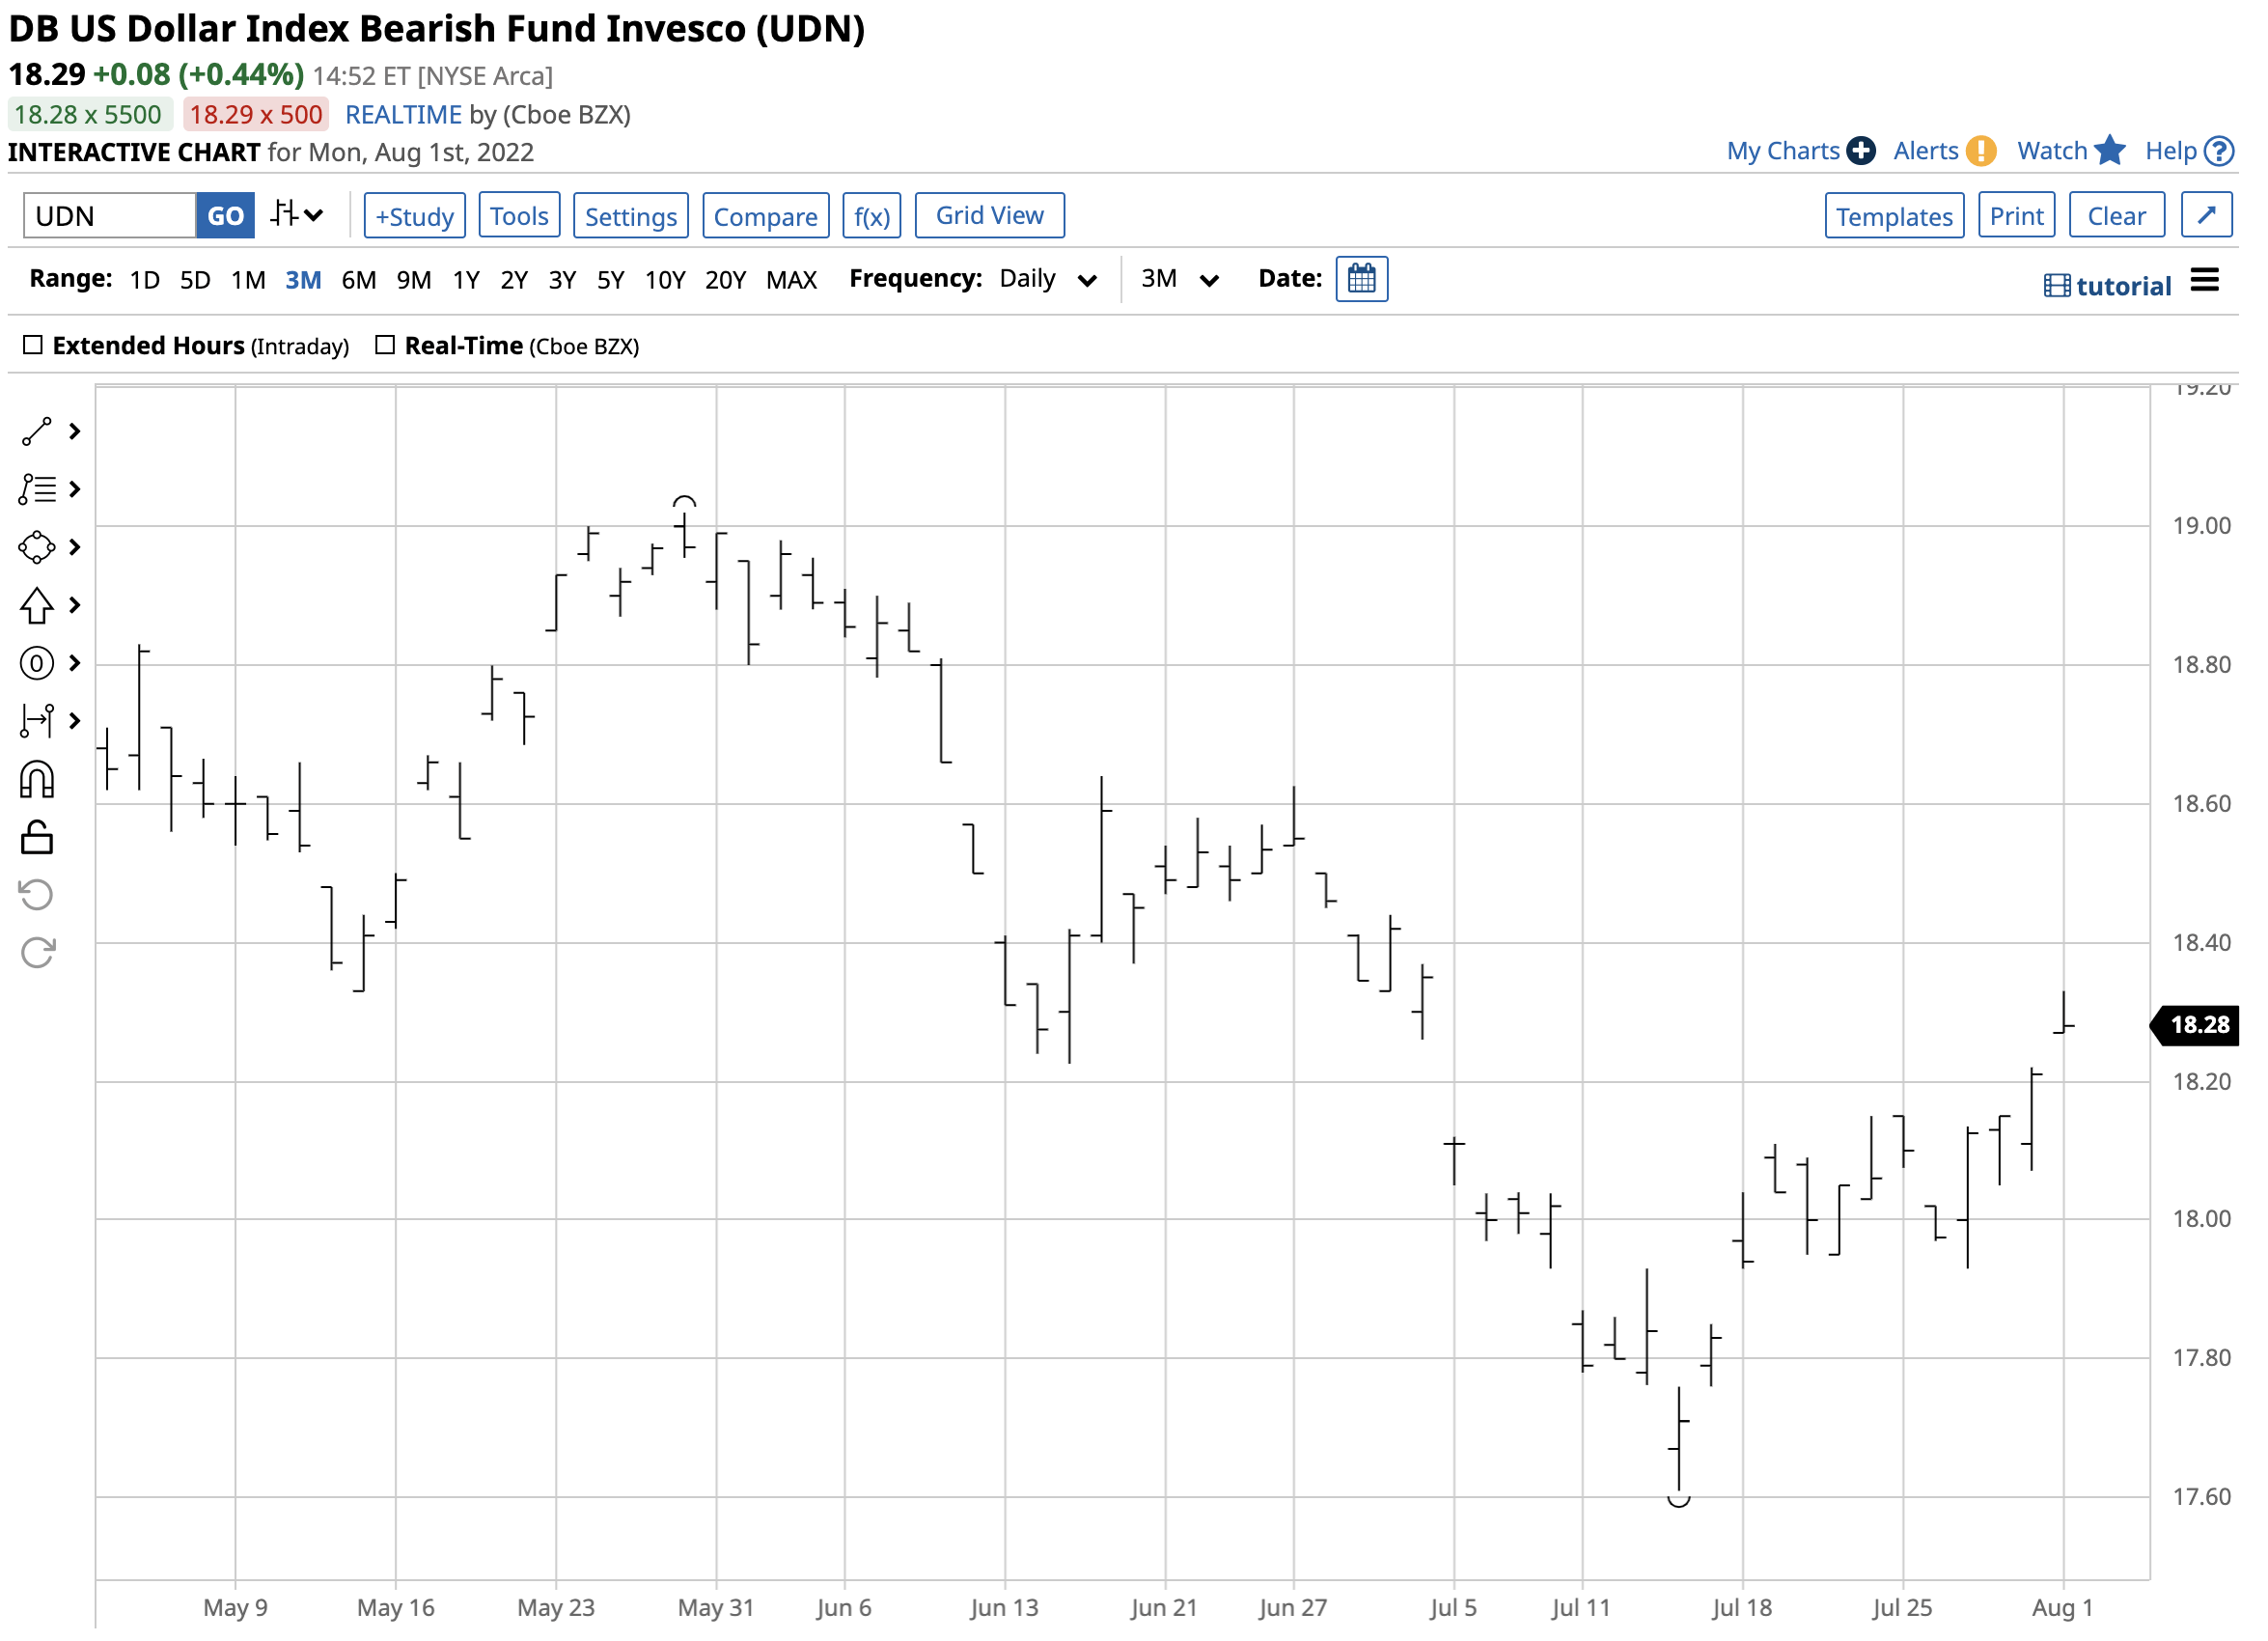
The chart highlights the rise in the UDN product from $17.61 on July 14 to the $18.29 per share level on August 1, a 3.86% increase. At the $18.29 level, UDN had $74.638 million in assets under management and trades an average of 193,278 shares daily. The product charges a 0.77% management fee. If the trend has turned lower in the dollar index, the UDN product could be the optimal approach to the index. When the trend turns higher again, the converse UUP product provides upside exposure to the dollar index.
Be the first to comment