

stanciuc/iStock via Getty Images
By Albert Durso, senior RMBS and CMBS strategist, Yield Book
The U.S. MBS agency market had another bounce-back outing in July, alternating good and bad months since the start of 2022. This time, however, the sector employed a slightly different formula owing to the preponderance of lower and discounted coupons that still dominate MBS market share.
For the month, the MBS index gained +183bps versus the riskless Treasury index, and +121bps spread advantage. The main stack gainers were lower 30yr 1.5%s through 3.5%s, with belly 4%s about flat, and fuller 4.5%s and above losing the most as rates rallies run contrary to shorter duration premiums.
Author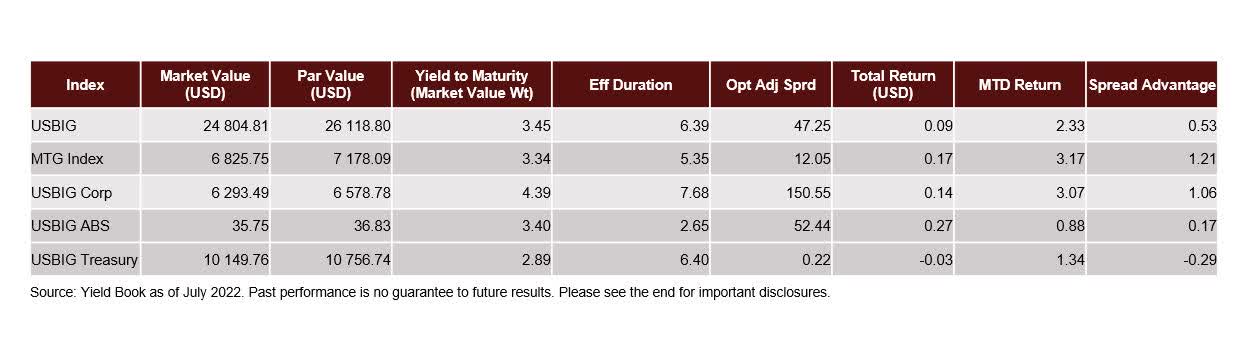
The macro backdrop revealed that the 2s/10s curve inverted -28.20 bps, 10yr notes ultimately flattened 23.5bps net (to 2.65%), with 3m10y vols easing 7.1bps to 110.5. The Federal Reserve meeting at month’s end saw another +75bps move higher on interest rates with more forecast into year-end.
Author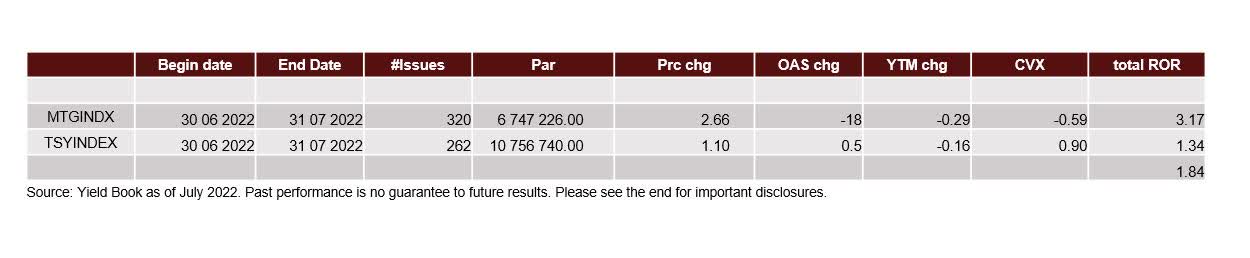
Flows on the month had supply lower at $2.7b per day, with rates rallies mixed in serving to sporadically spike totals above that. Most borrowers are well out of money and originations have receded against the backdrop of higher lending rates and a somewhat peaked housing market.
Fed buying has reset to $600mm per day via the most recent MBS Ops schedules ($6B bi-weekly), while the outperformance of the stack was fueled by money managers buying lower 2%s through 3.5%s. A flattening yield curve necessitated those duration grabs. Real money accounts require a somewhat calmer setting (less volatility), and Asian investors (longtime supporters of GNMAs) are quiet as the U.S. dollar continues to trounce all other currencies.
Dollar Roll star performer this past month was no doubt the G2 5.5% roll (Jul/Aug) soaring to +30/32nds on 48hr day, lowering financing (sellers of the roll) to an incredible -706 basis points! This definitively underscored the lack of front month MBS production in higher coupons and the plight of sellers to navigate actual delivery against their short positions.
For the month of July, the current coupon (par based) fell -55.2 basis points to 3.79% as rates rallies continue to be fueled by recession fears and curve inversions supporting those worries. Spreads firmed across the board, feasting on prior month wides as we see-saw month to month. OAS measures narrowed -24.2bps, ZV spreads -29.2bps and 5&10yr tsy blend comparisons -23.7bps.
Author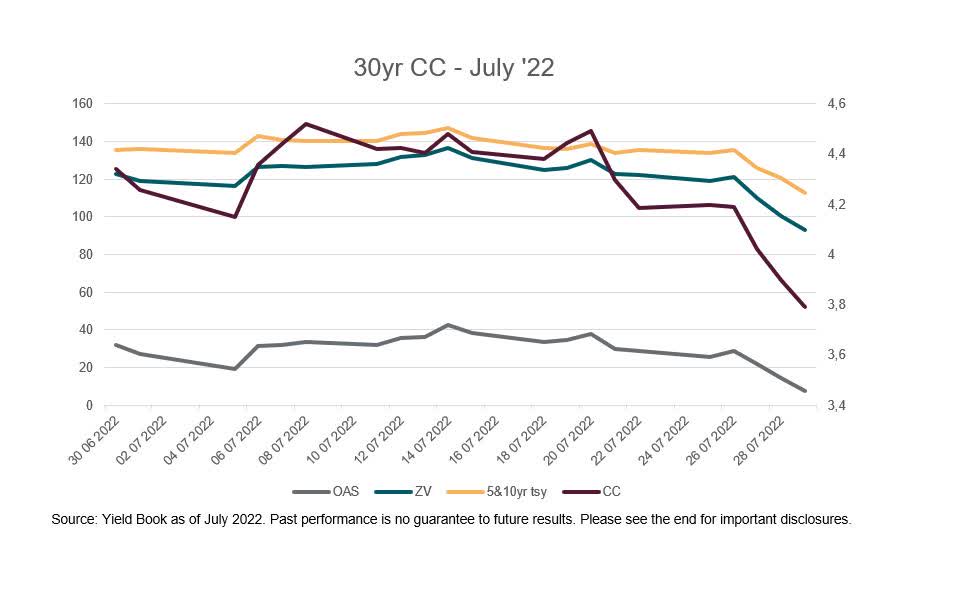
Year to date, spreads are wider and the coupon higher in reflection of the general tone of inflation and Fed interest rates move; from the chart below; Current coupon +174bps, OAS +21.2bps, ZV +43bps, and 5&10yr blend comparisons +45.2bps.
Author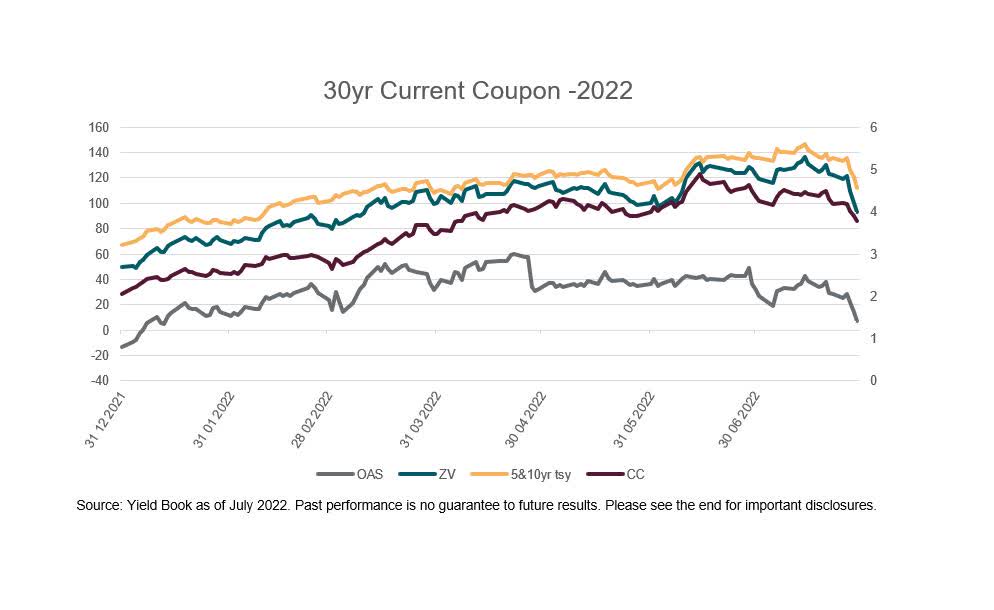
Year over year (July 21 to July 22), the picture is even more dramatic as you can see rates had ground at or near all-time lows and spreads ultimately reversed course after a feeding frenzy had left little to the investor in a competition for investment dollars last summer.
Author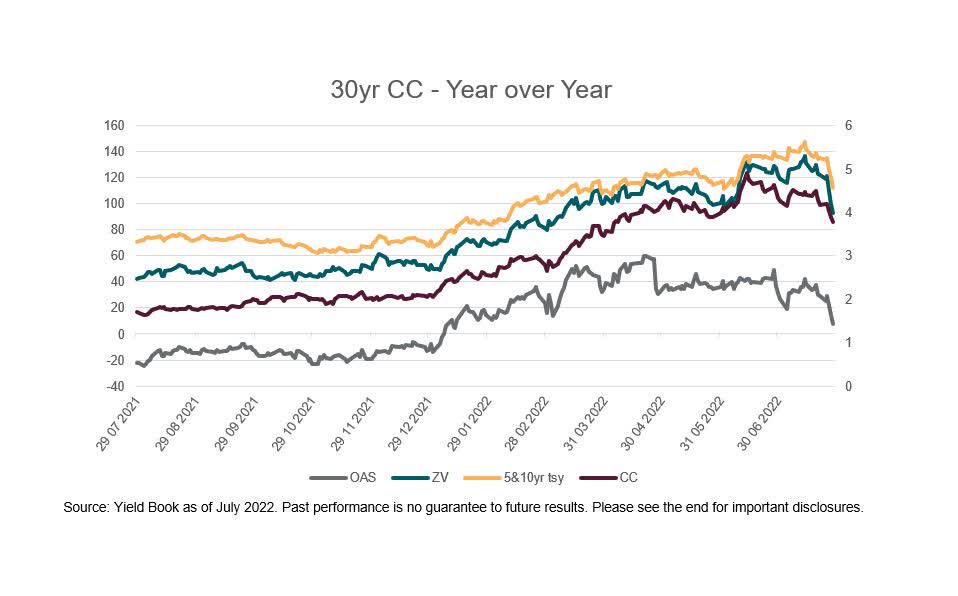
In a nod to this month’s duration plays, we refocus our attention to the bulk of the MBS complex (30yr 2%s, 2.5%s), while including fuller and more current 4.5%s too. Below is the table of UMBS TBA coupons and their response to a curve shift in 100bps intervals.
Author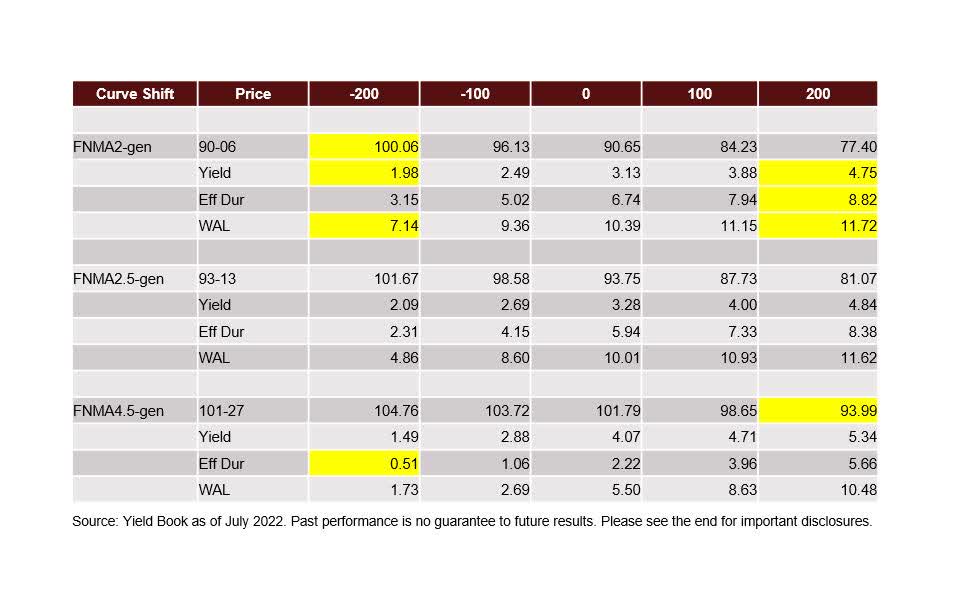
In both scenarios (+/- 200bps), UMBS/FNMA 2%s fare the best, keeping a longer duration into any rally and not extending that much more into a sell-off. In addition to the outperformance, there are a plethora of bonds out there as a percentage of the tradeable float.
© 2022 London Stock Exchange Group plc and its applicable group undertakings (the “LSE Group”). The LSE Group includes (1) FTSE International Limited (“FTSE”), (2) Frank Russell Company (“Russell”), (3) FTSE Global Debt Capital Markets Inc. and FTSE Global Debt Capital Markets Limited (together, “FTSE Canada”), (4) FTSE Fixed Income Europe Limited (“FTSE FI Europe”), (5) FTSE Fixed Income LLC (“FTSE FI”), (6) The Yield Book Inc (“YB”) and (7) Beyond Ratings S.A.S. (“BR”). All rights reserved.
FTSE Russell® is a trading name of FTSE, Russell, FTSE Canada, FTSE FI, FTSE FI Europe, YB and BR. “FTSE®”, “Russell®”, “FTSE Russell®”, “FTSE4Good®”, “ICB®”, “The Yield Book®”, “Beyond Ratings®” and all other trademarks and service marks used herein (whether registered or unregistered) are trademarks and/or service marks owned or licensed by the applicable member of the LSE Group or their respective licensors and are owned, or used under licence, by FTSE, Russell, FTSE Canada, FTSE FI, FTSE FI Europe, YB or BR. FTSE International Limited is authorised and regulated by the Financial Conduct Authority as a benchmark administrator.
All information is provided for information purposes only. All information and data contained in this publication is obtained by the LSE Group, from sources believed by it to be accurate and reliable. Because of the possibility of human and mechanical error as well as other factors, however, such information and data is provided “as is” without warranty of any kind. No member of the LSE Group nor their respective directors, officers, employees, partners or licensors make any claim, prediction, warranty or representation whatsoever, expressly or impliedly, either as to the accuracy, timeliness, completeness, merchantability of any information or of results to be obtained from the use of FTSE Russell products, including but not limited to indexes, data and analytics, or the fitness or suitability of the FTSE Russell products for any particular purpose to which they might be put. Any representation of historical data accessible through FTSE Russell products is provided for information purposes only and is not a reliable indicator of future performance.
No responsibility or liability can be accepted by any member of the LSE Group nor their respective directors, officers, employees, partners or licensors for (A) any loss or damage in whole or in part caused by, resulting from, or relating to any error (negligent or otherwise) or other circumstance involved in procuring, collecting, compiling, interpreting, analysing, editing, transcribing, transmitting, communicating or delivering any such information or data or from use of this document or links to this document or (B) any direct, indirect, special, consequential or incidental damages whatsoever, even if any member of the LSE Group is advised in advance of the possibility of such damages, resulting from the use of, or inability to use, such information.
No member of the LSE Group nor their respective directors, officers, employees, partners or licensors provide investment advice and nothing in this document should be taken as constituting financial or investment advice. No member of the LSE Group nor their respective directors, officers, employees, partners or licensors make any representation regarding the advisability of investing in any asset or whether such investment creates any legal or compliance risks for the investor. A decision to invest in any such asset should not be made in reliance on any information herein. Indexes cannot be invested in directly. Inclusion of an asset in an index is not a recommendation to buy, sell or hold that asset nor confirmation that any particular investor may lawfully buy, sell or hold the asset or an index containing the asset. The general information contained in this publication should not be acted upon without obtaining specific legal, tax, and investment advice from a licensed professional.
Past performance is no guarantee of future results. Charts and graphs are provided for illustrative purposes only. Index returns shown may not represent the results of the actual trading of investable assets. Certain returns shown may reflect back-tested performance. All performance presented prior to the index inception date is back-tested performance. Back-tested performance is not actual performance but is hypothetical. The back-test calculations are based on the same methodology that was in effect when the index was officially launched. However, back-tested data may reflect the application of the index methodology with the benefit of hindsight, and the historic calculations of an index may change from month to month based on revisions to the underlying economic data used in the calculation of the index.
This document may contain forward-looking assessments. These are based upon a number of assumptions concerning future conditions that ultimately may prove to be inaccurate. Such forward-looking assessments are subject to risks and uncertainties and may be affected by various factors that may cause actual results to differ materially. No member of the LSE Group nor their licensors assume any duty to and do not undertake to update forward-looking assessments.
No part of this information may be reproduced, stored in a retrieval system or transmitted in any form or by any means, electronic, mechanical, photocopying, recording or otherwise, without prior written permission of the applicable member of the LSE Group. Use and distribution of the LSE Group data requires a licence from FTSE, Russell, FTSE Canada, FTSE FI, FTSE FI Europe, YB, BR and/or their respective licensors.
Editor’s Note: The summary bullets for this article were chosen by Seeking Alpha editors.
Be the first to comment