

Ibrahim Akcengiz
In this post I’ll offer up charts on our U.S. stock portfolio and the Canadian stock portfolio. And I’ll put them together so that we can see how they work together. The total portfolio was designed to be retirement-ready. The fact that it beats the market benchmarks is a welcome surprise. At the core of the portfolio is wonderful Canadian dividend payers – the U.S. dividend achievers and 3 picks fill in some portfolio holes. We will also take a look at how these stocks can be arranged to provide an all-weather stock portfolio base.
When I write ‘our portfolio’, I am referring to the retirement portfolios for my wife and me. As for ‘backgrounders’ on the portfolios please have a read of our U.S. stock portfolio and the Canadian Wide Moat 7 performance update.
The stock portfolios
In early 2015 I skimmed 15 of the largest cap dividend achievers. What does skim mean? After extensive research into the portfolio “idea” I simply bought 15 of the largest cap dividend achievers. For more info on the index, have a look at the U.S. Dividend Appreciation Index ETF (VIG) from Vanguard.
At the core is a meaningful dividend growth history (10 years or more) working in concert with financial health screens. It leads to a high quality skew. Given those parameters the dividend achievers index will certainly hold many dividend aristocrats (NOBL).
The 15 companies that I purchased in early 2015 are 3M (MMM), PepsiCo (PEP), CVS Health Corporation (CVS), Walmart (WMT), Johnson & Johnson (JNJ), Qualcomm (QCOM), United Technologies, Lowe’s (LOW), Walgreens Boots Alliance (WBA), Medtronic (MDT), Nike (NKE), Abbott Labs (ABT), Colgate-Palmolive (CL), Texas Instruments (TXN) and Microsoft (MSFT).
United Technologies merged with Raytheon (RTX) and then spun off Carrier Global Corporation (CARR) and Otis Worldwide (OTIS). We continue to hold all three and they have been wonderful additions to the portfolio. Given that those stocks are not available for the full period, they are not a part of this evaluation. That said, the United Technologies spins off added to the outperformance.
Previous to 2015 we had three picks by way of Apple (AAPL), BlackRock (BLK) and Berkshire Hathaway (BRK.B). Those stocks are overweighted in the portfolio. As you might expect, Apple has contributed greatly to the portfolio outperformance. Though the achievers also outperform the market with much less volatility.
In total it is a portfolio of 20 U.S. stocks.
The Canadians
I hold a concentrated portfolio of Canadian stocks. What I give up in greater diversification, I gain in the business strength and potential for the companies that I own to not fail. They have wide moats or exist in an oligopoly situation. For the majority of the Canadian component of my RRSP account I own 7 companies in the banking, telco and pipeline space. I like to call it the Canadian wide moat portfolio. They also provide very generous and growing dividends. These days, they’d combine to offer a starting yield in the 6% range.
Here are the stocks.
Canadian banking
Royal Bank of Canada (RY), Toronto-Dominion Bank (TD) and Scotiabank (BNS).
Telco space
Bell Canada (BCE) and Telus (TU).
Pipelines
Canada’s two big pipelines are Enbridge (ENB) and TC Energy (TRP).
The Canadian mix outperforms the market, the TSX Composite. You’ll also find that outperformance in the Beat The TSX Portfolio. That strategy (like the Wide Moat 7) finds big dividends, strong profitability and value.
Once again, my wife holds an ETF – the Vanguard High Dividend (VDY.CA). I did not want to expose her portfolio to concentration risk.
The charts
Here’s the returns of the U.S. and Canadian portfolios, plus a 50/50 U.S/CAD mix as the total portfolio. The period is January of 2015 to end of September 2022.
U.S. and Canadian stock portfolio (Author / Portfolio Visualizer )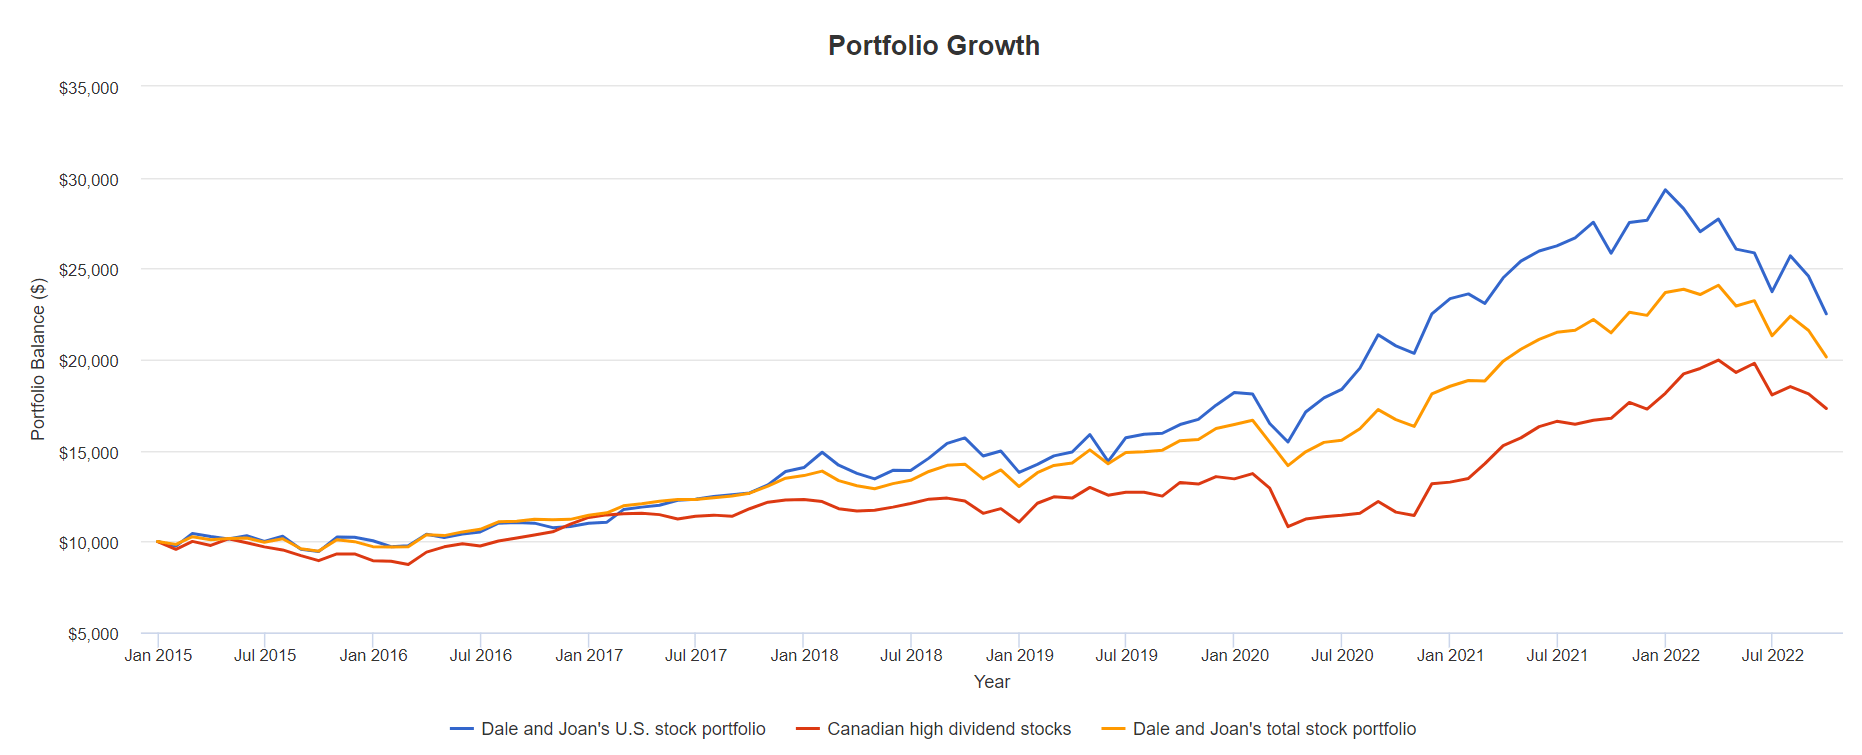
The Vanguard High Dividend ETF is used as the Canadian benchmark. The returns of the Canadian Wide Moat 7 performed in line with that benchmark.
- U.S. stocks (S&P 500) delivered 9.33% annual.
- Canadian stocks (TSX Composite) offered 6.12% annual.
We see outperformance for Joan and Dale’s U.S. and Canadian portfolios, of 1.71% annual for U.S stocks, and 1.21% annual for Canadian stocks.
Annualized returns for U.S. and Canadian stocks (Author / Portfolio Visualizer )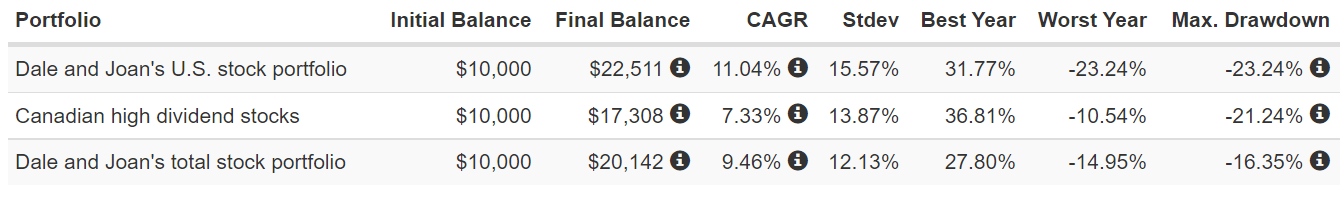
The energy add-on
Our performance has received an additional boost over the last years and more as we are investing in Canadian oil and gas stocks at a 10% weighting. That is not shown on the above chart and table.
Energy stocks have delivered over 115% over the last two years (to October 2022), and 54% over the last year. As planned, they have been a wonderful inflation hedge. The energy add on, along with a modest amount of commodities (DBC), are part of the all-weather stock portfolio strategy. The pipelines (midstream) can also boost the inflation hedge.
Stocks with bond-like performance
The idea for the portfolio was not to outperform stock markets. Being that I am in semi-retirement, and my wife will retire within 3-5 years, the goal was to hold a stock portfolio that performs well, but offers less volatility and lesser drawdowns in market corrections. Mission accomplished on that front.
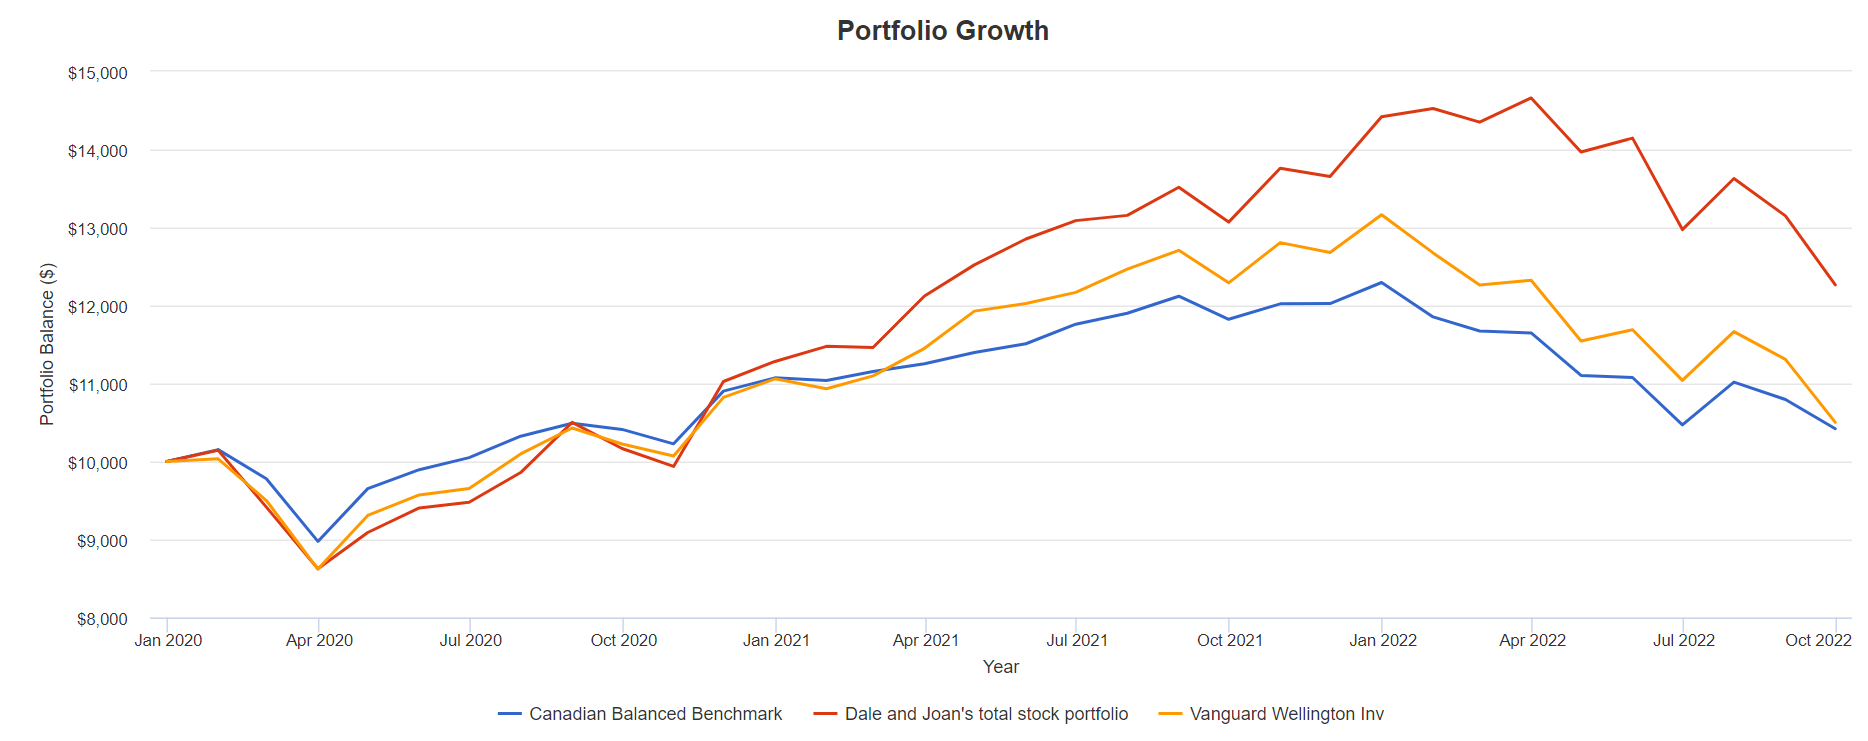
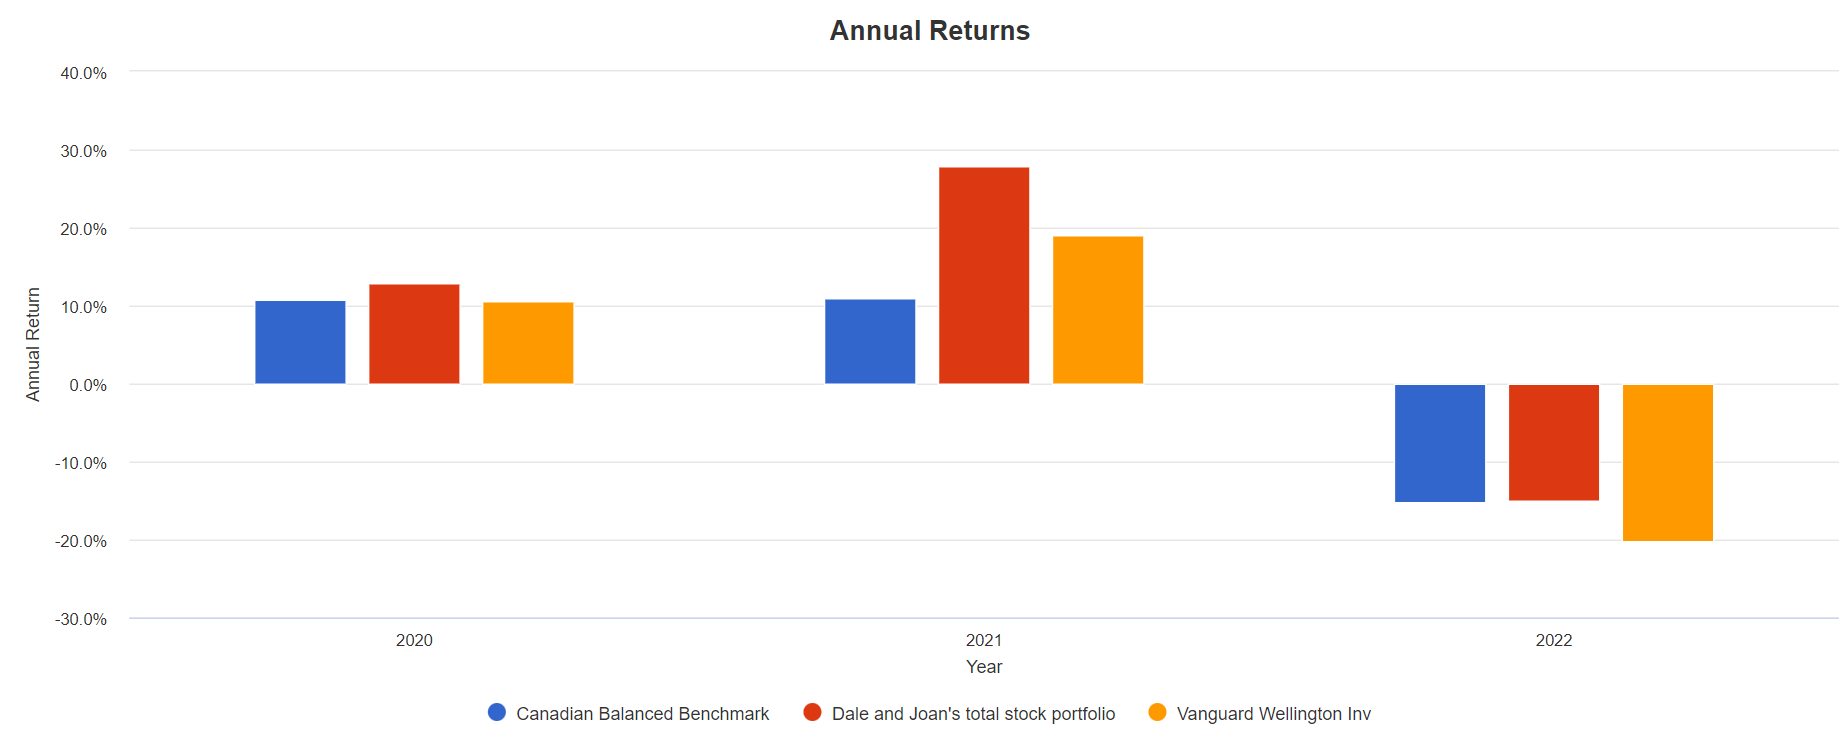
The portfolio has outperformed the Vanguard Wellington Balanced Fund (VWELX) with lesser drawdowns. The Wellington Fund is 65% stocks and 35% bonds.
Joan and Dale’s portfolio vs Wellington (Author / Portfolio Visualizer )
In the recent correction the Wellington fund is down 20.22% to the end of September 2022, our stock portfolio is down 16.35%.
It was mostly smooth sailing for most investors from 2009 through 2019. The portfolio was not challenged until 2020 when the first modern-day pandemic arrived. And then, the largesse of too much stimulus and rates held too low for too long created the stagflation troubles of the day.
It’s not a given, but a recession is likely on the way in the U.S., Canada and in many nations around the world. In recent decades Canada has been close behind when the U.S. enters a recession.
Given that the portfolio was designed to weather stress, let’s have a look at the stock portfolio vs balanced benchmarks from 2020. For the Canadian benchmark I used iShares asset allocation ETF (VBAL.CA). And again, keep in mind that our returns are boosted by the oil and gas exposure, not reflected in the charts and tables below.
Our stock portfolio vs balanced benchmarks (Author / Portfolio Visualizer ) Chart – Our stock portfolio vs balanced benchmarks (Author / Portfolio Visualizer) Our stock portfolio vs benchmarks by year (Author / Portfolio Visualizer )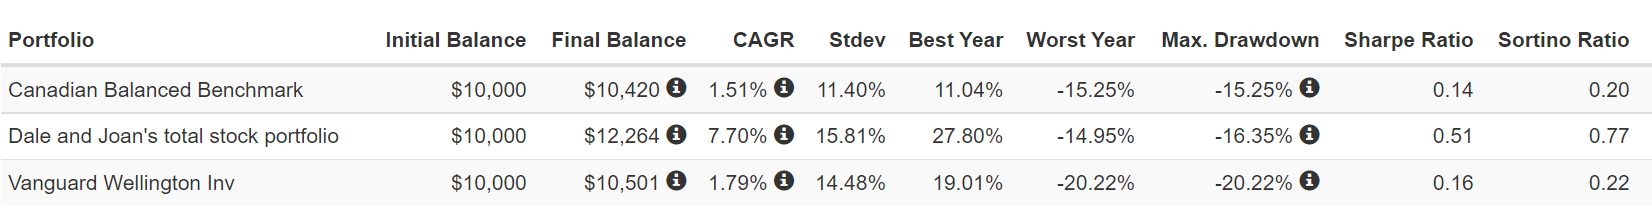
Is the Balanced Portfolio dead?
Many have proclaimed the end of the classic 60/40 balanced portfolio. I’m not sure that’s the case. But an investor can certainly do better by strategically selecting types of stocks to do the heavy lifting traditionally left to bonds.
We also hold a modest allocation to bonds. Think of it as a double-reinforced front line combining the defensive stocks and the strength of bonds (long and short).
On the Canadian front, the telcos and pipelines are more defensive, though the pipelines are known to also provide an inflation hedge. The banks are certainly more cyclical, but historically they provide stable and mostly growing dividends. The banks have been paying dividends with regularity before Canada was Canada (1867).
In the U.S., the consumer staples and healthcare stocks fill in the portfolio holes created by the limited sector coverage of the Canadian stocks. These stocks also build on to the defensive front line.
The defensive stocks within our portfolio are down “only” 8.8% in 2022 compared to 20.2% for the Wellington balanced Fund, while the S&P 500 (IVV) is down 23.95%. Bonds (AGG) are down 14.4%.
While many investors and retirees can take comfort in bonds and cash, I mostly receive a warm hug from the defensive stocks, and the generous and increasing dividend income generated by the portfolios.
That said, the prospects for bonds might be greatly improved in late 2022 and looking to 2023 and 2024. RIA recently offered that TINA might have to move over for BAAA – Bonds Are An Alternative. Bonds might be set to outperform U.S. stocks over the next decade.
The traditional balanced portfolio might make a comeback.
The sector performance
I will be back soon with another post on Seeking Alpha, looking at the sector performance of our U.S. and Canadian stock portfolio. I will compare our stocks to sector benchmarks. Are we coming up short in any areas? Stay tuned.
Thanks for reading.
And we’ll see you in the comment section. I make an effort to reply to all comments. How is your portfolio holding up in the new era of rising rates and economic regime change. Are you retirement-ready?
Be the first to comment