

RiverNorthPhotography
Introduction
Tyson Foods (NYSE:TSN) is one of the largest food producers and protein brands in the world. With many known brands like Tyson, Jimmy Dean, Ball Park, and Hillshire Farm, consumers across the US buy chicken breast to hotdogs in grocery stores each week. The food industry, especially protein production, ebbs and flows with the economy and environment, causing less than linear results for the business. For example, in the United States we currently have the worst avian flu ever seen, affecting chicken supply, demand, along with pricing and volumes. That is why it is important to look at the long-term trends and averages when investing in Tyson. If that is done, we can see the business has trended upward over the last decade and trades at a 12x P/E ratio.
Long-Term View & Financial History
Company As A Whole
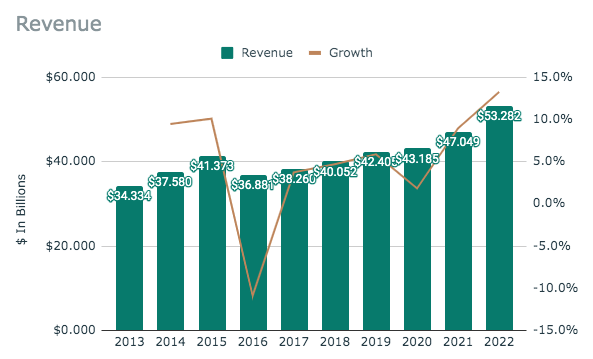
Tyson Foods Revenue (SEC.gov)
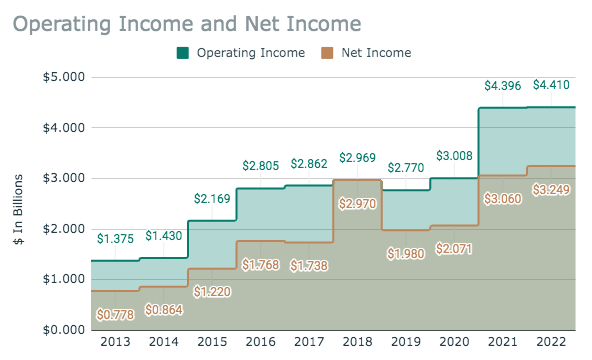
Tyson Foods Operating & Net Income (SEC.gov)
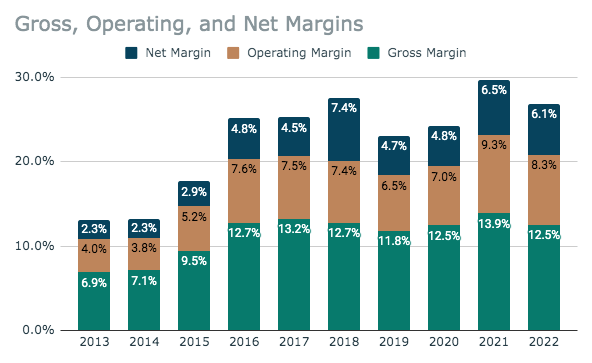
Tyson Foods Margins (SEC.gov)
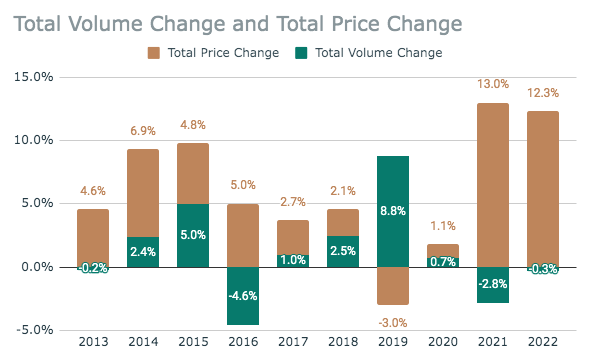
Tyson Foods Volume & Price Change Per Year (SEC.gov)
Tyson has always been a company at the whims of supply and demand. Many factors, environmental and economic, have a direct effect on the company’s business. Because of this, I believe it is important to look at a long period of the business’s results to get a clear picture. As can be seen above, Tyson has a history of an upward trajectory in revenue, but it is not consistent year to year. Over the last ten years, Tyson has seen revenue grow at a CAGR of 4.49%. The same trend follows along in the operating and net income too. Both have a general growth trend, but such growth is not consistent. Operating and net income have grown at rates of 12.36% and 15.37% each over the past decade.
The reason the results are so variant is due to the changing in prices and volumes each year. Any one year could produce a variant of different pricing and volume growth or decline. This, therefore, affects revenue, margins, operating, and net income. Overall though, Tyson is great at making sure the business post combined growth no matter what, even if it varies by double digits per year.
By Segment
Looking deeper into each segment shows this trend, and how one segment can see large swings year-to-year from environmental and economic challenges.
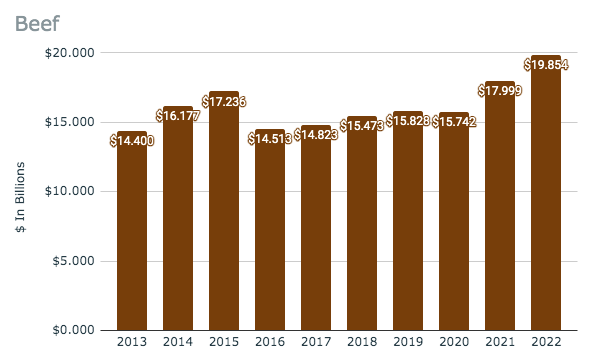
Tyson Beef Revenue (SEC.gov)
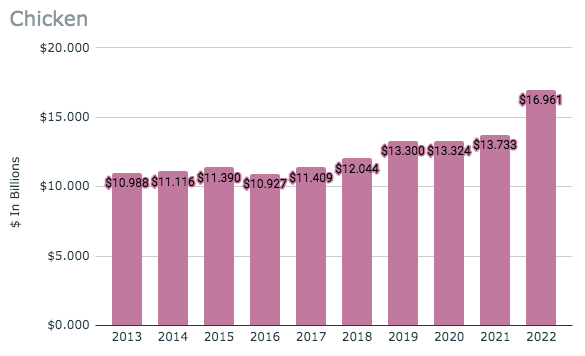
Tyson Chicken Revenue (SEC.gov)
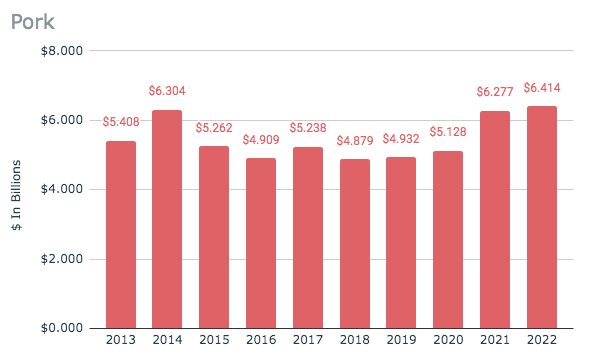
Tyson Pork Revenue (SEC.gov)
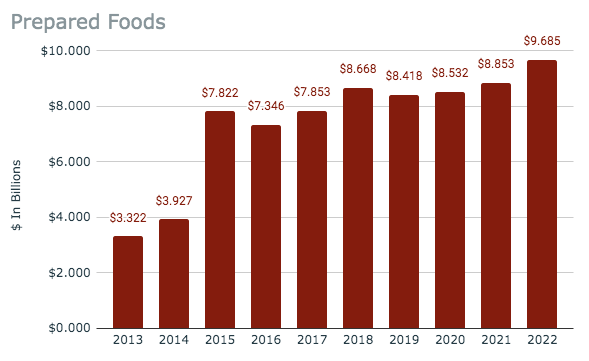
Tyson Prepared Foods Revenue (SEC.gov)
Looking at each segment’s revenues shows some of these swings. The Beef, Pork, and Prepared Foods segments seem to see much more variability in revenue over the past decade, while the Chicken segment shows much more consistency.
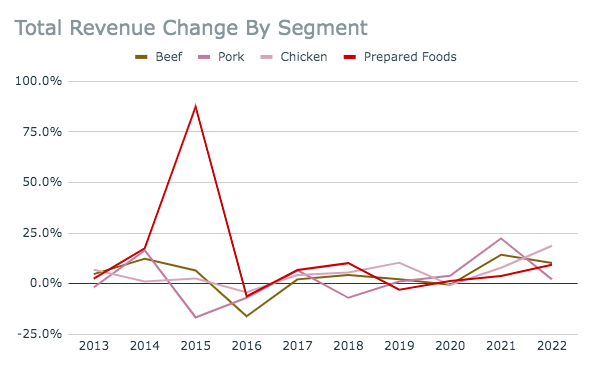
Tyson Foods Revenue Change Per Year By Segment (SEC.gov)
The graph above does a great job of showing the general trend but also the variance in each segment’s revenue growth or decline each year. What is evident is that large gains or losses are very common, but over time low growth is the tendency.
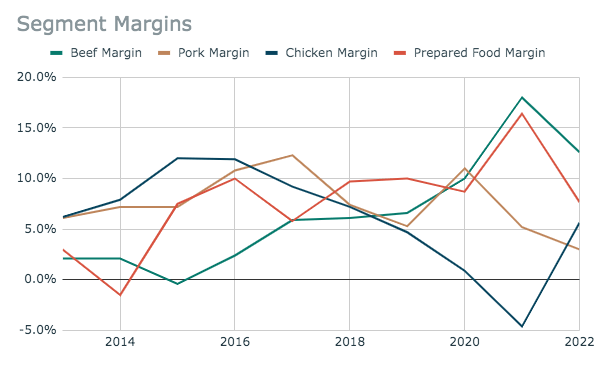
Tyson Foods Margin By Segment (SEC.gov)
The environmental and economic factors in any given year affect supply and demand and therefore, volume, pricing, and costs. The above graph shows the operating margins for each segment over time, and they are not consistent at all. This is due to the reactionary nature of the business. Tyson first needs to know if the product will cost more to produce and then adjust pricing, which will affect the volumes purchased. This reactionary cycle is why margins, revenue, and growth rates fluctuate so much from year to year.
Overall, what I take for this is that Tyson can’t be analyzed based on one year alone. The company has to be looked at from a long-term viewpoint. If one looks at it this way, one can see the general trend is low single-digit growth over time.
Valuation
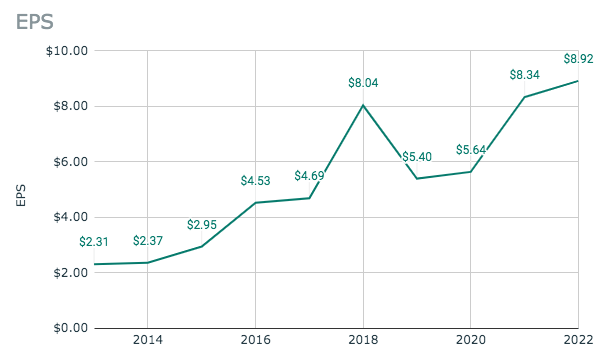
Tyson Foods EPS (SEC.gov)
Because of the variability in earnings on a year-to-year basis, the valuation of Tyson also has to be looked at on a long-term scale. A simple way to do this is average it out. The average EPS for the company over the past decade comes out to be $5.20. Now doing tends to skew the average downward by not taking into account any acquisitions made over the decade (which is commonplace for Tyson). But to me, this just bakes in a margin of safety. With the price of the stock currently around $67 per share, the company trades at a P/E of 12.88x using the ten-year average EPS. At this price level and with an already baked-in margin of safety, the company is trading at a bargain.
Conclusion
Tyson has seen many ups and downs over the last decade, which is in true industry form. As events like the avian flu, mad cow disease, drought, inflation, etc. affect the protein market, Tyson sees adjustments in pricing, volumes, and margins affecting any given year to the downside or upside. But looking at the long term, the business has a clear upward trajectory and trades at 12x average ten-year earnings. As a current holder of the stock, I have been adding more to my position during these times.
Be the first to comment