

Khosrork
This article was originally published on Dividend Kings on Tuesday, January 17th, 2023.
—————————————————————————————
Recession is on everyone’s mind in 2023, and for a good reason. The Fed has said it plans to hike to 5%, a level of interest rates we haven’t seen for 15 years.
DK S&P 500 Valuation Tool, NY Fed, CNBC 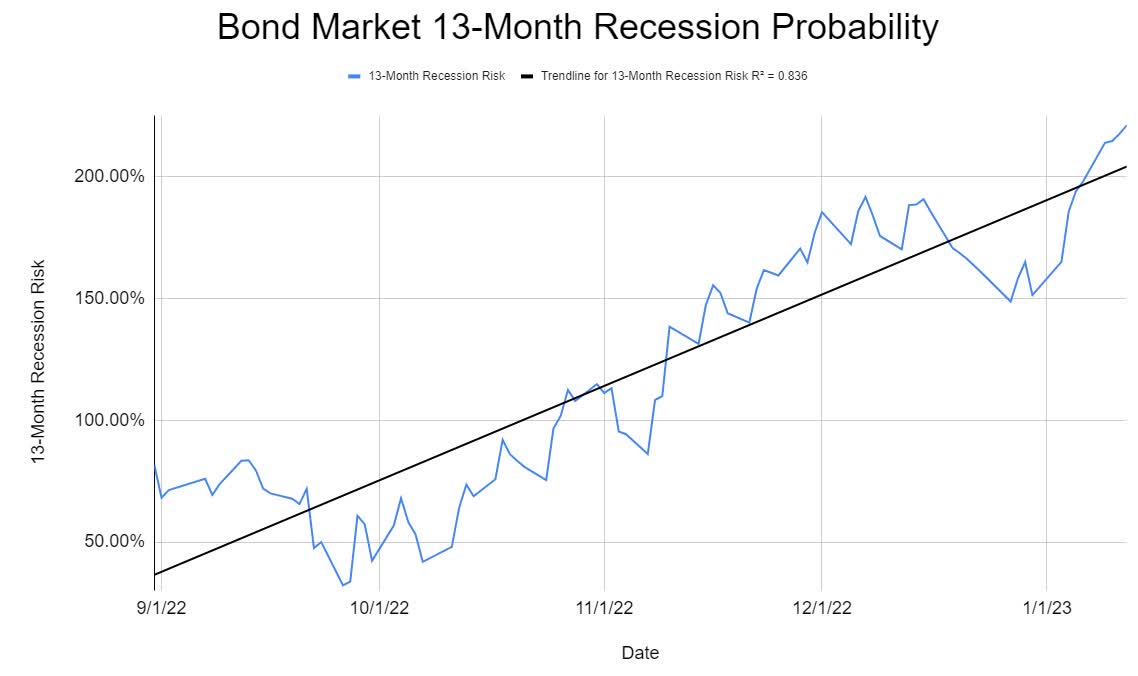
The bond market is now pricing in a 100% probability of a recession by May 2023, and the economic data is rolling over quickly (except for the job market).
In fact, 18 economic indicators point to a potential recession starting within two to four months, agreeing with the bond market.
- 85% of CEOs expect a recession in 2023
- mild one
- just 14% are planning on cutting back on growth spending
What does this likely mean for corporate earnings?
S&P Bear Market Bottom Scenarios
| Earnings Decline In 2023 | 2023 S&P Earnings | X 25-Year Average PE Of 16.8 | Decline From Current Level |
| 0% | $217.84 | $3,666.25 | 8.3% |
| 5% | $206.95 | $3,482.93 | 12.9% |
| 10% | $196.06 | $3,299.62 | 17.5% |
| 13% (average and median since WWII) | $189.52 | $3,189.64 | 20.2% |
| 15% | $185.16 | $3,116.31 | 22.1% |
| 20% | $174.27 | $2,933.00 | 26.7% |
(Sources: DK S&P Valuation Tool, Bloomberg Consensus)
The range of estimates for the S&P earnings this year ranges from flat (bullish case) to -20% (Morgan Stanley).
That means a potentially painful market correction; the only question is when.
The blue-chip consensus ranges from Morgan Stanley expecting a market bottom of around 3,300 on the S&P in Q1 (Goldman expects 3,150 in Q1) to the WSJ consensus of economists.
Out of 27 economists who work directly with the Fed, 23 expect a mild recession in 2023 and another two in 2024. Just two think the Fed can pull off a soft landing.
The consensus from those economists is that the recession begins in Q3, and stocks bottom at the end of Q3.
But regardless of how much further stocks have to fall and when they bottom, it’s important to stick to your long-term plan. Why?
JPMorgan Asset Management 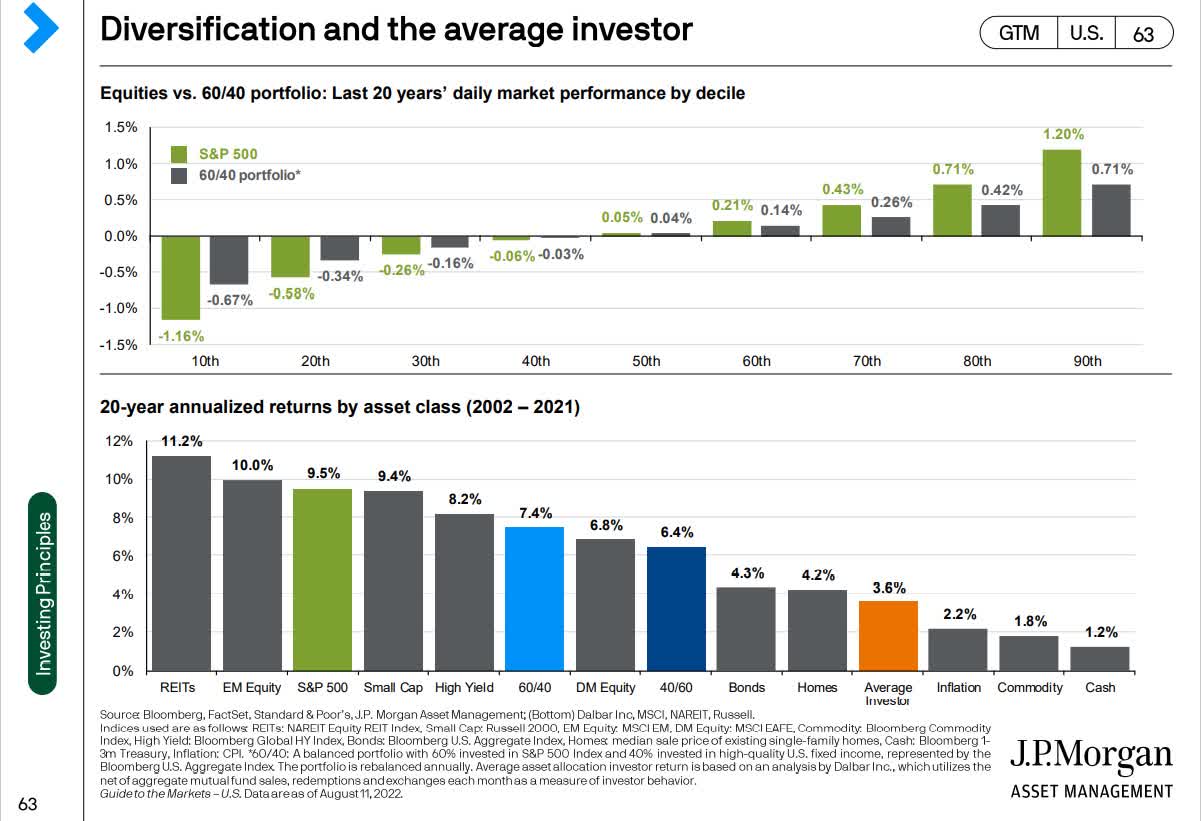
Because market timing is almost impossible to do consistently well, which is why over the last 20 years, the average investor enjoyed about half the returns of a 60/40, never mind the S&P.
JPMorgan Asset Management 
Heck, even with one of the best bull markets in history at their backs, the average investor still underperformed a 60/40.
And that’s why today I wanted to share two 9% to 10% yielding ETFs that I’ve been buying for this recession. These are two world-beaters that I trust with our portfolios and my life savings, and you can too.
The Reason To Own Managed Futures In A Sleep-Well-At-Night Retirement Portfolio
What’s the best asset to own in a recession? Historically, it’s long-duration US treasuries, which can soar as much as 75% in a recession.
Indeed, the consensus is that long bonds could be one of the best asset classes of 2023 after their worst year ever in 2022.
- blue-chip consensus is that long bonds could rally 30% to 40% in 2023
So we should all buy long bonds and avoid stocks right? Wrong! Because Wall Street runs on probability curves, not certainty.
Here’s the bullish case for bonds.
- recession causes inflation to crash
- 10-year Treasury yields fall to 2% to 2.5%
- 30-year yields fall to 2.25% to 2.75%
- long bonds rally 30% to 40% in 2023 or through 2024
But guess what? These same blue-chip economist teams warn that there is a far worse potential scenario.
- China reopening causes oil prices to soar to $105 to $140
- inflation re-accelerates or at least gets stuck in 2023
- possibly at 4% to 5% on CPI
What does this scenario potentially mean? UBS estimates that if crude goes triple-digit, the Fed might have to hike to 6%.
Jamie Dimon, CEO of JPMorgan, says, “there is a 50/50 chance the Fed goes above 6%”.
What would that mean for stocks and bonds? According to Toronto-Dominion and Wells Fargo, 10-year yields might peak in 2023 at 4.25% to 4.75% and 30-year yields at 4.5% to 5%.
- 4.25% is the current cycle peak for 10-year yields
Is 5% yields on 30-year bonds the base case? No, it’s the realistic worse case. But one that could long bonds to fall 33% to 36% more from here.
- Another bad year for bonds
- a potentially grisly year for long bonds
Since WWII, bonds go up or are flat 92% of the time when stocks fall. The other 8% of the time, high inflation and soaring rates hammer bonds and are the reason stocks fall in the first place.
Why Market Timing Isn’t The Answer
You’re wrong if you think that market timing is possible, even if you know what the economy will do with God-like foresight.
Charlie Bilello
Outside of the Great Depression, perfectly timing the economy wouldn’t beat buy-and-hold investing.
Far more money has been lost by investors preparing for corrections or trying to anticipate corrections than has been lost in corrections themselves.” – Peter Lynch
But to achieve life-changing income and wealth growth first, you have to survive the inevitable market downturns, like the one that’s likely coming this year.
So if bonds are LIKELY the answer, but maybe not, what are prudent investors like us to do?
When Bonds And Stocks Fail, Managed Futures Don’t
Managed futures refers to an investment where professionals actively manage a portfolio of futures contracts.” – Investopedia
Managed futures are a trend following asset class and have two main claims to fame.
First, they are inversely correlated to stocks and bonds.
Morgan Stanley
Second, they shine brightest exactly when you need them when the market crashes.
| Bear Market | Managed Futures | Bonds | 50/50 Bonds Managed Futures | S&P |
| 2022 Stagflation | 17% | -13% | 2% | -28% |
| Pandemic Crash | 0% | -0.5% | 0% | -34% |
| 2018 | 6% | 2% | 4% | -21% |
| 2011 | -7% | 5% | -1% | -22% |
| Great Recession | 14% | 7% | 11% | -58% |
| Tech Crash | 29% | 9% | 19% | -50% |
| 1998 Bear Market | NA | 1% | 1% | -22% |
| 1990 Recession | 21% | 1% | 11% | -20% |
| 1987 Flash Crash | 57% | -3% | 27% | -30% |
| 1980 to 1983 Stagflation Period | 195% | NA | 195% | 51% |
| Average | 37% | 1% | 19% | -23% |
(Sources: Charlie Bilello, Portfolio Visualizer, Barclays, Soc Gen)
Long bonds do even better in bear markets. A combination of bonds and managed futures have never failed to be flat or go up in every bear market since 1980.
- 97% statistical probability the most successful hedging combo in history will work in future bear markets
How powerful is the benefit of trend-following managed futures?
AQR
Since 1880 adding a 20% allocation to this asset class to a 60/40 would have boosted returns by 1.3% per year.
- 3X higher inflation-adjusted returns
While lowering annual volatility by 2%. But most impressively, it would have meant a peak decline of 50% during the Great Depression, when a 60/40 fell 62% and the US market 87%.
In other words, diversification really is the only “free lunch on Wall Street.”
But how can you get exposure to an asset class that historically only accepts millionaires and then charges than 5% per year?
DBMF And KMLM: The Two Best Managed Futures ETFs You Can Buy
I’ve written extensively on why the iM DBi Managed Futures Strategy ETF (DBMF) is my favorite managed futures ETF. In fact, it’s a core holding in the Dividend Kings ZEUS Income Growth portfolio, where I’m going to migrate 100% of my life savings to in the coming years.
However, a DK member recently asked me to analyze the KFA Mount Lucas Strategy ETF (KMLM), and what I found was so wonderful I added KMLM to the DK ZEUS Income Growth Portfolio.
| Stock | Yield | Growth | Total Return | Weighting | Weighted Yield | Weighted Growth | Weighted Return |
| VIG | 1.8% | 10.2% | 12.0% | 8.33% | 0.2% | 0.9% | 1.0% |
| SCHG | 0.5% | 12.5% | 13.0% | 8.33% | 0.0% | 1.0% | 1.1% |
| SCHD | 3.5% | 7.6% | 11.1% | 16.67% | 0.6% | 1.3% | 1.9% |
| EDV | 4.1% | 0% | 4.1% | 16.67% | 0.7% | 0.0% | 0.7% |
| DBMF | 9.0% | 0% | 9.0% | 8.33% | 0.8% | 0.0% | 0.8% |
| KMLM | 9.4% | 0.0% | 9.4% | 8.33% | 0.8% | 0.0% | 0.8% |
| AMZN | 0.0% | 19.2% | 19.2% | 5.56% | 0.0% | 1.1% | 1.1% |
| LOW | 2.1% | 20.6% | 22.7% | 5.56% | 0.1% | 1.1% | 1.3% |
| MA | 0.6% | 23.2% | 23.8% | 5.56% | 0.0% | 1.3% | 1.3% |
| BTI | 7.1% | 10.4% | 17.5% | 2.78% | 0.2% | 0.3% | 0.5% |
| ENB | 6.6% | 4.9% | 11.5% | 2.78% | 0.2% | 0.1% | 0.3% |
| MO | 8.3% | 5.0% | 13.3% | 2.78% | 0.2% | 0.1% | 0.4% |
| HASI | 5.0% | 10.8% | 15.8% | 2.78% | 0.1% | 0.3% | 0.4% |
| BAM | 4.4% | 14.6% | 19.0% | 2.78% | 0.1% | 0.4% | 0.5% |
| NEP | 4.3% | 13.5% | 17.8% | 2.78% | 0.1% | 0.4% | 0.5% |
| Total | 4.6% | 10.2% | 14.1% | 100.00% | 4.1% | 8.3% | 12.4% |
In other words, I now recommend owning both DBMF and KMLM for your managed futures allocation.
Why? Because as I’ll now show, they are the two gold standard ETFs for gaining exposure to an asset class that does not correlate with the stock or bond market.
| Bear Market | ZEUS Income Growth | 60/40 | S&P | Nasdaq |
| 2022 Stagflation | -14% | -21% | -28% | -35% |
| Pandemic Crash | -9% | -13% | -34% | -13% |
| 2018 | -10% | -9% | -21% | -17% |
| 2011 | 4% | -16% | -22% | -11% |
| Great Recession | -20% | -44% | -58% | -59% |
| Average | -10% | -21% | -33% | -27% |
| Average Decline vs. Benchmark | NA | 48% | 30% | 36% |
(Source: Portfolio Visualizer Premium)
You get 12% to 13% historical and 12% to 14% expected future returns with a 4.1% yield today while enjoying 70% smaller peak declines in bear markets, and 50% the peak decline of a 60/40 with 2X the yield.
What Makes DBMF And KMLM World-Beater Managed Future ETFs
DBMF has a very simple strategy.
DBMF
It tracks the Soc Gen CTA (Commodity Trading Advisor) index, which consists of the 20 largest managed futures funds.
By charging 4% less in fees, DBMF’s goal is to achieve 4% better returns than its index, becoming “the Vanguard of hedge funds.”
Thanks to an algorithm that uses a two-month look-back period, it’s done just that. Through regression analysis, DBMF replicates the equivalent positions of the largest managed futures funds, going long/short stocks, bonds, currencies, and commodities.
DBMF Watch
Every Monday, DBMF rebalances its portfolio and owns 14 net positions.
- short the S&P 500
- long global stocks
- long the Yen
- short the Euro
- short bonds
- long gold
- slightly long oil
If oil prices soar and the Fed hikes to 6% or more? Then guess what’s likely to happen? The Euro crashes, crude skyrockets, and the stock and bond market falls.
DBMF would likely have another great year.
But what about long term? What does tracking the Soc Gen CTA index mean for long-term returns?
Soc Gen
This index has been around for 20 years and delivered very solid returns when investors needed them most.
- 4.6% CAGR since inception
- about 0.5% better than bonds
- but the best returns when bonds and stocks fail
In other words, DBMF is expected to earn about 8.5% to 9% returns long-term due to its lower fees than its index.
Newedge = Soc Gen CTA index (CME Group )
What do you get if you track the 20 largest managed futures funds instead of 500 to 600 existing ones?
- an army of the highest-paid quantitative analysts running the most advanced models on supercomputers
Newedge = Soc Gen CTA index
From 2003 to 2014, Soc Gen beat the overall industry by 1% per year, or 20% better returns.
- the benefit of tracking the largest funds
For example, in 2008, the S&P fell 37%, and the Soc Gen managed futures index went up 13%. That included rising 6% when the S&P fell 17% in October 2008, and a 60/40 fell 16%.
In September 2022, the S&P fell 9%, and a 60/40 fell 8%. DBMF went up 6%.
DBMF During The 2022 Bear Market: When The Stock And Bond Market Fall Apart, Managed Futures Soar
Portfolio Visualizer Premium 
Even when there wasn’t time for a trend to be created, such as during the Pandemic, DBMF performed very well, falling just 2%. Flat returns are a fine hedging strategy when the market falls off a cliff.
Portfolio Visualizer Premium 
KMLM: A Better Index Could Lead To Better Returns
But while the Soc Gen CTA index is a great managed futures index to track, I came across this data that knocked my socks off when researching various managed futures ETFs.
investor presentation
The Mount Lucas managed futures index consists of 22 futures markets in a diverse portfolio of commodities, bonds, and currencies.
It’s rebalanced monthly, and then Mount Lucas applies a monthly trend following an algorithm to adjust the weightings.
- KMLM rebalances twice as fast as DBMF does
investor presentation
You can see how the MLM index started out long commodities and then got longer commodities but then went neutral and even short commodities as inflation rolled over.
It was long the US dollar and has been pulling back that short position after the dollar peaked in October.
It’s been steadily reducing its short bond positions as well, as rates started to fall and bonds started to rally.
What does KMLM look like today?
investor presentation
It’s short global bonds, net short commodities, and still long the dollar.
I can recommend KMLM, despite the ETF that tracks it only beginning in Jan 2021, because this is the best-performing managed futures index I’ve ever seen.
In fact, I’m so impressed by KMLM that I’m buying some for my portfolio and adding it to the ZEUS Income Growth Portfolio.
Why?
Investor presentation
- the MLM index was up 36% in 2022
- up 40% in 2008 vs. S&P -37%
- up 38% in 2000 vs. -22% S&P
- up 33% in 1990 (20% bear market for stocks)
Soc Gen (what DBMF tracks closely) did great in the most trying economic and market conditions. But the MLM index did even better.
In fact, while the Soc Gen index was up 6% in October 2008, the MLM index was up 22%.
October 2008: The Worst Month For Stocks In 40 Years
- S&P -17%
- 60/40 -16%
- DBMF index +6%
- KMLM index +22%
Anything that went up in the worst month for stocks in four decades is impressive. But something that went up 22%? That’s truly exceptional.
- MLM index was up 10% in March 2020
- DBMF fell 2%
- Peak decline in the S&P -34%
But KMLM’s index isn’t just better during the most extreme monthly crashes.
investor presentation
KMLM’s index has delivered 9.4% annual returns since 1988, while most managed futures indexes delivered 4.5% to 5%.
Over these 35 years, fundamentals, not luck, drive 97% of total returns, indicating that Mount Lucas’s index is likely the best way to track managed futures.
DBMF Vs. KMLM: Pros And Cons Of Both
First, let’s remember that ETFs track indexes with a slight amount of error, and taxes for futures are relatively high.
KMLM Prospectus
Managed futures ETFs like KMLM have a policy of paying out all gains as annual dividends. DBMF’s historical post-tax returns are about 64% of its index’s pre-fee returns.
KMLM’s post-tax returns are 60% of its index returns.
In other words, taxes will consume about 40% of your returns, and you can’t avoid those taxes outside retirement accounts.
- post-tax returns for DBMF are expected to be about 5.8% over time
- post-tax returns for KMLM are expected to be about 5.6% over time
- post-tax returns for long bonds are expected to be about 2.7% over time
Mind you compared to bonds, which are taxed as ordinary income (like REITs), DBMF and KMLM are likely to deliver about 2X better long-term returns. What about costs?
Seeking Alpha
AMFAX, PQTAX, and GIFMX are four or 5-star rated actively managed futures funds and the best active-managed alternatives to those that don’t want to track an index.
DBMF and KMLM are the low-cost options, which is the benefit of an ETF vs. active management.
Seeking Alpha
Is active management worth the price? Not in the last two years when both KMLM and DBMF have run circles around even the best actively managed funds.
DBMF vs. KMLM Since Jan 2021
Portfolio Visualizer Premium 
DBMF has slightly beaten KMLM since inception with slightly less volatility and significantly smaller peak declines.
- the benefit of having an additional asset class (stocks) in the portfolio
What about 2023?
KMLM investor presentation
Historically speaking, following a year of extreme economic and market dislocation, in which managed futures shine, the next year tends to average a double-digit gain as well.
In other words, while a recession is likely in 2023, it’s not certain.
While bonds are likely to be red hot in 2023, that’s not guaranteed.
And if both the stock and bond market fail in 2023, then both DBMF and KMLM are likely to do well, with KMLM likely outperforming DBMF by a small amount (but with higher volatility).
Why You Shouldn’t Invest More Than 20% Into Managed Futures
The blue-chip consensus recommendation is for a 5% to 20% portfolio allocation into managed futures, replacing the bond portion of your portfolio.
But if KMLM’s index could deliver 9.4% returns over the long-term, and such wonderful returns in market crashes, why not just own nothing but managed futures?
KMLM investor presentation
While managed futures do great when the stock market is going to hell, during periods of relative calm, they don’t do so hot.
From 2009 they experienced a flat decade, which was negative 20% adjusted for inflation.
The benefit to managed futures is strong long-term returns with high-yield (how all gains are paid out) with a negative correlation to stocks and bonds.
- Managed futures are an insurance policy for your portfolio that pays you about 6% after-tax returns for owning them
AQR
In the stagflation hell of the 1970s? Trend-following managed futures delivered 22% returns. In the chaos of the Pandemic? 16% annual returns.
During the lost decade of the 2000s? They delivered around 5% annual returns.
And during the tech bubble, they delivered 8% annual returns.
In other words, 100% invested in managed futures isn’t likely to get you sufficient returns to reach your financial dreams.
Bottom Line: DBMF And KMLM Are Two 9% To 10% Yielding Blue-Chip ETFs I’ve Bought For This Recession, And You Might Want To Consider Doing The Same
Don’t get me wrong, stocks have been and likely always will be the best-performing asset class. If you have the nerves of steel required to ride out the inevitable bear market and occasional 40+% crashes, you don’t need to own bonds or managed futures.
KMLM investor presentation
But if you are like most people and panic sell and market time during bear markets, bonds and managed futures represent two important ingredients in the optimal blue-chip portfolio pie.
KMLM investor presentation
This is the right way to think about risk management. How would you like to match a 60/40’s returns but with lower volatility and much smaller declines? That’s the power of diversification and prudent asset allocation.
And regarding managed futures, I’ve never found two better options than DBMF and KMLM.
DBMF is best for those who want the upside potential of stocks and historically lower volatility.
KMLM is best for those that don’t mind missing out on stock trends and want the historically best-managed futures returns of the last 35 years.
Both are low-cost options in their industry, using solid strategies to track very good indexes.
Indexes that have delivered exactly what they promised when the stock market crashed.
| Bear Market | Managed Futures | S&P |
| 2022 Stagflation | 17% | -28% |
| Pandemic Crash | 0% | -34% |
| 2018 | 6% | -21% |
| 2011 | -7% | -22% |
| Great Recession | 14% | -58% |
| Tech Crash | 29% | -50% |
| 1998 Bear Market | NA | -22% |
| 1990 Recession | 21% | -20% |
| 1987 Flash Crash | 57% | -30% |
| 1980 to 1983 Stagflation Period | 195% | 51% |
| Average | 37% | -23% |
(Source: Portfolio Visualizer, Soc Gen, Barclays, Charlie Bilello)
No matter what you might have heard when interest rates were zero, stocks are not bond alternatives.
Stocks, bonds, and managed futures are different asset classes designed to deliver very different things.
But when combined in a 67% stock, 33% bonds + managed futures portfolio, you create the long-term recession-optimized Ultra Sleep-Well-At Night retirement portfolio.
One that can deliver 10% to 15% long-term returns with 2X to 3X the yield of the market and a 60/40 portfolio. And a fraction of the volatility and declines in even the most extreme market crashes.
Can a pure stock portfolio deliver 10% to 15% annual returns? Yes, it can. Can most people actually achieve those returns? No, they can’t. The volatility inherent in a pure stock portfolio is too much for most people to SWAN and remain sane, safe, and calm in a bear market.
And that’s where the power of diversification and prudent asset allocation comes in.
Combining the best blue-chip ingredients in the right amounts for your risk profile and temperament can achieve market-like returns while riding over even the worst market potholes in a Rolls Royce portfolio.
So why do I recommend both DBMF and KMLM? And why do I own both? Because ultimately, they are the best-designed low-cost options representing the KO and PEP, MA and V, LOW and HD, AMZN and MSFT, and BX and BAM of their industry.
Reasonable investors can debate which of these industry titans is better in each industry. But ultimately, any long-term investor who buys them for the long term is likely to be very happy with the result.
And that’s why I have bought both DBMF and KMLM ahead of this recession, and you might want to do the same.
Be the first to comment