

RiverRockPhotos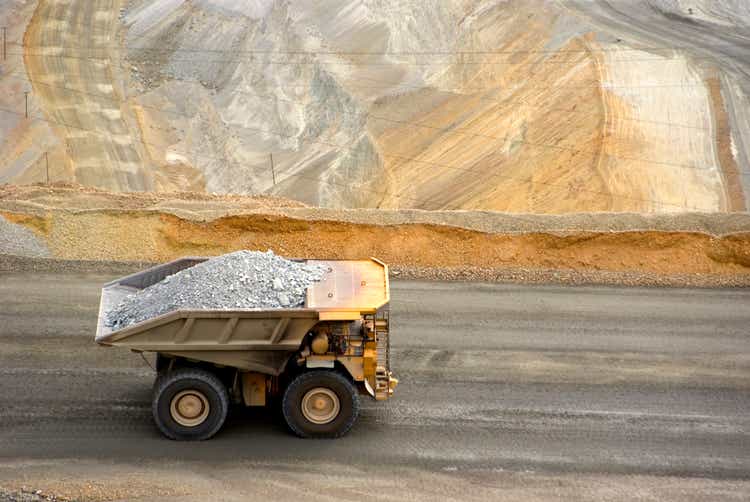
Thesis
Copper’s looming supply shortfall will support strong copper prices over the coming decades.
Mine Production Capability vs Primary Demand (Wood Mackenzie )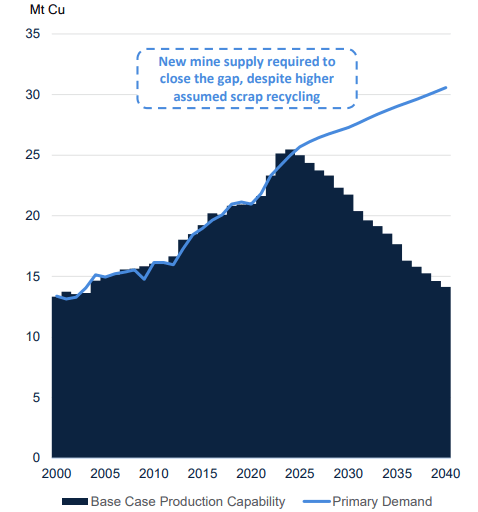
This article will make a bullish case for copper by analyzing the long-term outlook for copper demand and supply. I will cover the best pure-play copper producers to own in a future article.
Copper To Play A Key Role In The Race To Net-Zero
Two primary pillars of the clean energy transition to achieve the global commitment of net-zero CO2 emissions by 2050 are:
- The electrification of the global vehicle fleet
- The switch to renewable energy for power generation.
Electric vehicles (EVs) are expected to be up to 4.5x more copper intensive than conventional internal combustion engine vehicles:
Copper Development Association Inc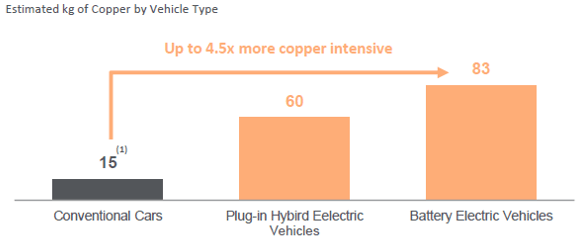
An increase in the proportion of EVs (including hybrid electric vehicles (HEV) and plug-in hybrid electric vehicles (PHEV)) as a percentage of auto sales will drive higher copper consumption. The electrification of the global vehicle fleet is expected to increase the copper consumption of the global vehicle fleet by ~3.5x by 2040:
Wood Mackenzie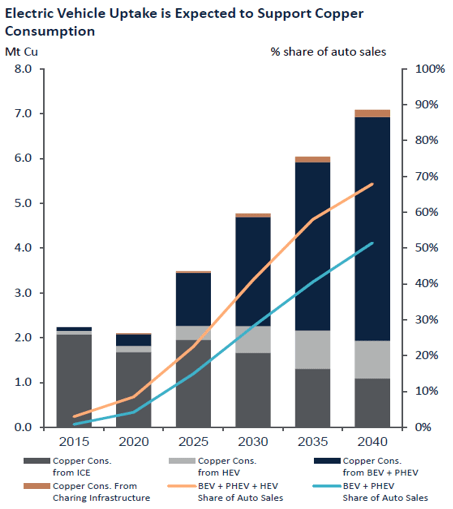
There is practically no alternative to copper as an effective electrical and thermal conductor (only silver is a better conductor but costs preclude it from being feasibly used). Additionally, copper content is particularly high in numerous key technologies required for decarbonization:
S&P Global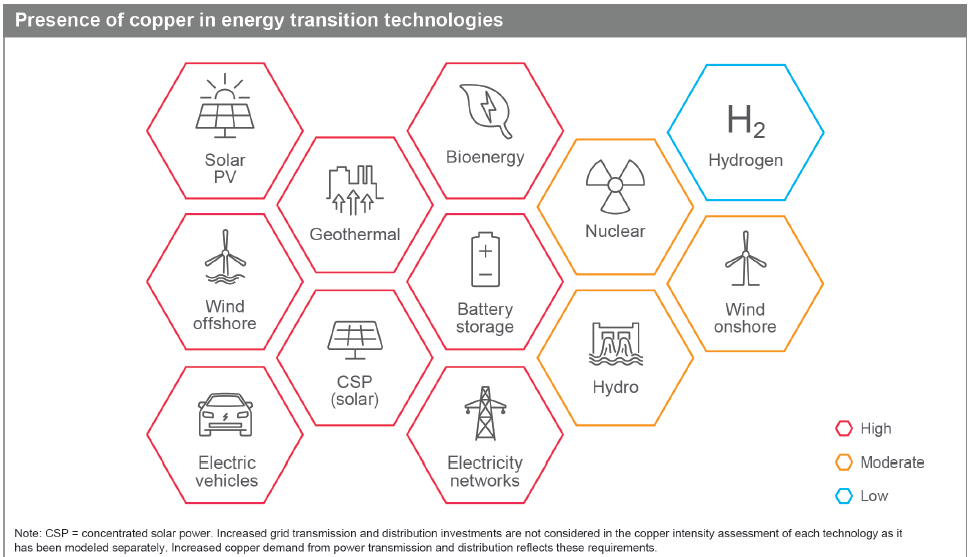
Existing infrastructure will also become more copper-intensive due to the requirement of “Smart grids” that will play an important role in the energy transition. According to IEA “Investment in copper-intensive smart grids will need to more than double through to 2030 to get on track with the net zero emissions by 2050 scenario”. This transition of existing infrastructure, transition to renewable energy sources and the continued growth in non-energy transition copper demand will lead to unprecedented quantities of copper consumption over the next few decades. To put this demand into numbers, Wood Mackenzie forecasts copper consumption to grow from 28.8mt in 2020 to ~55mt by 2040:
Total copper consumption in 2040 (Mt Copper) (Wood Mackenzie Q2 2022)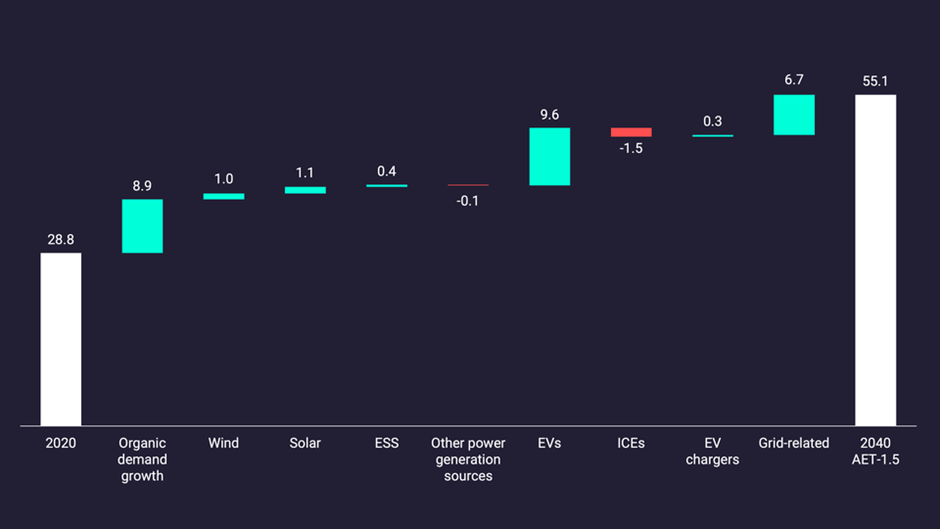
China’s Importance To The Copper Demand Story
China is the largest consumer of copper, accounting for ~49% of the 2022 forecast global demand. Consequently, China’s commitment to the renewable energy transition and its subsequent future copper demand will be a key driver of future copper prices.
Author Created (Capital IQ Data)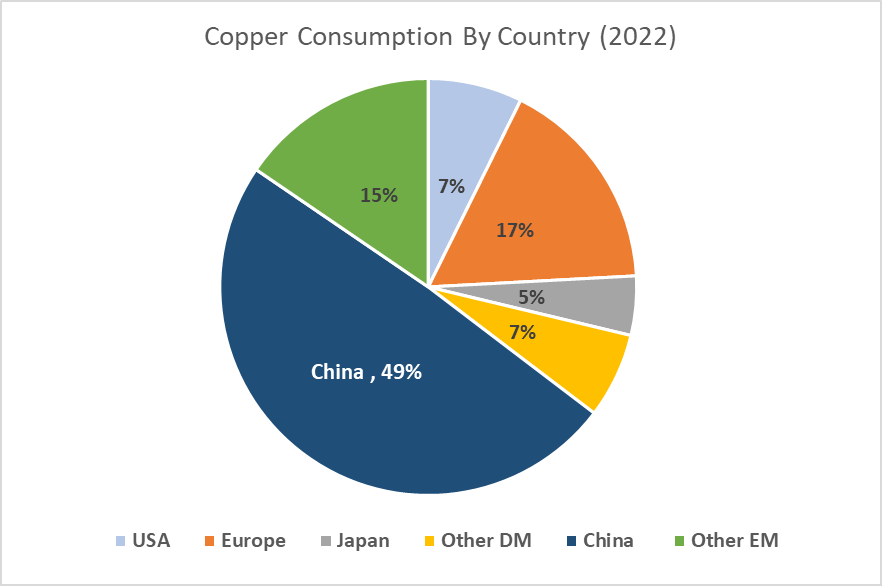
As the largest emitter of carbon (~29% of global CO2 emissions), China’s renewable energy uptake is often overlooked. The Chinese government is supporting the transition from thermal energy (particularly coal) to a power system based on renewables. In recent years, China has become the leading producer of renewable energy (see chart below) and this trend looks set to continue on the back of supportive government policy. Extensive Chinese power outages are an acute economic and political issue for the Chinese government to resolve. This is likely to exacerbate the uptake of a long-term renewable energy solution.
U.S. Energy Information Administration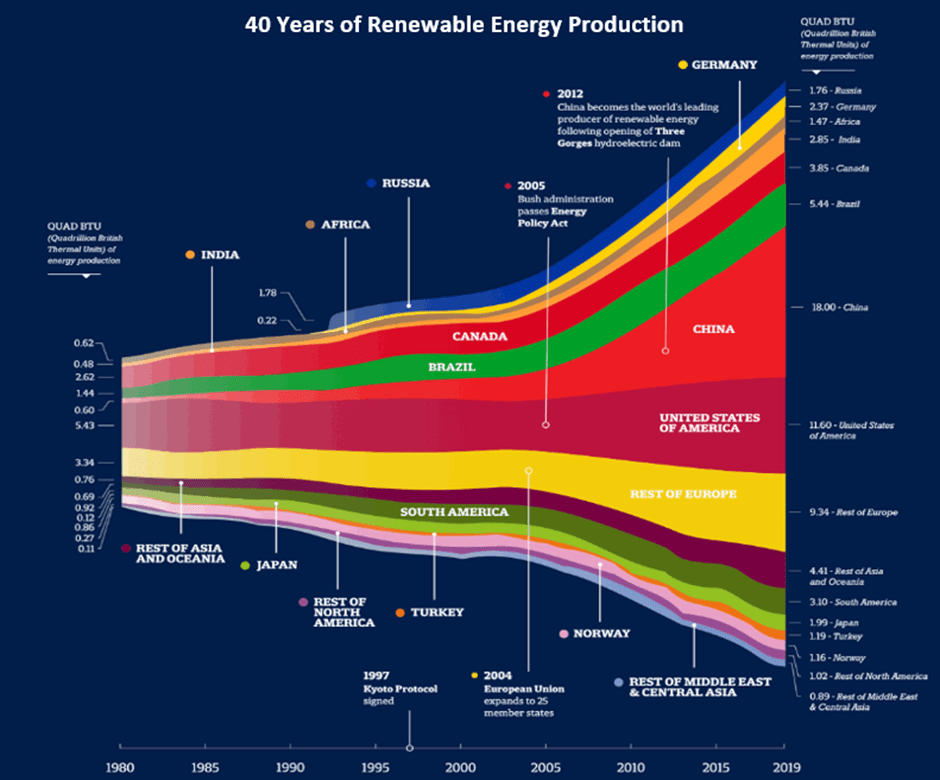
Recent data supports this trend, with Chinese EV sales doubling year-on-year and solar installations up over 100% YTD. China now accounts for ~50% of the world’s EV fleet and continues to implement policy changes to further support this EV uptake. I believe this rapid growth in Chinese green demand is set to continue for an extended period, which will be a tailwind for copper prices over the long term.
Existing Copper Mines Facing Increasingly Difficult Operating Environment
The copper industry is more concentrated than many other major commodities with Chile and Peru (the top two producers) accounting for ~38% of global production. This concentration increases to ~46% when including The Democratic Republic of Congo (the third biggest producer). As evident from the chart below, there are limited large-scale copper producers in Tier 1 locations:
International Copper Study Group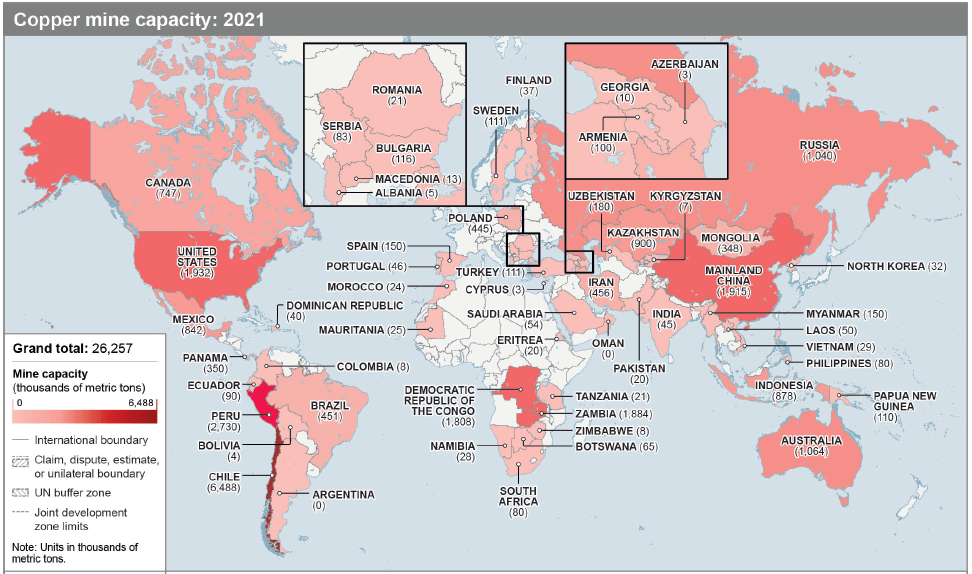
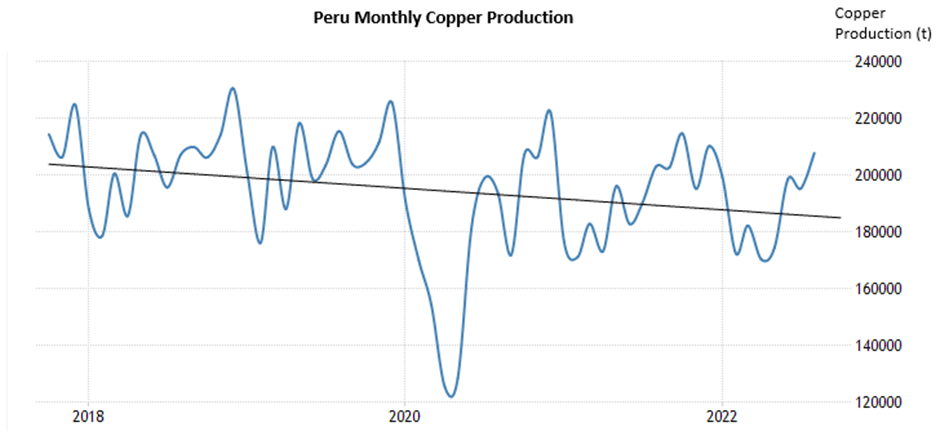
South American copper producers are facing increasing fiscal uncertainty, with a proposed increase in the tax rate for miners and increasing environmental scrutiny/legislation around water usage and environmental protection. Copper production in both Chile and Peru is yet to recover to pre-COVID levels, reflecting an increasingly difficult operating environment:
Trading Economics | National Institute of Statistics, Chile Trading Economics | National Institute of Statistics, Peru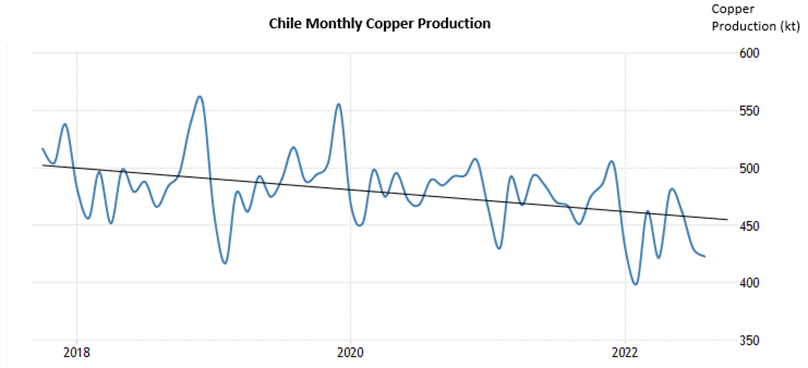
This uncertainty has translated to increased difficulty in expanding the production of existing mines as well as bringing new copper mines online, with mining licenses becoming increasingly difficult to obtain. See recent examples below of increasingly difficult operating environments affecting key copper mines:
- Chile’s Escondida mine and the world’s largest producing copper mine (~4.8% of global production) have downgraded their production outlook for 2022 due to labor shortages and ongoing local protests.
- Chile’s Collahuasi and the world’s second-largest producing copper mine (~3% of global production) is showing signs of production issues with the latest August production data showing a 5.4% decline in production.
- Peru’s Las Bambas mine (~1.5% of global production) still has no time frame on when it will be able to build its second open pit mine (originally expected to be by the year-end of 2022) due to local opposition. As a result, 2022 copper production guidance lowered from 300k-320k tonnes to 240k tonnes.
Uncertainty Around Future Copper Supply
As previously alluded to, there is a consensus view that by 2026 there will be a copper supply deficit. According to Wood Mackenzie, “There is a need for ~9.7mt of mine supply over the next decade from projects that have yet to be sanctioned”. A majority of forecast supply is likely to come online in the next 2 years, after which supply growth decelerates until ~2027. The supply outlook is becoming ever more uncertain with greenfield projects becoming increasingly difficult to launch due to ESG-related constraints.
Company data, Goldman Sachs Global Investment Research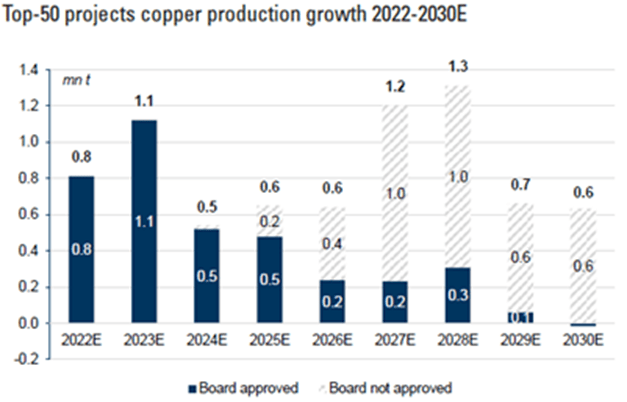
~50% of additional supply from the top-50 projects will come from projects in higher-risk jurisdictions (Mongolia, Zambia, Panama, Botswana, Papua New Guinea & DRC). The trend of production moving out of conventional jurisdictions is primarily due to grade declines and fiscal uncertainty forcing companies to reconsider investment (Chile, Peru). This trend combined with the limited copper reserves in tier 1 locations (see map below) puts future supply in a precarious position.
International Copper Study Group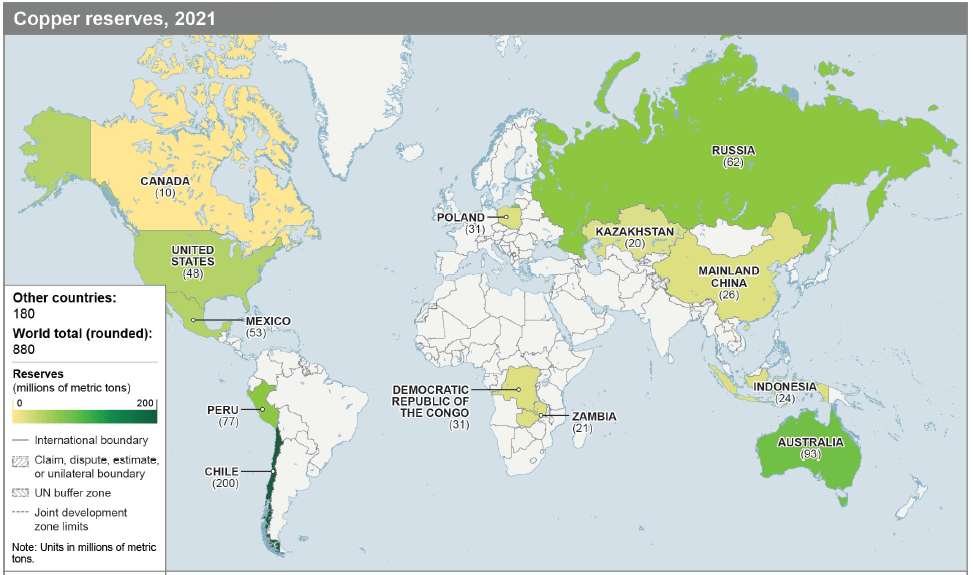
Lackluster exploration spending is yet to impact copper supply, as the greenfield copper projects of 10-20 years ago are now in the production stage. Long lead times for mine development will likely thwart the industry from making up for lost time, with a typical copper mine taking ~20 years to go from the discovery stage to production. Despite the significant demand forecasts, exploration budgets are still below their pre-GFC levels and are ~41% lower than their 2012 high:
S&P Global Market Intelligence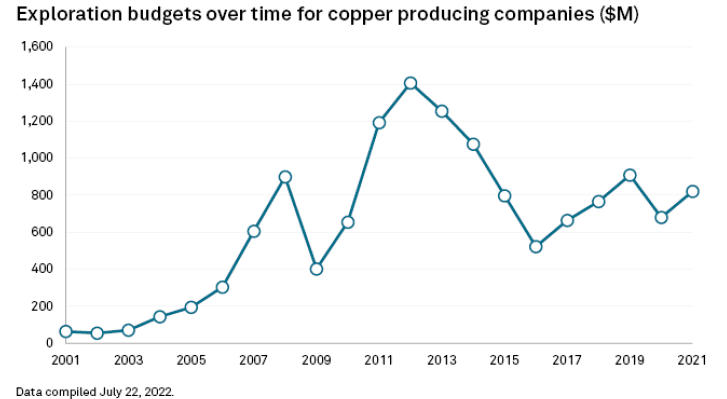
The lengthy lead times, increasingly difficult government policies, and declining resource grade will likely see this chronic underinvestment persist. Of the greenfield copper projects covered by Goldman Sachs since 2018, ~50% of the projects covered have been delayed by an average of 3 years. The trend of production shifting to unconventional jurisdictions due to the bifurcation in grades of projects in conventional (lower grade) vs unconventional (higher grade) jurisdictions is likely to exacerbate these project delays and supply uncertainty.
S&P Global Market Intelligence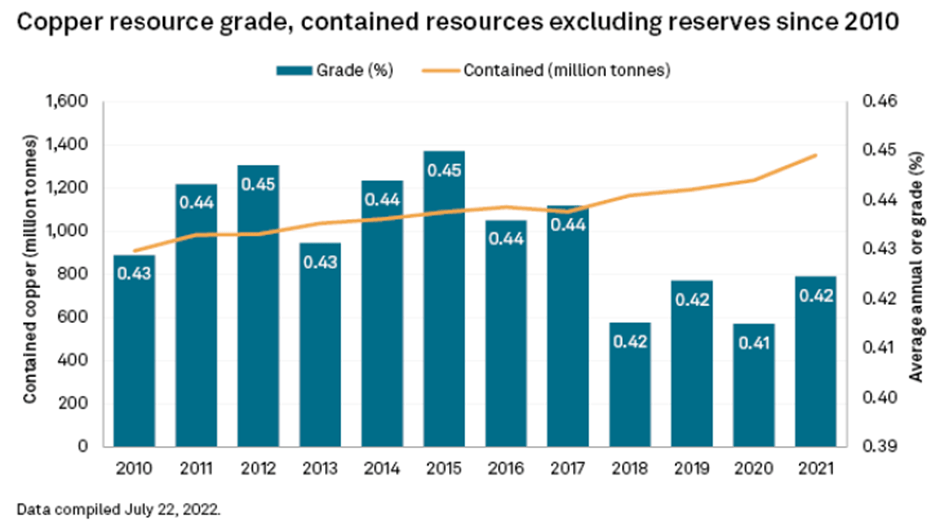
Piecing The Supply & Demand Together
S&P Global estimates “the world will be short 1.6 million tonnes of copper in 2035, with major deficits beginning this decade. In its most pessimistic view, that shortfall expands to 9.9 Mt in 2035.” Whilst analysts have varying forecasts on price, supply and demand, there is a consensus view that the supply shortfall is likely to occur around 2026, which will support a price recovery from current levels:
Author Created (Capital IQ Consensus Data)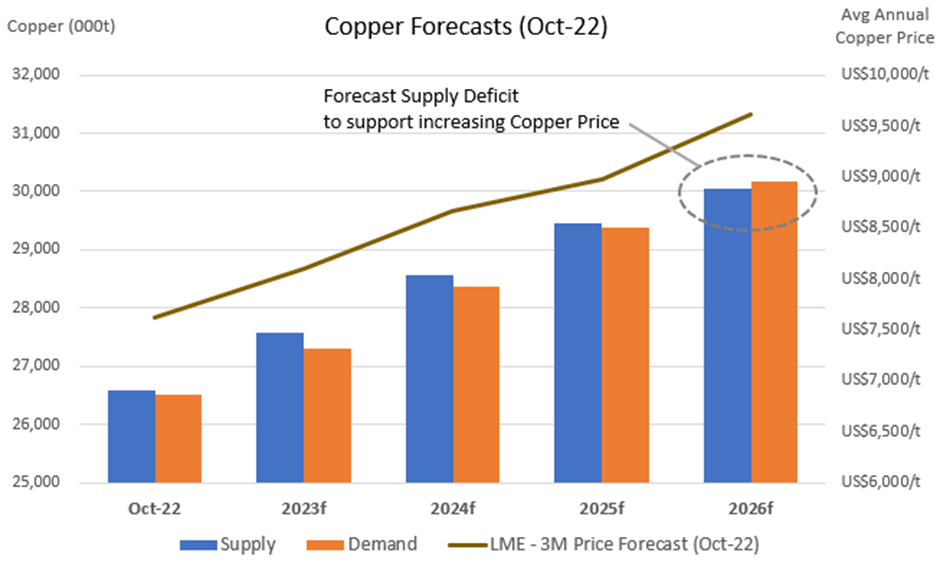
Copper Price Short-Term Outlook
Copper is often referred to as a bellwether for the global economy and thus it is not surprising to see copper is down ~30% from its recent high in March.
LME Copper Price US$/lb (Trading View)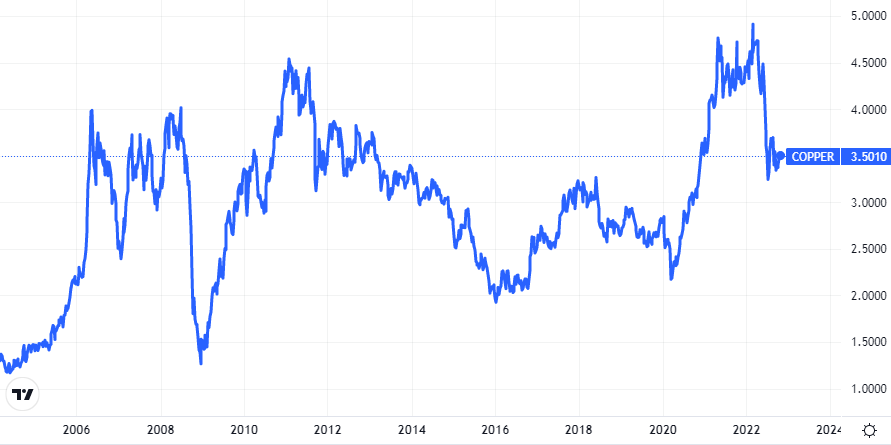
There are strong short-term headwinds, with stagnating Chinese consumption, European energy inflation and global recession fears likely to cause volatility over the short term with limited immediate upside to copper prices. However, I would argue there is a limited likelihood of further significant negative price movement due to the aforementioned ESG-related supply squeeze in Latin America providing downside support to copper prices.
I believe there are ingredients for a powerful positive price movement on the back of critically low copper inventory levels, which makes prices more sensitive to any immediate improvements in demand. This increased demand could come in the form of China abolishing its zero COVID policy or Chinese infrastructure-focused fiscal stimulus flowing through to an increase in demand.
Copper’s Historical Performance During Fed Rate Hiking Cycles
Author Created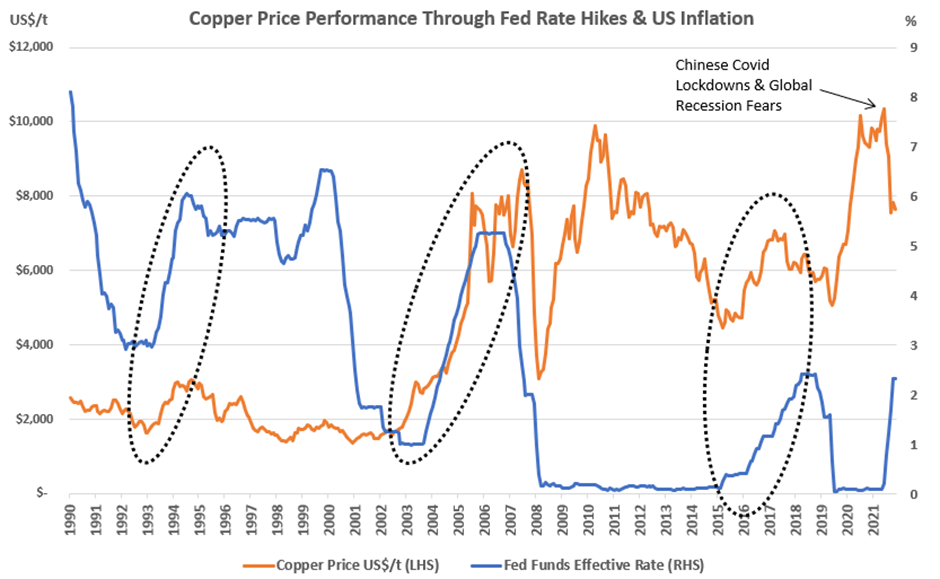
Copper has performed well over the last 8x US Fed Reserve hiking cycles since 1972, returning ~21% p.a. during the rate hiking periods, outpacing equities and bond returns over the same period.
Copper Outperforms During A Fed Hiking Cycle (Goldman Sachs Global Investment Research)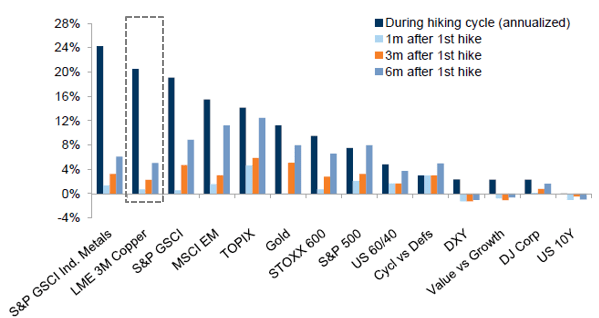
Whilst this strong historical correlation of outperformance may not continue for the current Fed tightening cycle, it indicates that a Fed rate hiking cycle does not preclude the copper price from performing well.
Conclusion
Multiyear plans, bills and government stimulus in Europe, China and the US directed towards decarbonization, electrification, renewables and infrastructure will sustain ongoing copper demand. Additionally, the Russia/Ukraine war has catalyzed a further acceleration of the copper-intensive energy transition spending across Europe as countries look to reduce their demand for Russian gas, which will have a lagging impact on copper demand in the medium term.
There are numerous risks to the supply side such as unearthed copper deposits often being located in remote and difficult locations, proposed projects facing opposition and new copper mines being located in politically and ecologically sensitive areas. I believe this lack of a clear solution to Copper’s anticipated supply shortfall will lead to significantly higher copper prices over the long term.
Be the first to comment