

Yuji Sakai/DigitalVision via Getty Images
Over the past year or so, one of my best calls has been the ‘strong buy’ rating that I assigned to O-I Glass (NYSE:OI). In recent months, the firm has undergone a significant transformation, selling off assets and repositioning itself for the future. This created a great deal of uncertainty. But at the same time, I also concluded that the company, which focuses on providing glass containers to its customers for alcoholic beverages, food items, soft drinks, pharmaceutical offerings, and more, was trading at rather cheap levels. Strong financial performance on the top line, combined with mixed bottom line performance, for the 2022 fiscal year so far, has helped shares to rise meaningfully. Add on top of this how cheap shares are today, and I do think that further upside is still on the table.
A play on glass
Back in December of 2021, I wrote a very bullish article on O-I Glass. In that article, I found myself impressed with the transformation the company had been undergoing and by how cheap shares were. Even though there was some uncertainty, I felt as though the long-term outlook for the company was favorable. This led me to rate the company a ‘strong buy’, reflecting my opinion at that time that shares would likely significantly outperform the broader market moving forward. Since then, things have gone even better than I anticipated. While the S&P 500 is down by 23.9%, shares of O-I Glass have generated upside for investors of 31.8%.
Author – SEC EDGAR Data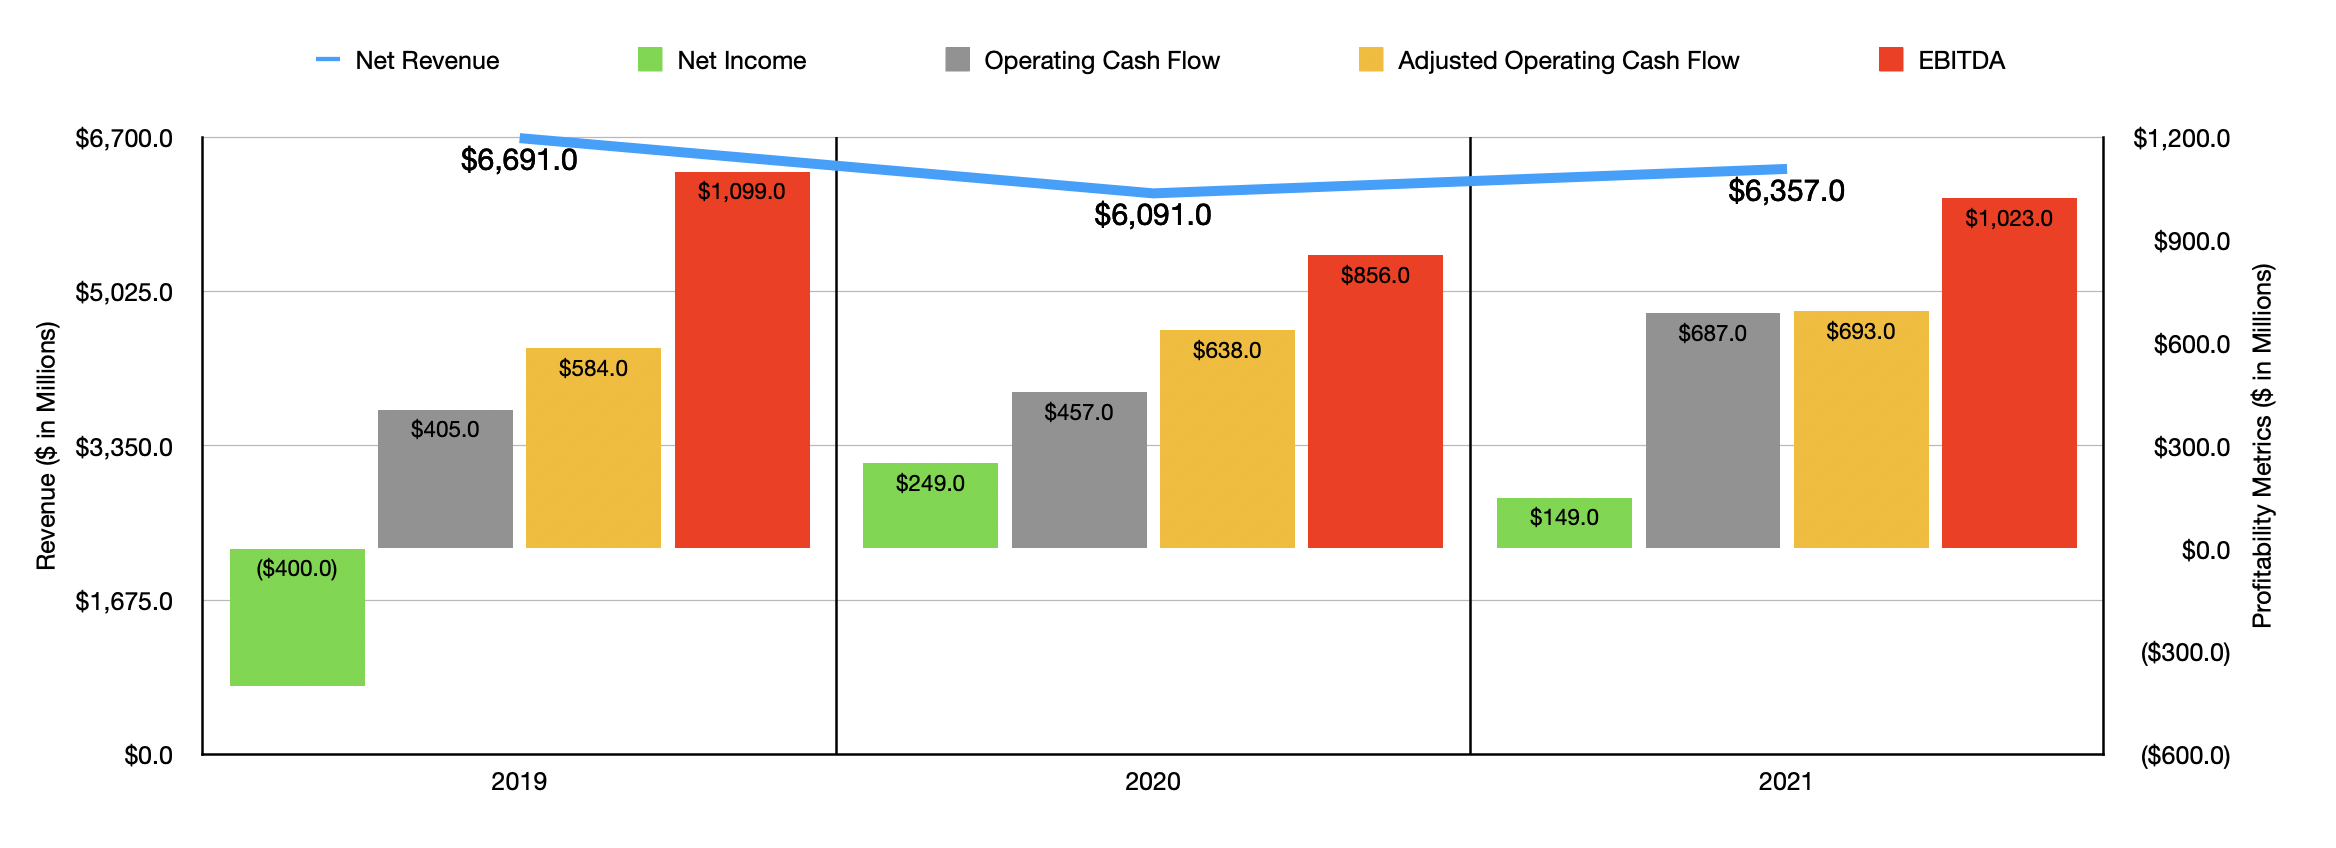
Much of this return disparity can be justified when looking at how the company has performed recently. For starters, let’s touch on financial results covering the company’s 2021 fiscal year. During that year, revenue came in at $6.36 billion. This was 4.4% higher than the $6.09 billion generated in 2020. Which really fascinating about this is that the revenue increase came even though the company sold off its ANZ business in 2020 and sold off a plant in Argentina in 2021. In the Asia Pacific region alone, this caused the company to miss out on at least $281 million in revenue. On the whole, net sales were impacted positively by favorable effects associated with foreign currency exchange rates and by higher pricing that it was able to push onto its customers.
Results on the bottom line during this time were somewhat mixed. For instance, net income for the company did fall, dropping from $249 million to $149 million. At the same time, however, we saw operating cash flow jump from $457 million to $687 million. Even if we adjust for changes in working capital, the picture would have improved from $638 million to $693 million. Meanwhile, EBITDA of the company also increased, jumping from $856 million to $1.02 billion.
Author – SEC EDGAR Data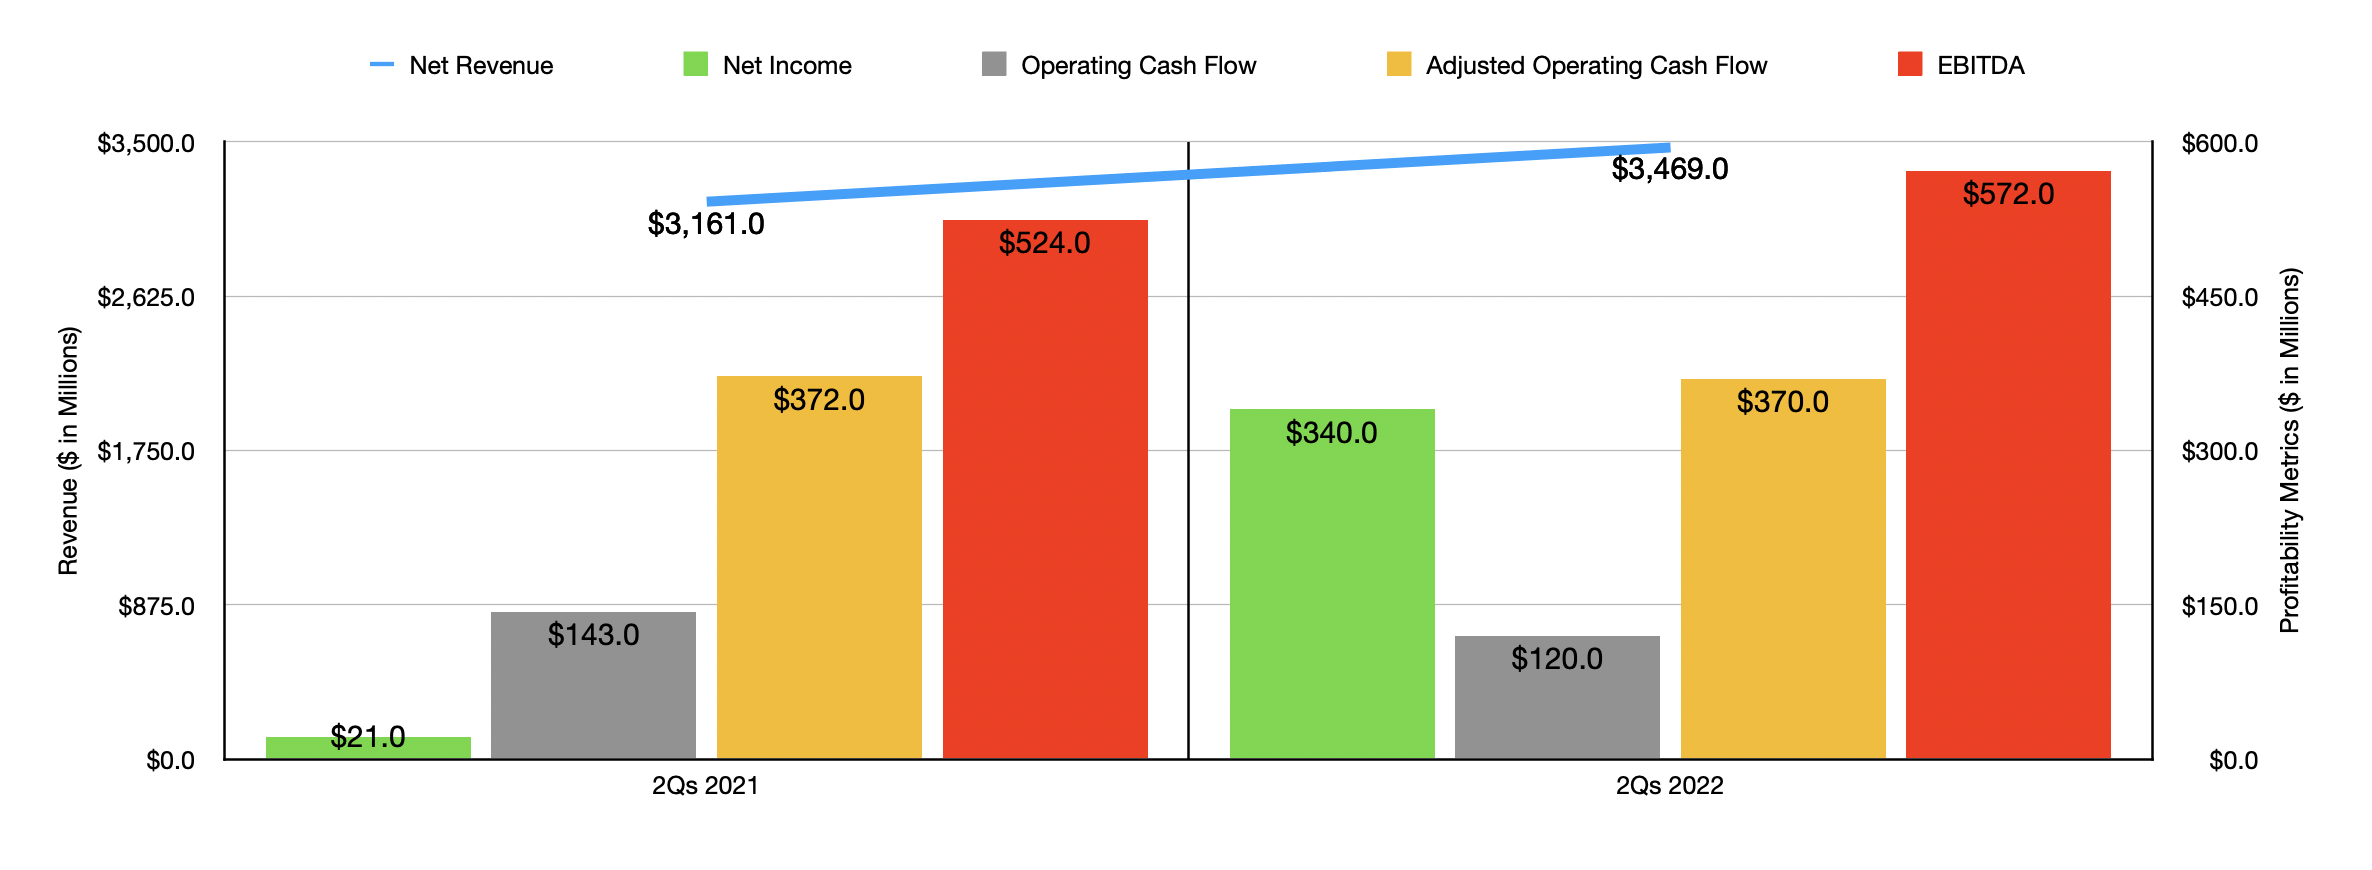
Strong but mixed performance for the company persisted into the 2022 fiscal year. Revenue during the first half of the year, for instance, came in at $3.47 billion. That’s 9.7% higher than the $3.16 billion generated the same time one year earlier. During this time, the company benefited to the tune of $348 million from price increases that it was able to push on to its customers. Higher sales volume and a change in product mix also contributed $72 million to the sales increase. These items were somewhat offset though by a $130 million impact associated with foreign currency translation and a $15 million impact associated with divestitures. The divestiture in question was of the Cristar glass tableware business that was completed in March of 2022.
Although revenue increased, not everything was great. While net income rose from $21 million in the first half of 2021 to $340 million the same time this year, operating cash flow fell from $143 million to $120 million. Even if we adjust for changes in working capital, the picture would have worsened modestly, with the metric falling from $372 million to $370 million. Meanwhile, EBITDA at the firm actually managed to rise, climbing from $524 million to $572 million. It should be mentioned that some of the profitability changes the company experienced were of items that management said would be only one time in nature. For instance, the company benefited in the first half of the year to the tune of $182 million from a gain on a sale-leaseback transaction it initiated. It also saw a $55 million gain on a divested business. This is why cash flow should be given more weight than earnings, in my view.
When it comes to 2022 as a whole, management expects earnings per share, on an adjusted basis, of between $2.10 and $2.25. This compares favorably to the prior expected range of between $2.05 and $2.20. At the midpoint, this should translate to net income of $345.7 million. Adjusted operating cash flow, which will add back a one-time charge associated with a trust settlement that the company had to pay out in July of this year totaling $620 million when combined with other related expenses, should come in this year at $775 million. No guidance was given when it came to other profitability metrics. But if we assume that EBITDA were to increase at the same rate that adjusted operating cash flow should, then we should anticipate a reading this year of $1.14 billion.
Author – SEC EDGAR Data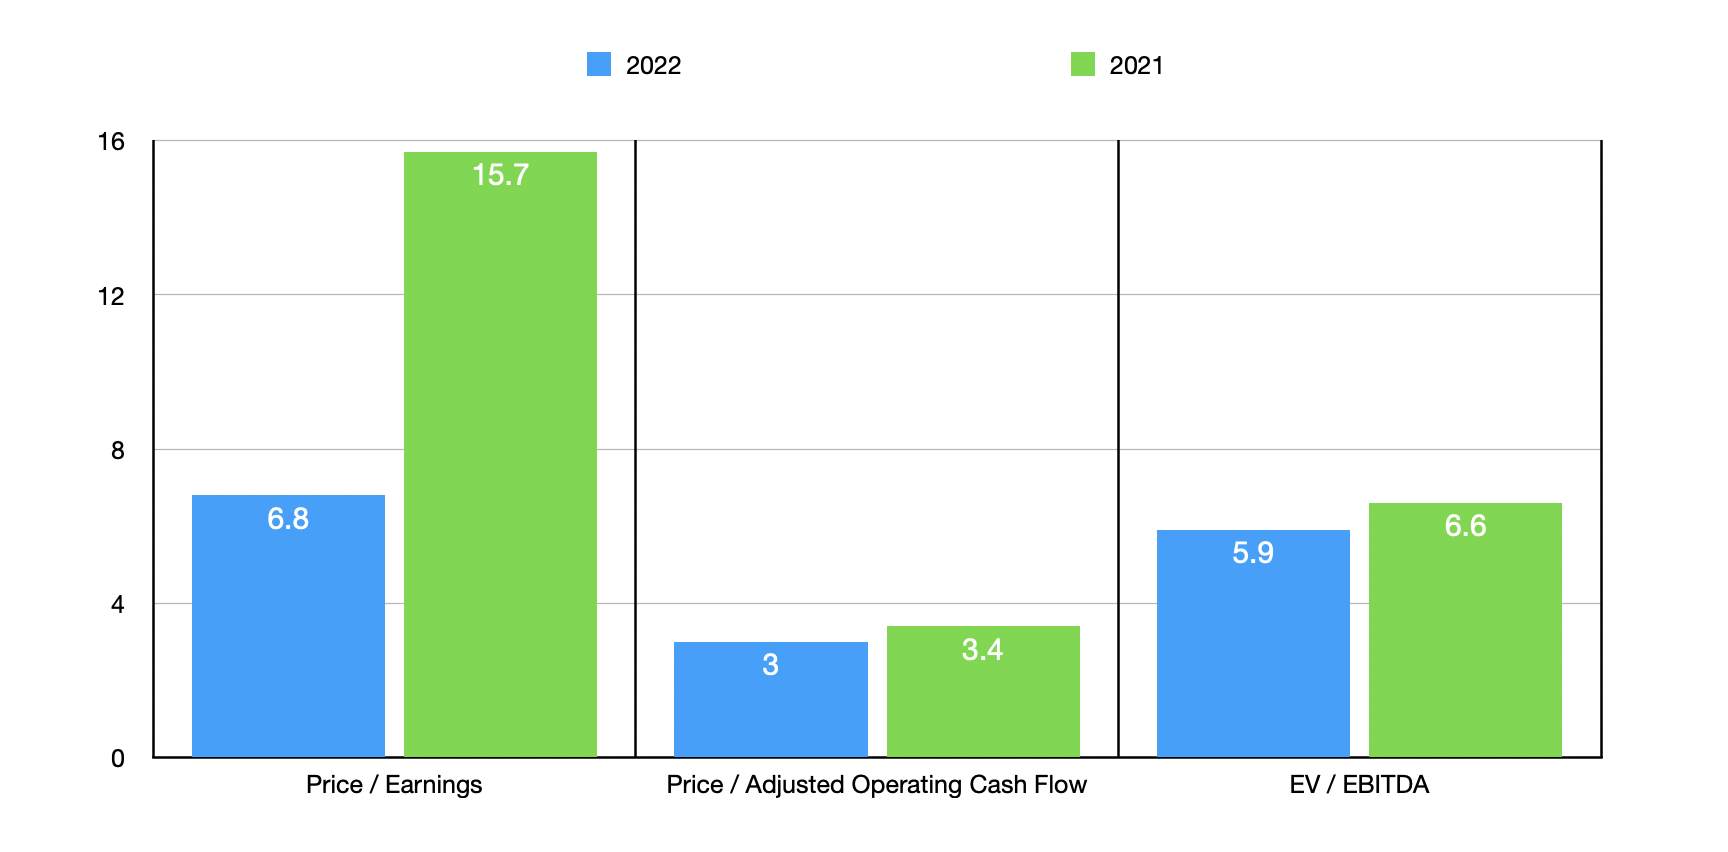
Taking these figures and factoring in the aforementioned trust settlement, we can calculate that the company is trading at a forward price to earnings multiple of 6.8, a forward price to adjusted operating cash flow multiple of 3, and a forward EV to EBITDA multiple of 5.9. These numbers compare to the 15.7, 3.4, and 6.6, readings that we get, respectively, using data from the 2021 fiscal year. As part of my analysis, I compared the 2021 data to the 2021 data of five similar firms. On a price-to-earnings basis, these companies ranged from a low of 9.2 to a high of 28. In this case, three of the five companies are cheaper than O-I Glass. Using the price to operating cash flow approach, the range is between 9.1 and 16.2, while the EV to EBITDA approach gives a range of between 7.2 and 13.5. In both of these cases, our prospect is the cheapest of the group.
| Company | Price / Earnings | Price / Operating Cash Flow | EV / EBITDA |
| O-I Glass | 15.7 | 3.4 | 6.6 |
| Greif (GEF) | 9.2 | 9.1 | 7.2 |
| TriMas (TRS) | 28.0 | 11.9 | 13.5 |
| Myers Industries (MYE) | 21.8 | 16.2 | 11.4 |
| Silgan Holdings (SLGN) | 13.3 | 8.6 | 9.6 |
| Berry Global Group (BERY) | 14.1 | 10.6 | 9.2 |
Takeaway
At this point in time, it seems to me as though the worst has passed for O-I Glass. The company recently completed a $1.5 billion asset optimization plan aimed at unloading noncore assets. Yes, the company does still have a significant amount of debt on hand. But cash flows are robust and shares look attractively priced. I do believe that much of the easy upside has already been captured. So at this point, a ‘strong buy’ rating no longer makes sense. But I do still think a solid ‘buy’ rating does at this time.
Be the first to comment