

HJBC
Introduction
France-based TotalEnergies SE (NYSE:TTE) released its second-quarter 2022 results on July 28, 2022.
Note: I have followed TTE quarterly since 2017 with 22 articles and counting. This new article is a quarterly update of my article published on June 12, 2022.
CEO Patrick Pouyanné said in the conference call:
the environment is obviously very supportive, the price of oil, the price of European gas, the price of LNG and the refining margins for this quarter. It is the first time in 25 years in the industry that I am observing such an environment where all segments of our company are benefiting at the same time of strong prices or margin.
1 – 2Q22 results snapshot
TotalEnergies reported a second-quarter 2022 adjusted net income of $9.796 billion, beating analysts’ expectations. It was well above the year-ago $3.6 billion realized last year.
The total revenues came in at $74.774 billion, up 58.9% from $47.049 billion in the year-ago quarter. Substantial revenues were generated from record-high liquids and gas prices.
Second-quarter upstream equivalent production averaged 2,738k Boep/d, down slightly from 2,747K Boep/d realized last year. The company expects production to remain stable for the full year.
The production of the iGRP segment (Integrated Gas, Renewables, and Power) was 462K Boep/d compared to 502K Boep/d in 2Q21.
2 – Investment Thesis
As I have indicated for many years, TotalEnergies SE is one of my long-term preferred oil investments. TotalEnergies SE is one of the few European oil majors that has paid a stable dividend even during the last oil crash. The company is paying a quarterly dividend of €0.69 per quarter in 2Q22.
TotalEnergies SE continues to be a large oil and gas producer but is also shifting to renewables, representing a large part of its business in the future.
The transition has been done smoothly so far, and while focusing on its traditional oil and gas business, the company is expanding its presence in the “green electricity generation.” The recent rally in the oil prices allowed TTE to strengthen its balance sheet and simplify this transition.
However, oil prices have retraced significantly from their recent high, and I expect a lot of volatility for the remaining 2022.
Thus, it is essential to trade short-term LIFO about 30%-40% of your TTE holding and keep a long-term core position for a higher target. This dual strategy entitles you to take full advantage of the oil and gas sector’s high volatility and inherent cyclicity. It is what I recommend in my marketplace, “The Gold and Oil Corner.”
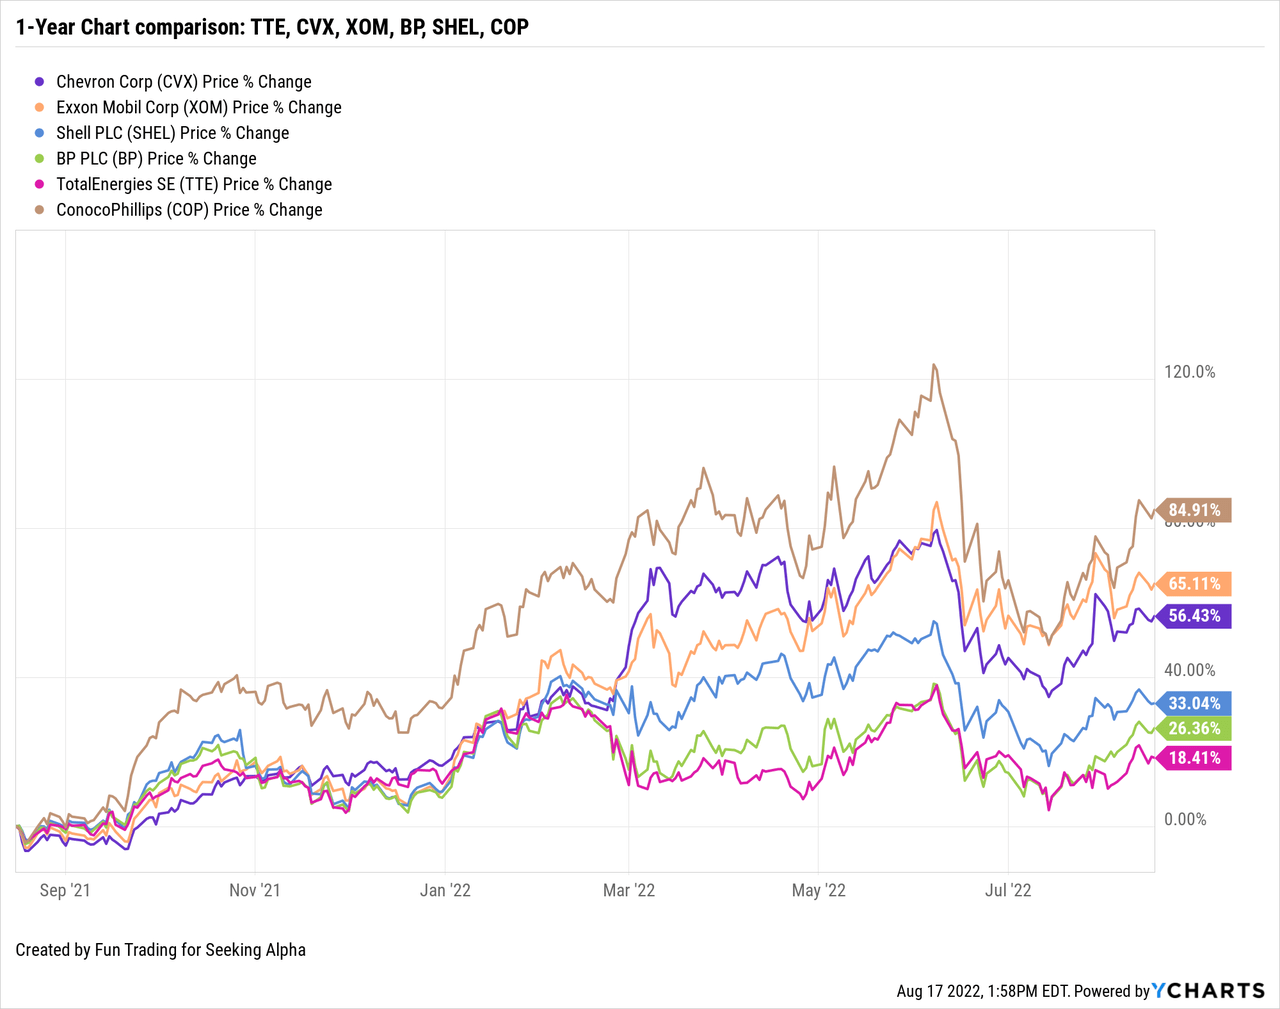
3 – Stock performance
TotalEnergies has underperformed the group, which includes Shell (SHEL), Equinor (EQNR), U.K.-based BP (BP), as well as US majors Chevron (CVX), Exxon Mobil (XOM), and the large E&P ConocoPhillips (COP).
TotalEnergies SE is up 18% on a one-year basis despite a massive rally in oil prices. This performance pales in comparison to ConocoPhillips, up now 85%.
4 – Dividend comparison with its peers – TTE pays a quarterly dividend of €0.69 per share.
TTE Quarterly Dividend comparison TTE, SHEL, XOM, BP, CVX, COP (Fun Trading)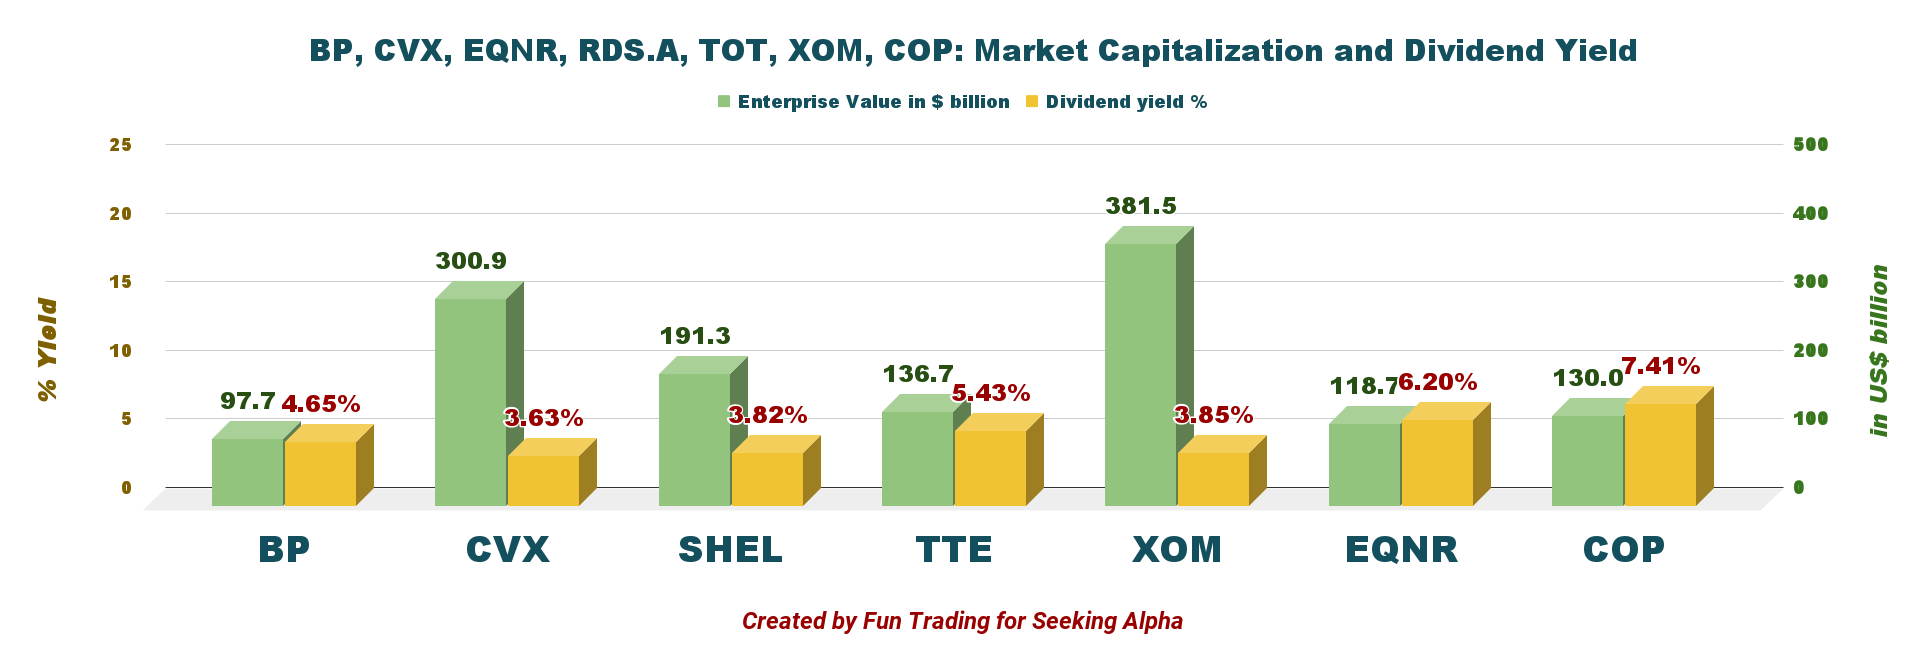
TotalEnergies: Balance Sheet and Production in 2Q’22: The Raw Numbers
Note: TTE is an American Deposit Receipt or ADR. The Foreign withholding taxes reduce the dividend paid to American investors is 12.8%. However, the foreign tax paid can be deducted from your income tax. Sometimes, your broker charges you 25%, but I believe it is a mistake. Ask your Financial Adviser about your case.
| TotalEnergies SE | 2Q21 | 3Q21 | 4Q21 | 1Q22 | 2Q22 |
| Total Revenues in $ Billion | 47.05 | 54.73 | 60.35 | 68.61 | 74.77 |
| Total Revenues (minus excise tax) in $ Billion | 41.63 | 49.07 | 55.30 | 63.95 | 70.45 |
| Net income in $ Billion | 2.21 | 4.65 | 5.84 | 4.94 | 5.69 |
| EBITDA $ Billion | 7.70 | 11.26 | 14.26 | 14.90 | 14.98 |
| EPS diluted in $/share | 0.80 | 1.71 | 2.17 | 1.85 | 2.16 |
| Cash from operating activities in $ Billion | 7.55 | 5.64 | 11.62 | 7.62 | 16.28 |
| Capital Expenditures in $ Billion | 2.68 | 2.72 | 4.54 | 3.46 | 5.15 |
| Free Cash Flow in $ Billion | 4.89 | 2.92 | 7.08 | 4.16 | 11.13 |
| Total Cash $ Billion | 33.05 | 32.88 | 33.66 | 38.69 | 40.71 |
| Long-term Debt in $ Billion | 69.31 | 67.28 | 64.55 | 64.80 | 65.87 |
| Dividend per share in €/sh (including tax 12.8%) |
0.66€ |
0.66€ |
0.66€ |
0.69€ |
0.69€ |
| Shares outstanding (diluted) in Billion | 2.758 | 2.701 | 2.690 | 2.644 | 2.611 |
| Oil Production | 2Q21 | 3Q21 | 4Q21 | 1Q22 | 2Q22 |
| Oil Equivalent Production in K Boep/d | 2,747 | 2,814 | 2,852 | 2,843 | 2,738 |
| Americas Production in K Boep/d | 378 | 372 | 363 | 386 | 420 |
| Average price liquids $/Boe | 62.9 | 67.1 | 79.8 | 90.1 | 102.9 |
| Average gas price $/Mbtu | 4.43 | 6.33 | 11.38 | 12.27 | 11.01 |
Source: Company filings and Fun Trading
Note: More data (2015) are available for subscribers only.
Analysis: Balance sheet and production discussion
1 – Total revenues were $74.774 billion (including excise tax) in 2Q22
TTE Quarterly Revenues history (Fun Trading)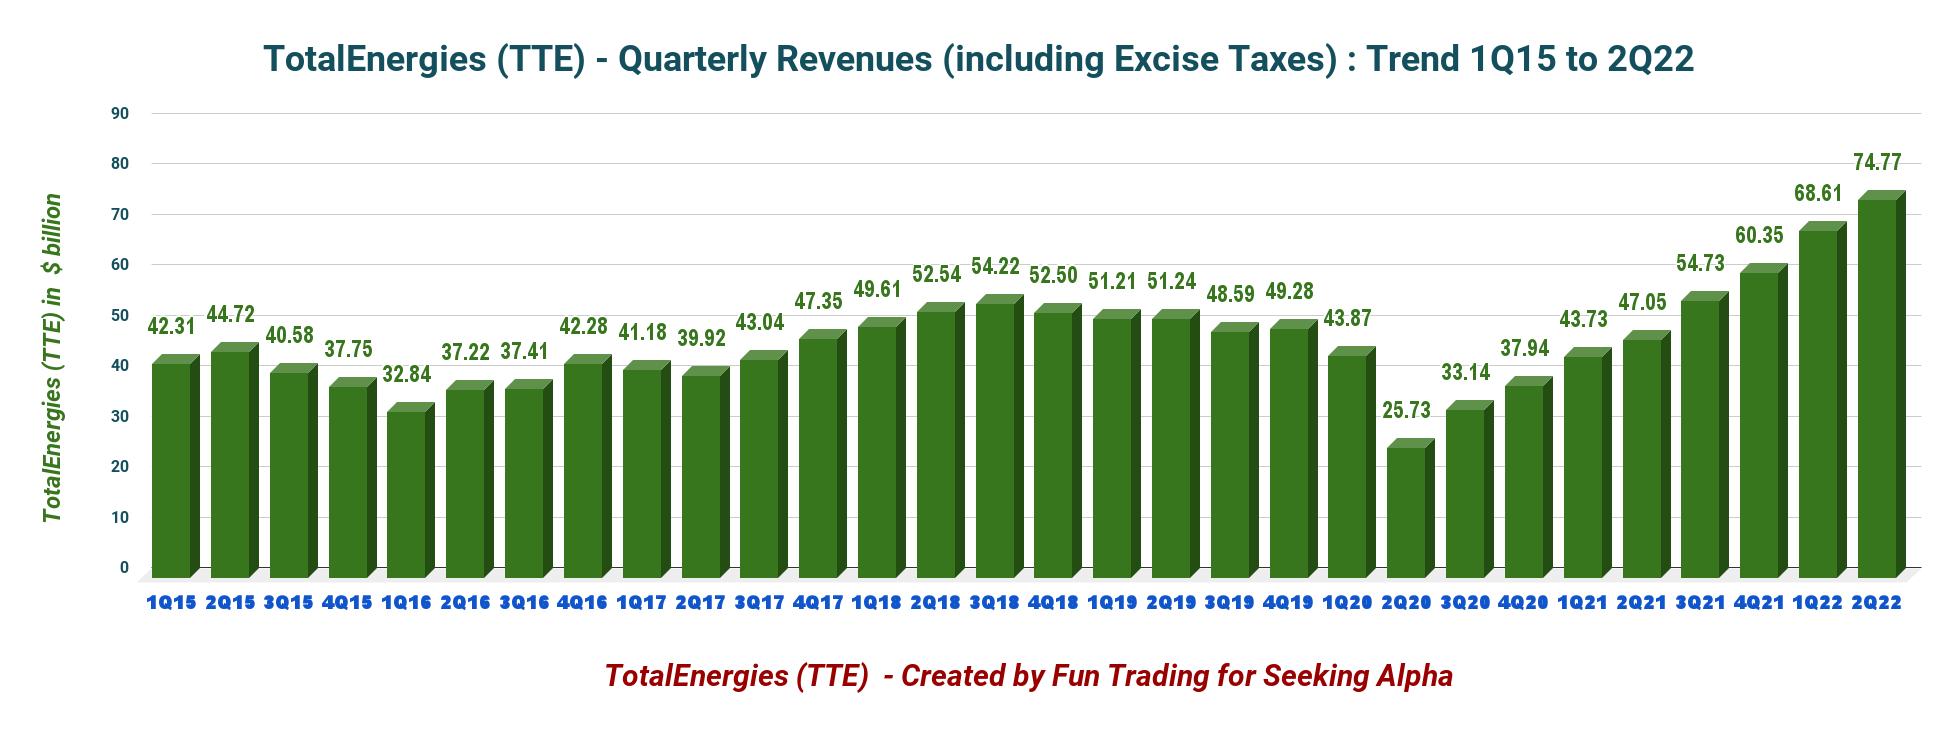
Net earnings were $5.692 million, up from $2.206 million in 2Q21. The company indicated a profit of $2.16 per diluted share. The adjusted EBITDA was $18,737 million, up from $8,667 million last year. Finally, adjusted net income was $9,796 million in 2Q22 compared to $3,463 million in 2Q21.
TotalEnergies acquired $2,464 million worth of assets (primarily payments to Petrobras) and sold assets for $388 million in 2Q22.
Below is a history of the cash flow from operations since 2015.
TTE Quarterly Cash from operations history (Fun Trading)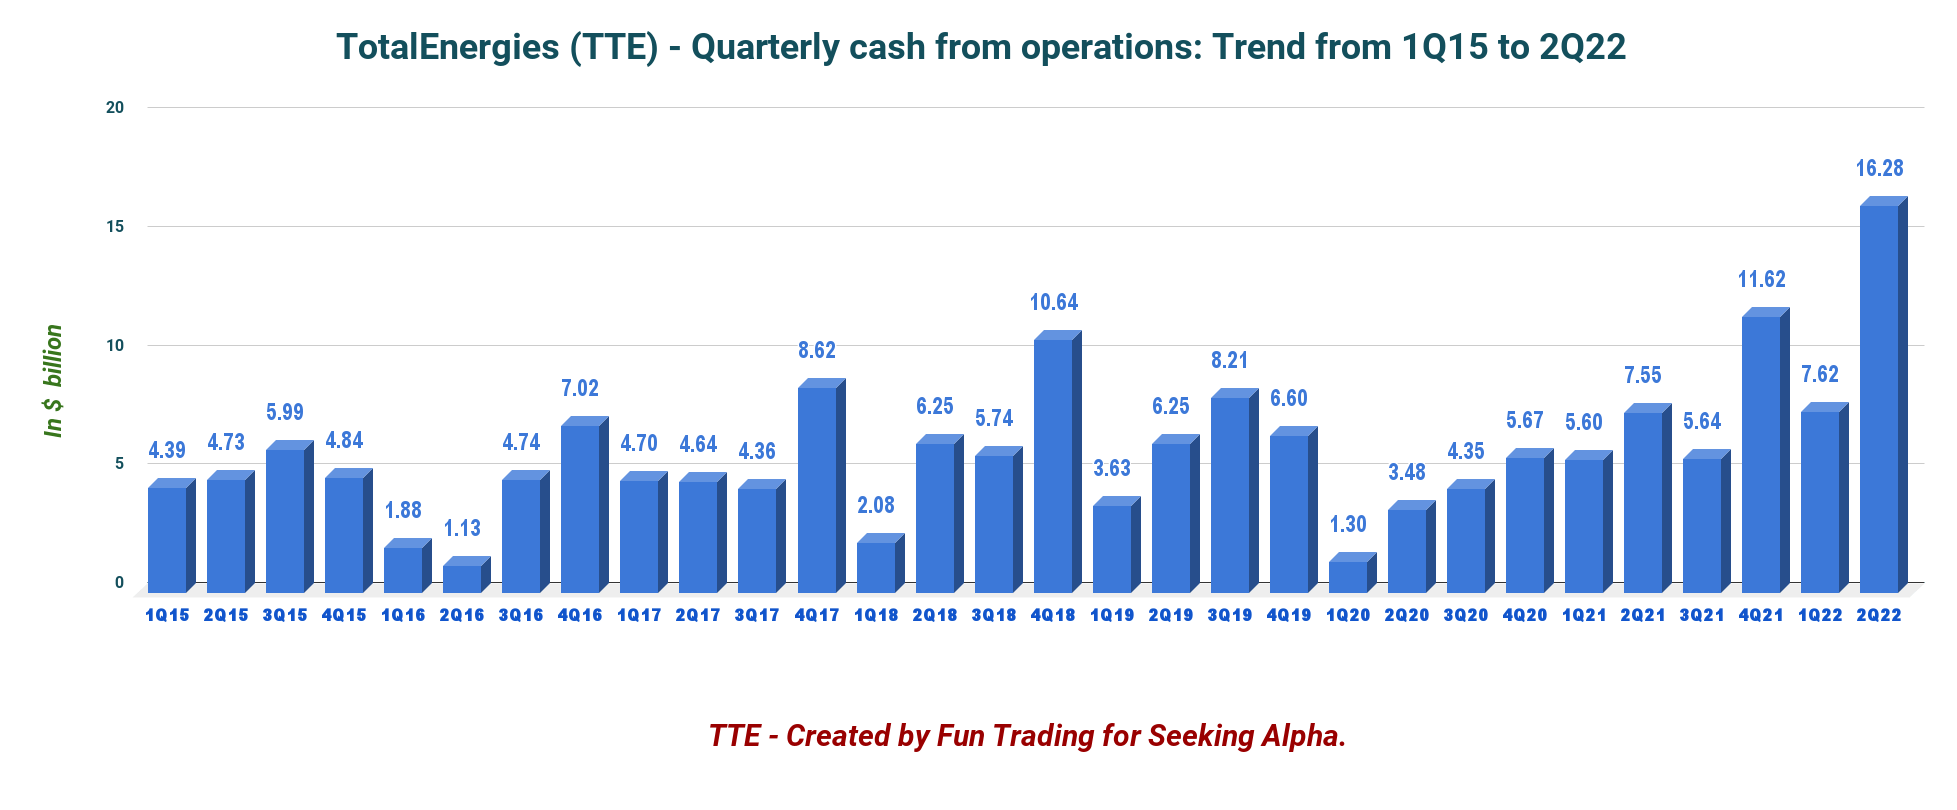
2 – Trailing 12-month free cash flow (“ttm”) was $25.30 billion with $11.13 billion in 2Q22
TTE Quarterly Free cash flow history (Fun Trading)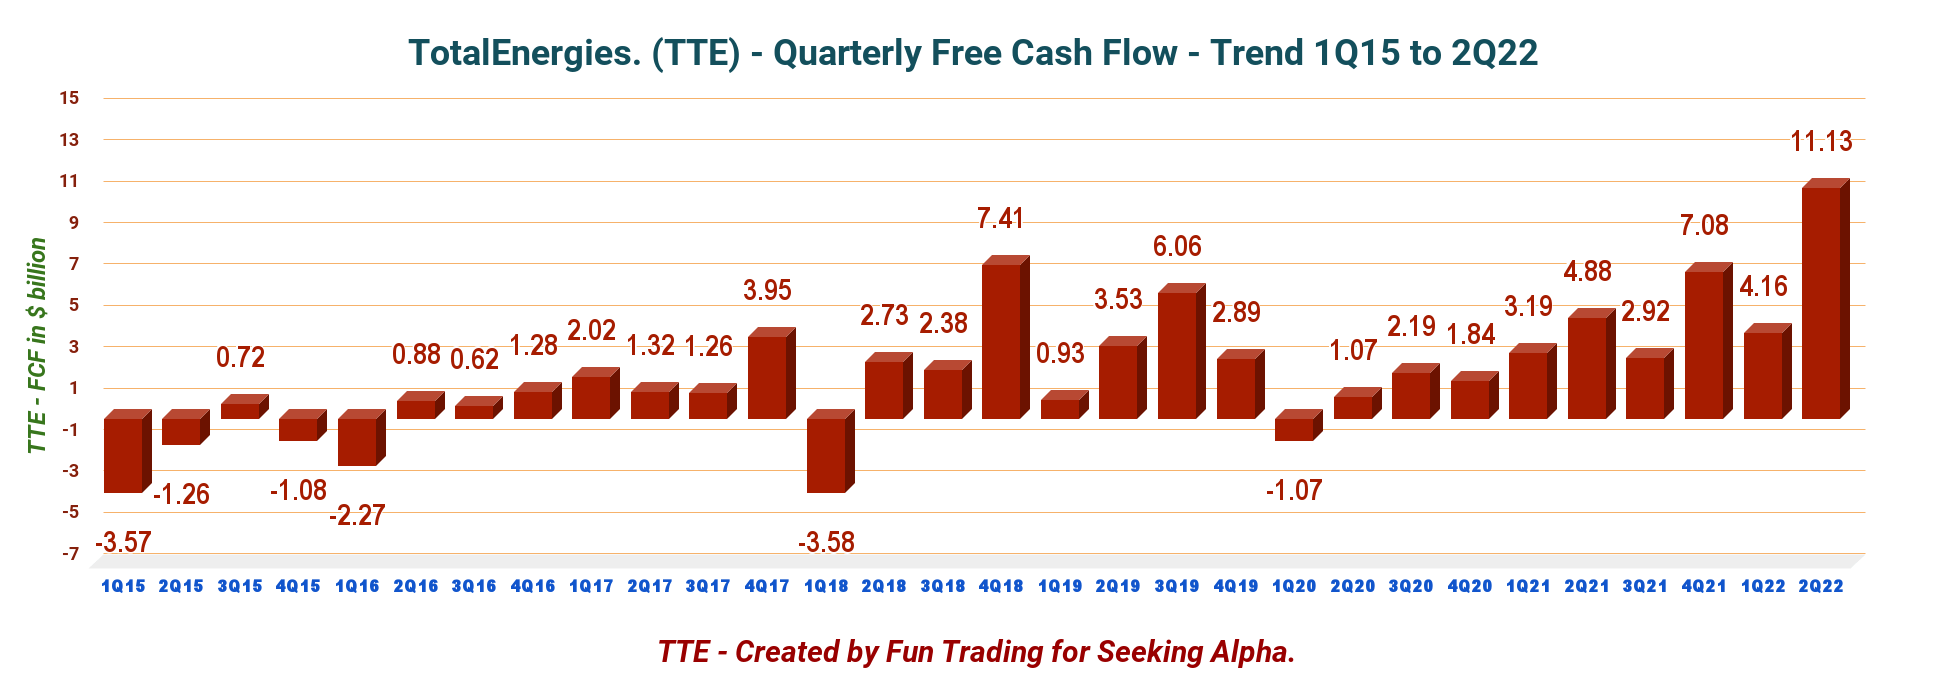
TotalEnergies trailing 12-month Free cash flow is now $25.30 billion, with $11.13 billion realized for 2Q22.
The company pays about ~$7.4 billion in dividends annually, primarily covered by free cash flow.
TotalEnergies announced a quarterly dividend of €0.69 ($~0.705).
TTE Quarterly dividend history (Fun Trading)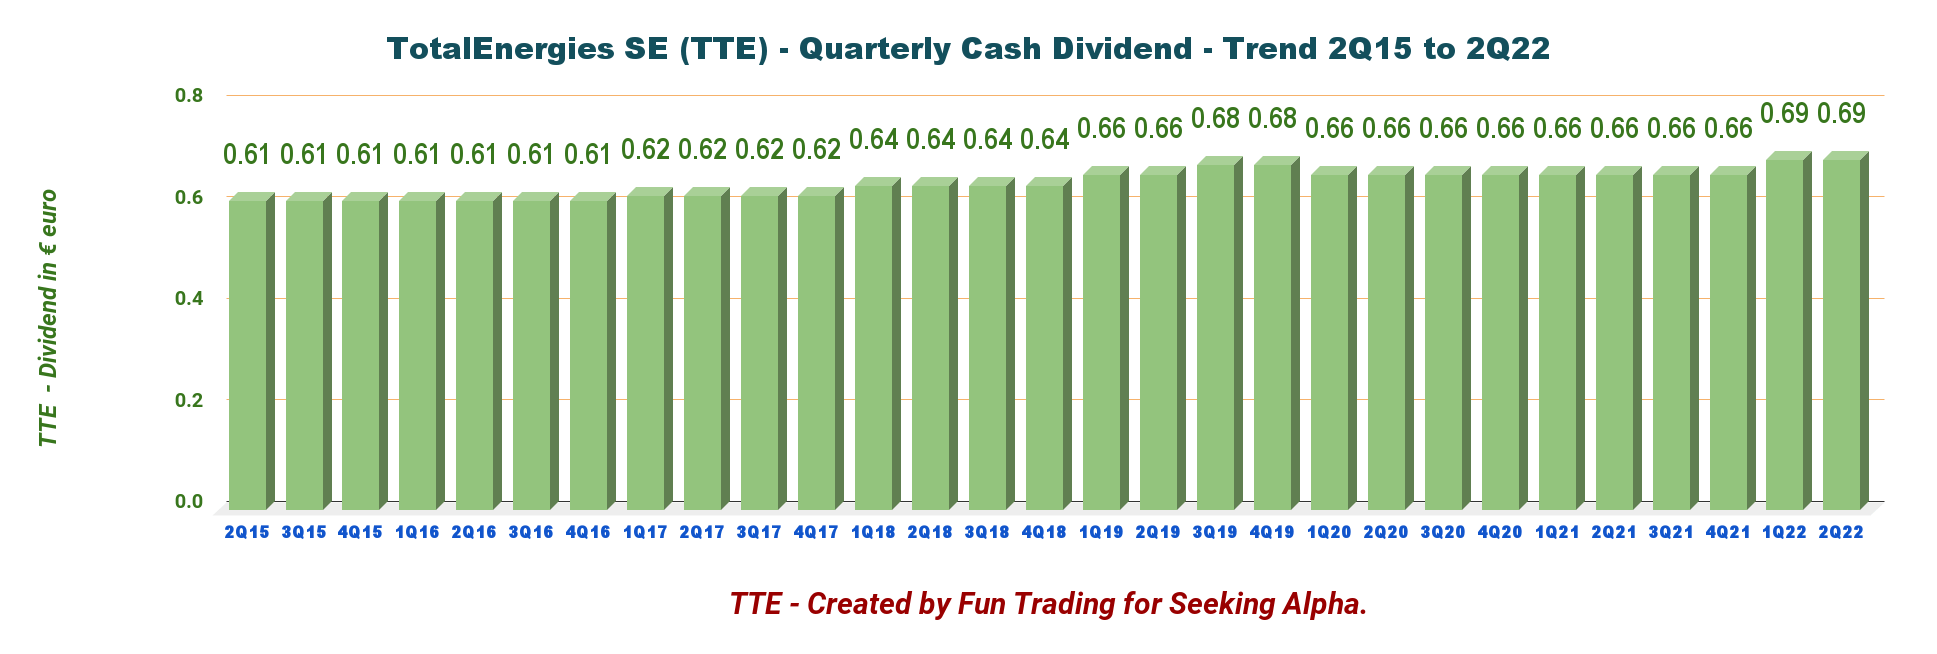
3 – Net debt was $25.16 billion as of the end of June 2022
TTE Quarterly Cash versus Debt history (Fun Trading)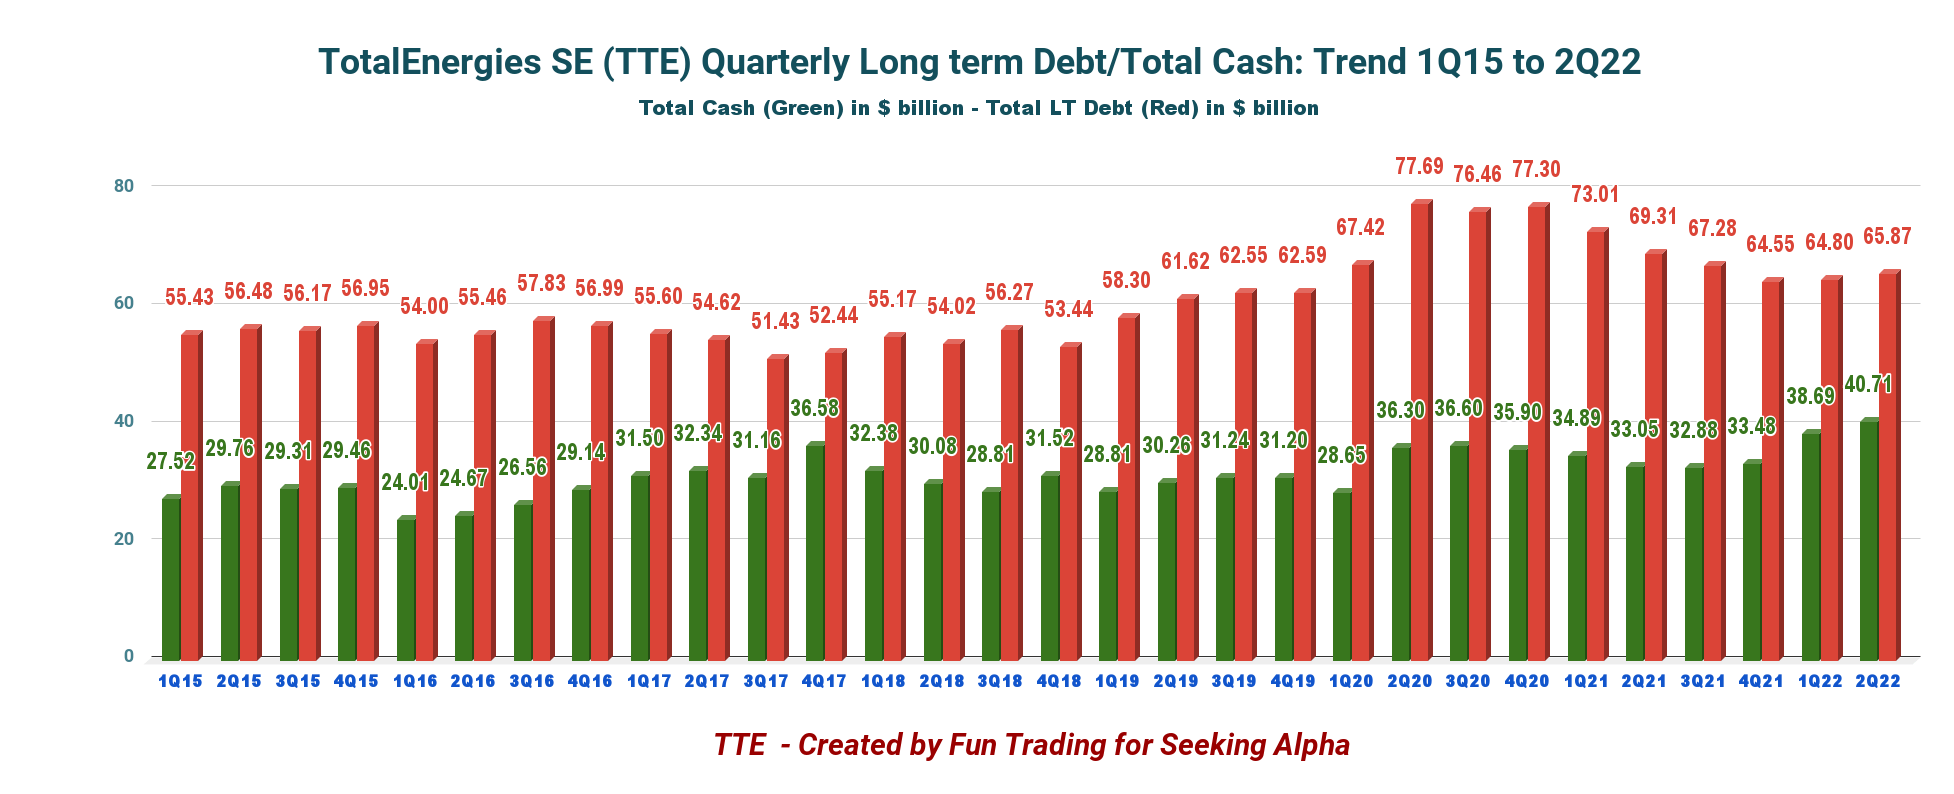
The debt-to-equity ratio is now 0.54, according to YCharts, and the net debt to capital was down to 9.8% at quarter-end.
TTE indicates a net debt of $12.972 billion using another method (page 19). I have done a more general calculation from the LT Debt, including current minus total cash, which is a more comparable value with other oil majors.
4 – Details: TTE operates four different segments
Total operating income was $9,458 million this quarter, up from $3,487 million last year.
TTE Quarterly operating income per segment 2Q21 versus 2Q22 (Fun Trading)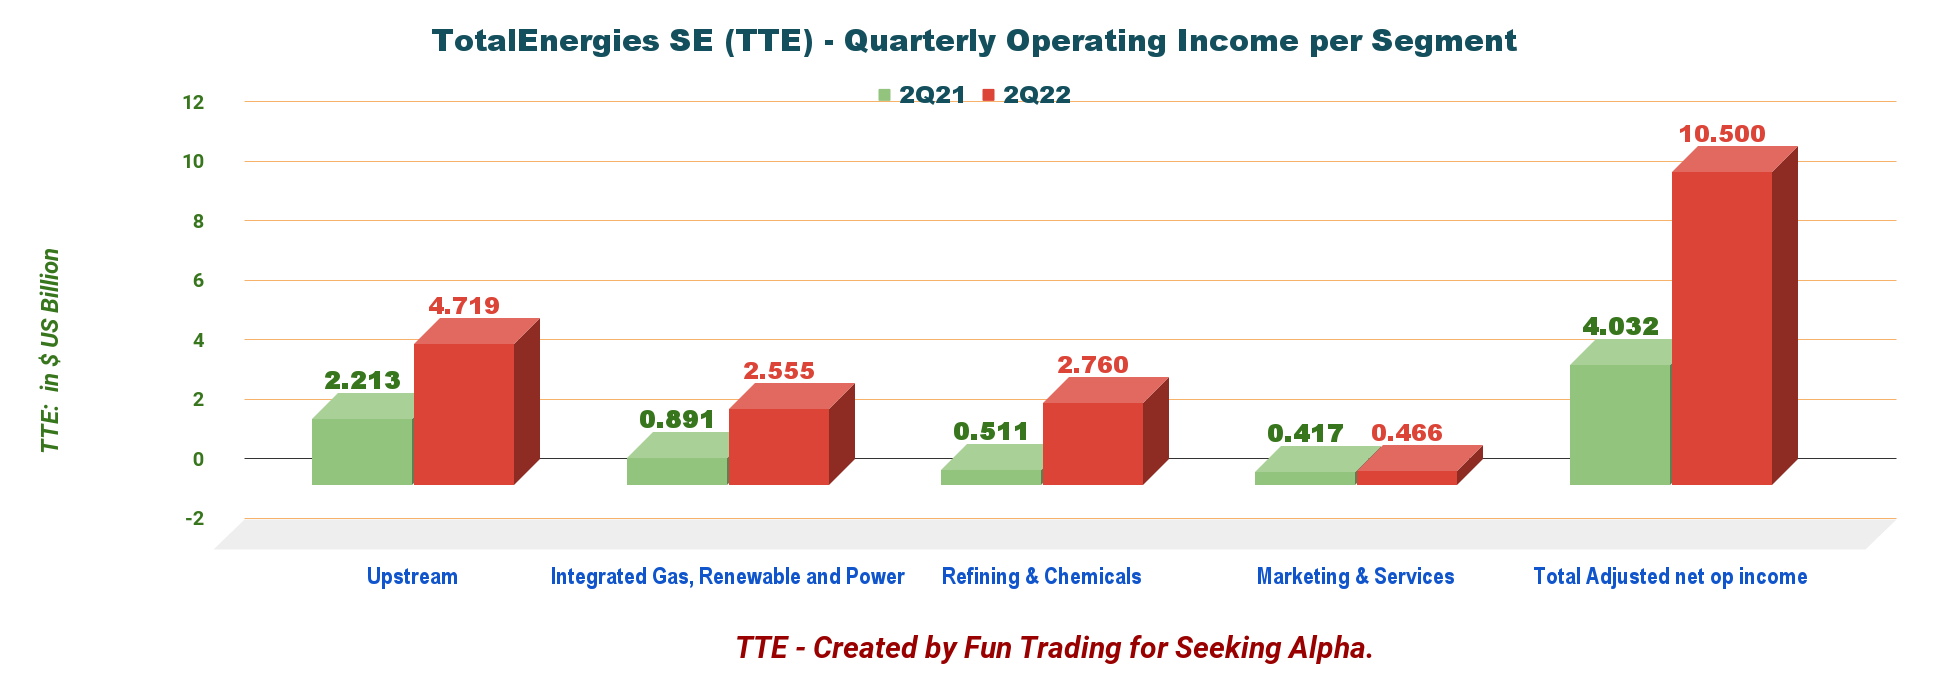
4.1 – Exploration & Production (Upstream)
The operating gain was $4,719 million, up significantly from $2,213 million last year. High operating gain this quarter despite a decrease in oil equivalent production due to planned maintenance and security cuts in Nigeria.
4.2 – Integrated Gas, Renewable, and Power
Operating income was $2,555 million, from $891 million last year.
4.3 – Refining and Chemicals
Operating income was $2,760 million from $511 million in the year-ago quarter. Downstream benefitted from an exceptionally high refining margin this quarter.
4.4 – Marketing and Services
Operating income was $417 million, down from $466 million in 2Q21.
5 – 2Q22 Oil Equivalent Production up to 2,738K Boep/d from 2,747K Boep/d last year.
5.1 – Oil equivalent production history
TTE Quarterly oil equivalent production history (Fun Trading)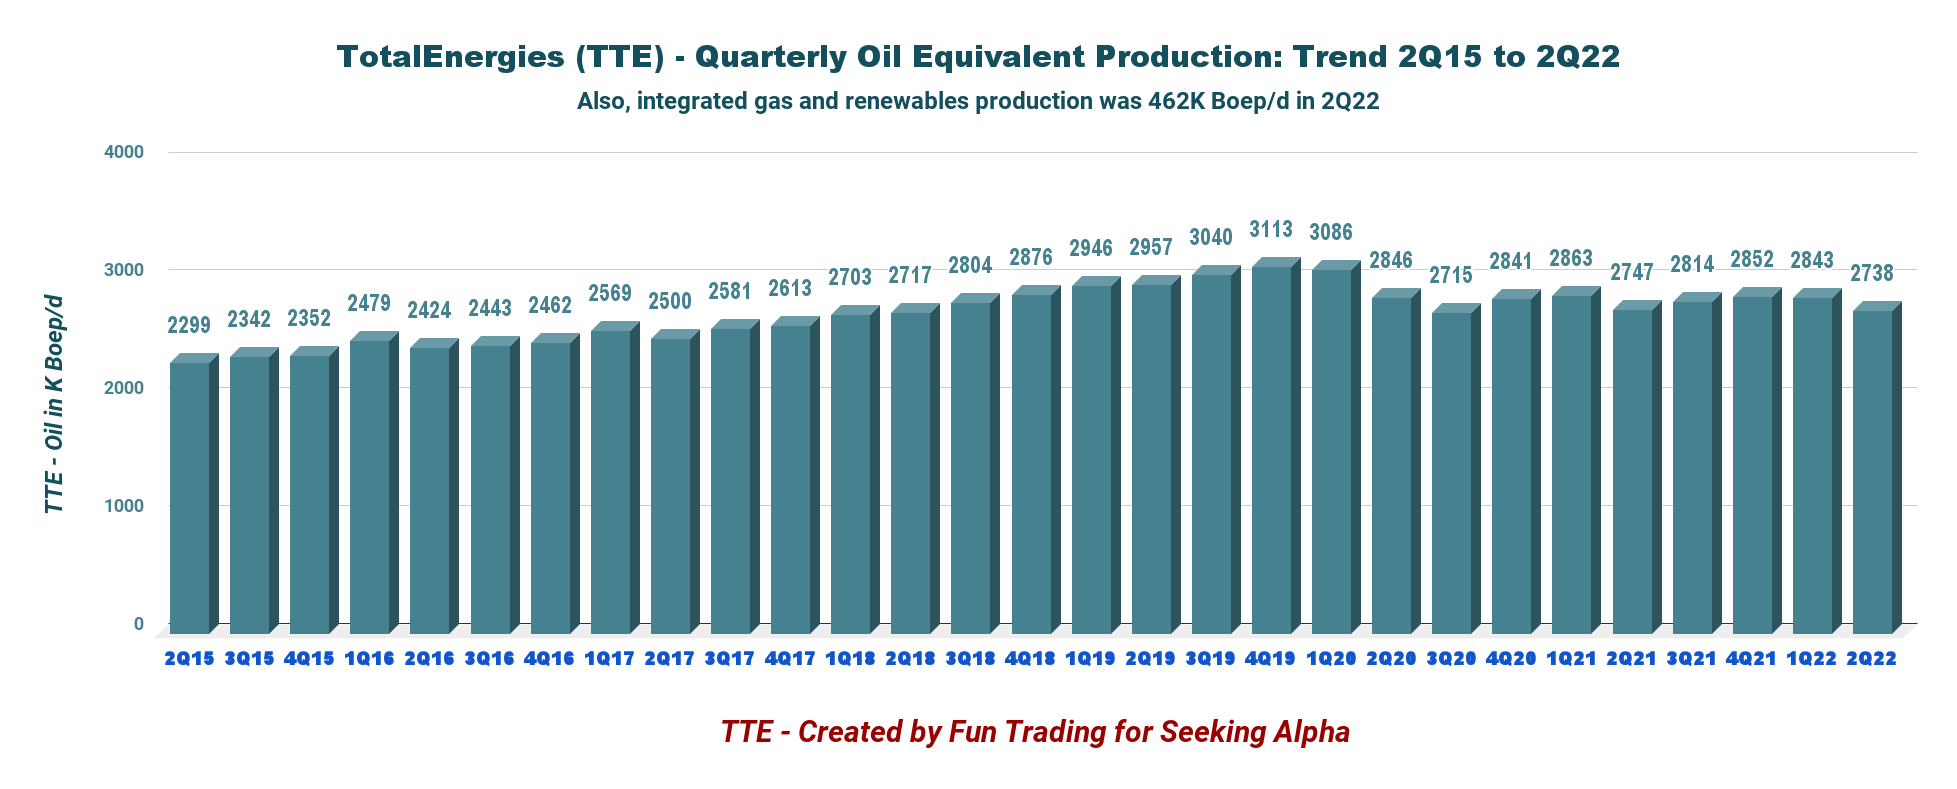
Note: The total production, including iGRP (Integrated Gas, Renewables, and Power), was 3,200K Boep/d.
TTE liquids price history (Fun Trading)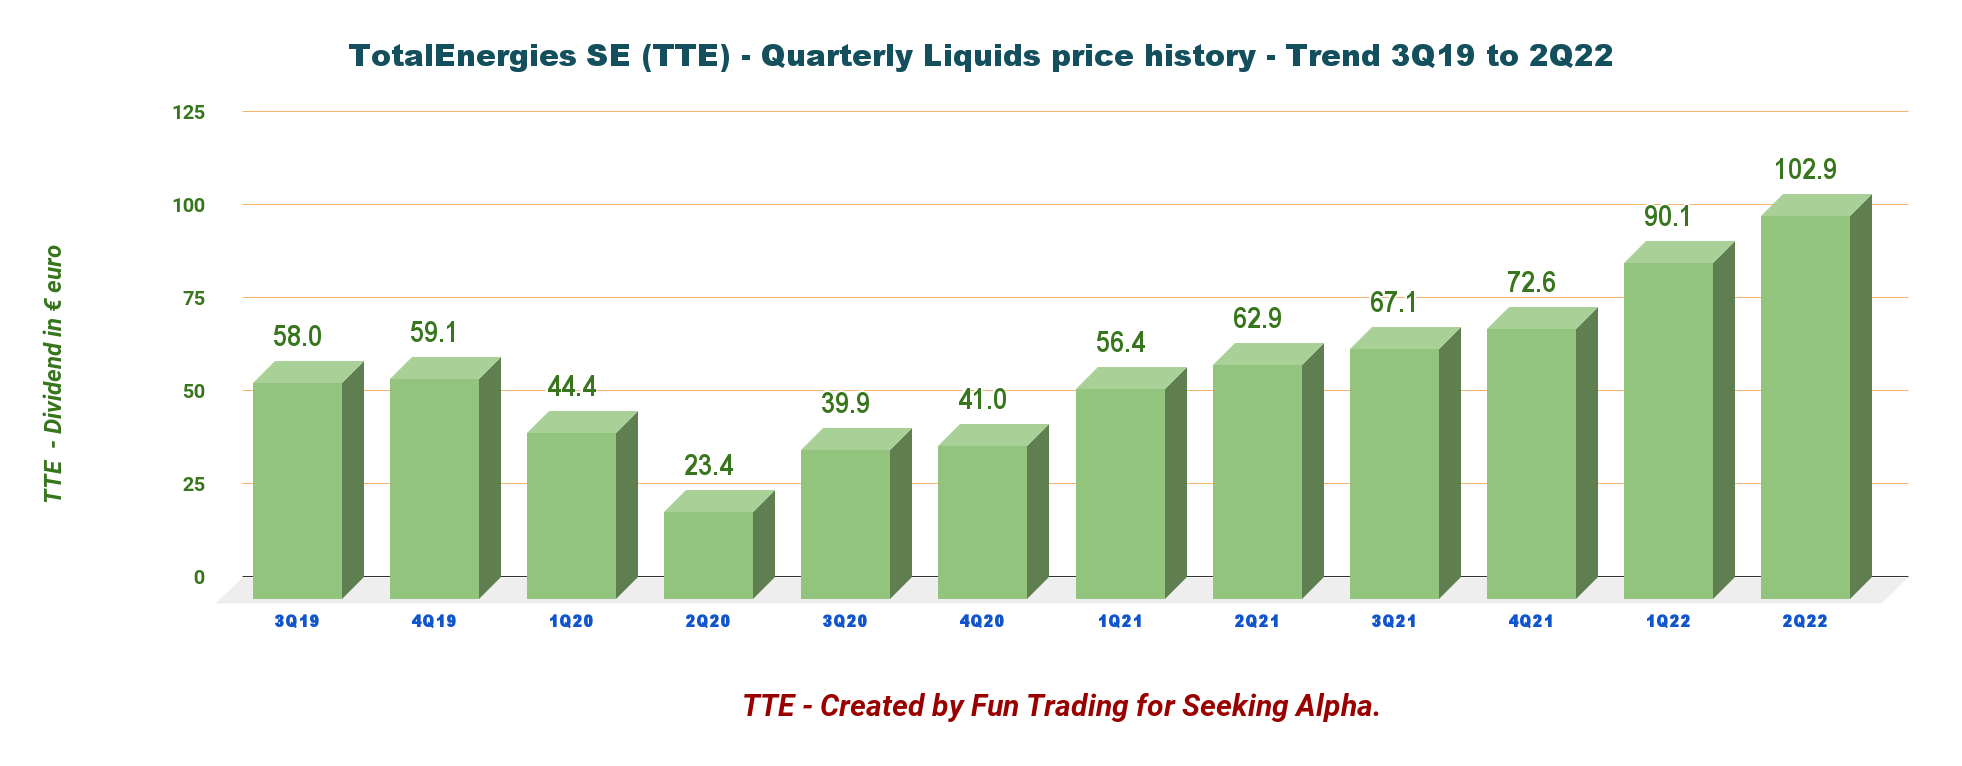
The realized gas prices increased from a year-ago quarter of $4.43 to $11.01 per thousand British thermal units in Q2.
Upstream output comes primarily from Europe and the Middle East. Total SE has a small production from the Americas.
TTE Quarterly oil production per Region in 2Q22 (Fun Trading)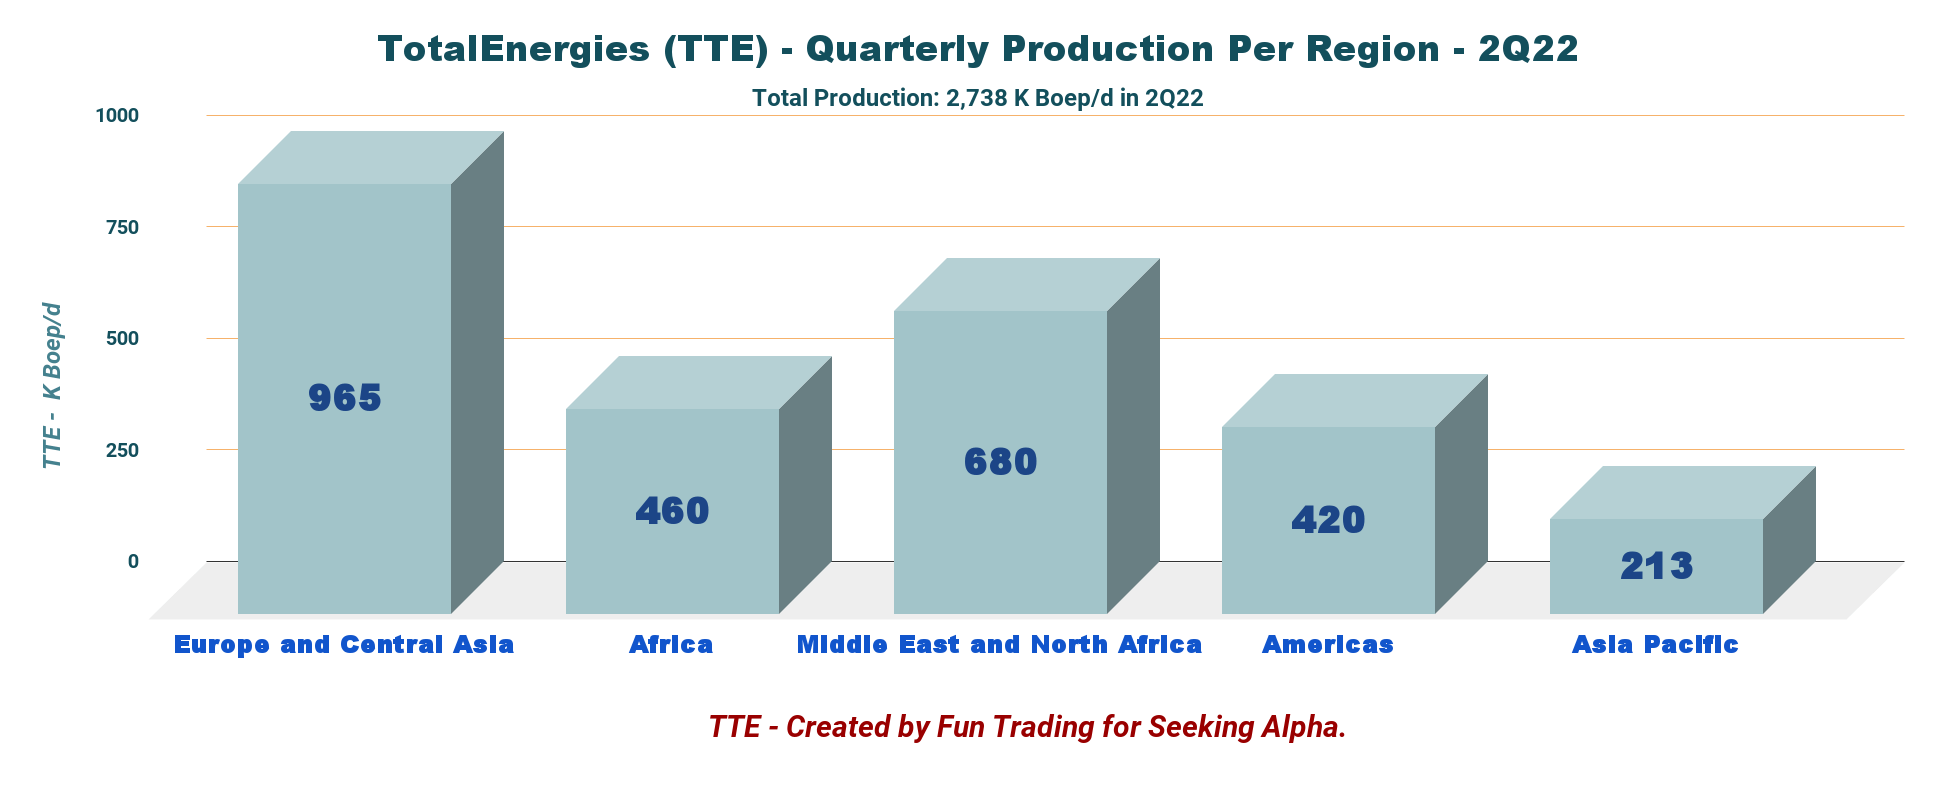
5.2 Renewable by 2025 (unchanged): The goal is to deliver 35 GW
The company expects to be a significant player by 2025 with 35 GW by 2025.
TTE Guidance 2025 (TTE Presentation)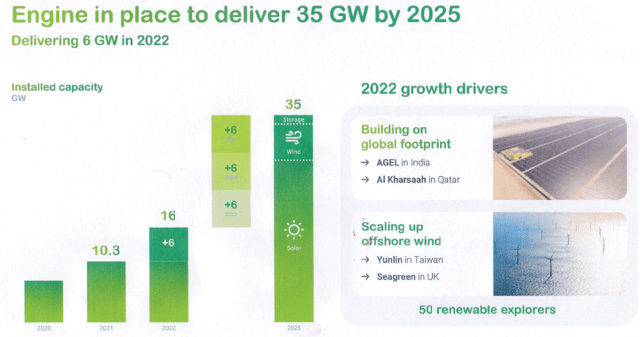
Technical Analysis and Commentary
TTE TA Chart short-term (Fun Trading)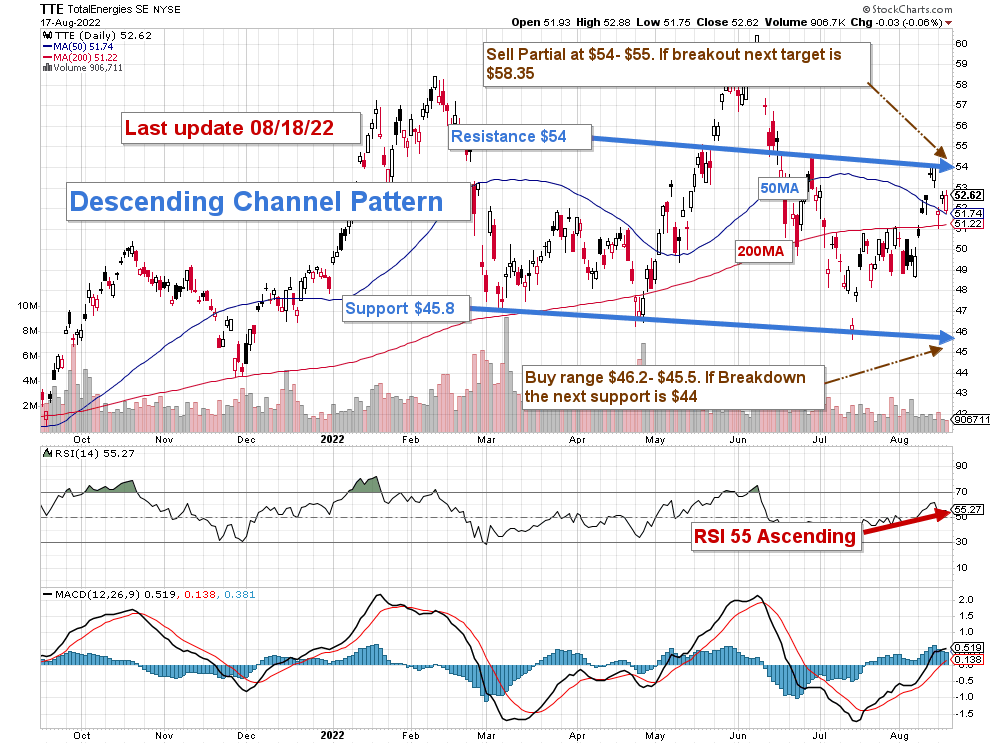
TTE forms a descending channel pattern (short-term) with resistance at $54 and support at $45.8.
The trading strategy is to sell about 30%-40% of your position LIFO between $54 and $55 and wait for a retracement between $46.2 and $45.50 with potential lower support at $44.
If oil prices turn bullish again and trade above $100, TTE could eventually breakout and re-test $58.35, but I do not see it as very likely.
Note: The LIFO method is prohibited under International Financial Reporting Standards (IFRS), though it is permitted in the United States by Generally Accepted Accounting Principles (GAAP). Therefore, only US traders can apply this method. Those who cannot trade LIFO can use an alternative by setting two different accounts for the same stock, one for the long term and one for short-term trading.
Warning: The TA chart must be updated frequently to be relevant. It is what I am doing in my stock tracker. The chart above has a possible validity of about a week. Remember, the TA chart is a tool only to help you adopt the right strategy. It is not a way to foresee the future. No one and nothing can.
Author’s note: If you find value in this article and would like to encourage such continued efforts, please click the “Like” button below to vote for support. Thanks.
Be the first to comment