

ijeab
The dominant force in the markets this year has been uncertainty. Uncertainty around interest rates, inflation, and a myriad of other factors have driven investors into overdrive to figure out the playbook for changing times. REITs have not been spared from the market turbulence, but we see the long-term value proposition for REITs at one of the most attractive levels in recent memory. From a high level, REITs provide predictability amid an ambiguous economic backdrop. Today’s publication will run through our thoughts at a deeper level, but in our view, it all boils down to balance sheet flexibility.
REITs spent the COVID years laser-focused on their balance sheets, lowering absolute leverage levels, opportunistically taking advantage of low rates, reducing floating rate debt, and lengthening out the weighted average maturity of their debt. These actions have mitigated the negative impact on financial statements caused by the current market turbulence, and, as a result, REITs are in a position to benefit from these hard decisions. We believe this flexibility will allow REITs to: 1) remain more competitive than over-levered private competitors (whose leverage headwinds should also help REITs find attractive acquisition targets), 2) continue above-average and above-inflation dividend increases for years to come, and 3) weather any macro turbulence that pops into the market.
What is the Fed Doing?
All eyes have been on the Federal Reserve (the “Fed”) in 2022, which has as one of its mandates to influence Core PCE (a measure of inflation) toward a goal of 2%. As the Core PCE readings have been much higher than 2% (+4.8% most recently in June), the Fed can use its balance sheet and the Fed Funds Rate (the rate at which banks can borrow overnight from the Fed) to decelerate Core PCE toward the 2% goal. As of July 31, 2022, the ‘Fed Funds Rate’ rate has been hiked 4 times in an effort to alleviate rampant inflation (highlighted in Figure 1). While the Fed does not have the ability to change long term interest rates, such as the 10-year US Treasury yield, the changes in the Fed Funds Rate can cause a ripple effect that eventually reaches long term interest rates, thus affecting mortgage rates, asset prices, and risk appetite.
Bloomberg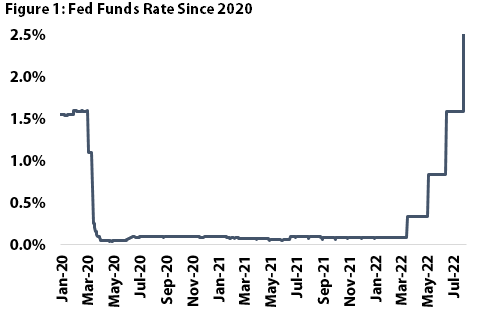
Rising Rate Impact
Interest rates are to companies as mortgage rates are to prospective home-buyers; as rates rise (as they have been recently), the cost of borrowing becomes increasingly expensive. Companies have historically been able to minimize the negative impact of rising rates through a laddered debt maturity which ensures that no year has prohibitive amount of debt maturing in it. Furthermore, REITs have maximized their use of fixed rate debt to minimize uncertainty. REITs in particular have historically been very conscious when it comes to allocating fixed rate vs. variable debt, as interest rates play a large role in the overall profitability of the company. Across all public REITs, the average amount of variable debt as a percentage of the total debt is only ~13.5% according to Green Street Advisors as of July 31, 2022, meaning that ~86.5% of outstanding debt for the average REIT is fixed. In addition, REITs boast a weighted average debt maturity of ~7.0 years, which is in-line with the Chilton REIT Composite as of July 31, 2022.
As previously mentioned, one of the key impacts that rising interest rates can have on a company is through an increase in interest expenses, which, in turn, lowers future profitability levels. To exemplify how important the amount of variable debt a company has can be, especially during a period of rising interest rates, we can look at a prime example of a well-managed apartment REIT, Camden Property Trust (CPT).
Out of Camden’s $3.7 billion of total debt as of June 30, 2022, only $275 million (~7.4% of total debt) is variable, which is in-line with its peers. To assess the risk from rising rates we assumed a 125 bps increase to variable rate debt. In Camden’s case, on $275 million of variable rate debt, the 125 bps rate increase would drive a ~$3.5 million annual increase to interest expense, which equates to $0.03 per share. When compared to consensus 2023 Funds from Operations per share of $7.11, the impact would be less than 1%.
Furthermore, CPT has a well-laddered debt maturity schedule, with only 10.4% and 6.6% of the REIT’s total debt coming due in 2022 and 2023, respectively, meaning refinancing risk is immaterial. Overall, we believe that well-managed REITs with strong debt maturity profiles and sensible exposure to variable rate debt are in a favorable position to weather rising interest rates.
This is Not a 2008 Repeat
In response to concerns the real estate market could be heading for another 2008 style correction, it is very important to remember that “today’s REIT” is nearly unrecognizable compared with the average REIT heading into the financial crisis. Indeed 2008 included a multitude of painful lessons for REIT management teams, but thankfully, the industry has transformed over the past decade.
First and foremost, dividend payout ratios hover around 68% of cash flow today (as measured by Adjusted Funds from Operations, or AFFO). In 2008, the payout ratio was 85%. This means dividend risk is essentially off the table. With most REITs having reset their dividends to the minimum allowable level in 2020, most REITs will actually be forced to increase their dividends in 2022 in order to maintain REIT status given the positive growth in cash flow (we estimate a weighted average AFFO growth rate of +12% for 2022 in the REIT Composite).
Leverage was another driver behind blowups in 2008, and similarly, REIT Debt to Gross Asset Value (or D/GAV) has declined to 25%, versus 44% in early 2009. With such a low debt level, bankruptcy risk looks much different today than it did in 2008, and the proactive measures taken by REIT management teams over the past decade (and during the pandemic) position the group to weather any macro storms ahead.
NAREIT REITWatch, ISI Research, Chilton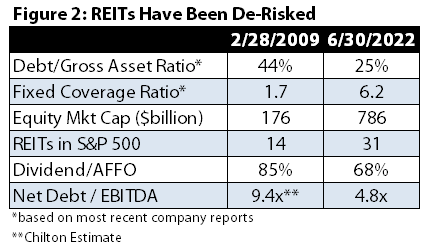
REIT Relative Competitiveness Increasing
In stark contrast to the publicly traded REITs, the non-traded REITs (or NTRs) have increased exposure to variable rate debt over the past year. As shown in Figure 3, data from research provider Blue Vault shows that NTR debt is comprised of almost 58% of variable rate debt as of March 31, 2022, up from 40% a year ago. As a result, the recent increase in LIBOR or SOFR (the two benchmark rates for variable rate debt) has hurt the cash flow of NTRs much more than the publicly traded REITs. We have heard anecdotes of dividend cuts and suspensions at several NTRs with high variable debt exposure, high dividend payout ratios, and low occupancy. In contrast, the safety of REIT balance sheets, low payout ratios, and high occupancy allows publicly traded REITs to use free cash flow for external growth (acquisitions, development) and/or dividend growth.
Blue Vault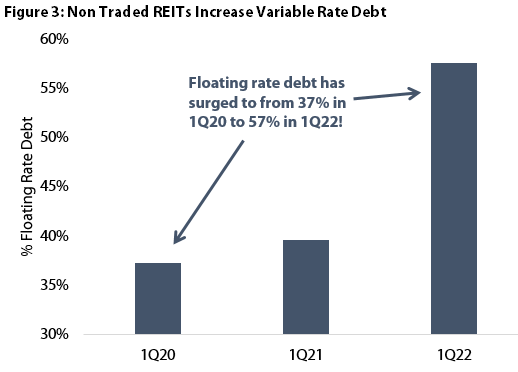
Flexibility Drives Dividend Growth
We are highly focused on actively investing in public REITs with both strong balance sheets and growth potential, positioning our portfolio to grow dividends faster than the REIT index. As seen in Figure 4, the Chilton REIT Composite generated weighted average annualized dividend growth of 10.5% from 2012 to 2021, which is 200 basis points higher than the FTSE NAREIT All Equity REITs Index (Bloomberg: FNER) at 8.5% over the same time period!
Another thing to highlight, we were able to generate positive dividend growth in each year from 2012 to 2021, which we believe is due to our active management. This is especially impressive considering the FNER had a weighted averaged dividend decrease of 26.2% in 2020. In comparison, the Composite had a weighted average dividend increase of 9.2%.
NAREIT, Bloomberg, Chilton
For the full year 2022, we expect the holdings in the Composite to grow dividends at a weighted average rate of +9.7%, followed by +8.5% in 2023. While these growth rates are a touch shy of our long term average, they follow an extremely strong growth year in 2021 and, more importantly, are expected to outpace the index. The actual dividend growth could be higher than our estimates, as we did not assume a change in the payout ratio.
Risk-Adjustments
We understand that periods of high volatility in the public market can be viewed as a negative for public REITs, and, conversely, the relative stability of private real estate pricing during these periods provides ‘comfort’. However, we believe the stability of private real estate pricing underestimates risk and therefore overstates risk-adjusted returns.
The best proxy we have for the private market value of commercial real estate is the NCREIF National Property Index (or NPI), which aggregates a quarterly valuation of over 10,000 properties. As of June 30, 2022, the value of the properties in the index increased by 2.3% from March 31 to $936 billion on a gross basis. The leveraged properties in the index had a debt ratio of 41%, which compares to the publicly traded REIT at 25% as of the same date.
While we can’t say what the actual change in valuation was for these 10,000 properties if they had to be sold, we would like to point out the difference in the quarterly return of +2.3% for the NPI versus the RMZ return of -16.9% over the same period. Is it possible that the NPI has properties that performed ~1900 basis points (or bps) better than publicly traded REIT properties? Not likely. To be sure, given the higher leverage (almost double) and floating rate debt ratio (more than triple!), the free cash flow after debt service at these properties has been under (and will continue to decline) much higher pressure than publicly traded REITs. In fact, the change in the RMZ reflects the public market view that private market values should be decreasing over the next six to twelve months.
This lag between the public and private market does allow for ‘arbitrage’ opportunities whereby investors can sell their private real estate, and then recycle the capital into publicly traded REITs at a discount. After factoring the higher quality, better transparency, dividend growth potential, and lower balance sheet risk, public REITs provide a significantly better risk-adjusted return than the private alternatives, in our opinion. If the decline in REIT prices does reflect the direction of private market values, then at least public REITs are already reflecting the new value, while private values would still need to re-rate downward.
Conclusion
Our economy is facing uncertain times and REITs are no exception. Interest rates are rising at the quickest pace in years, inflation is running rampant for the first time in many of our lives, and GDP numbers suggest we are headed for a recession. So how could we possibly be excited about public REITs? Aside from the inherent inflation protection present in REITs, management teams have focused extensively on strengthening balance sheets since the pandemic (or really since the financial crisis). As a result, public REITs retain an incredible amount of financial flexibility in the face of rising rates. For example, they have the lowest leverage, longest maturity, and lowest payout ratios in history. Within the Composite, we have focused on selecting REITs with both flexible balance sheets and the strongest growth profiles. We believe this focus will continue to deliver above average (and above inflation) dividend growth for years to come.
Be the first to comment