

onurdongel/E+ via Getty Images
A guest post by Ovi
Below are a number of oil, crude plus condensate (C + C ), production charts for Non-OPEC countries created from data provided by the EIA’s International Energy Statistics and updated to November 2021. Information from other sources such as OPEC, the STEO and country specific sites such as Russia, Brazil, Norway and China is used to provide a short-term outlook for future output and direction for a few countries and the world.
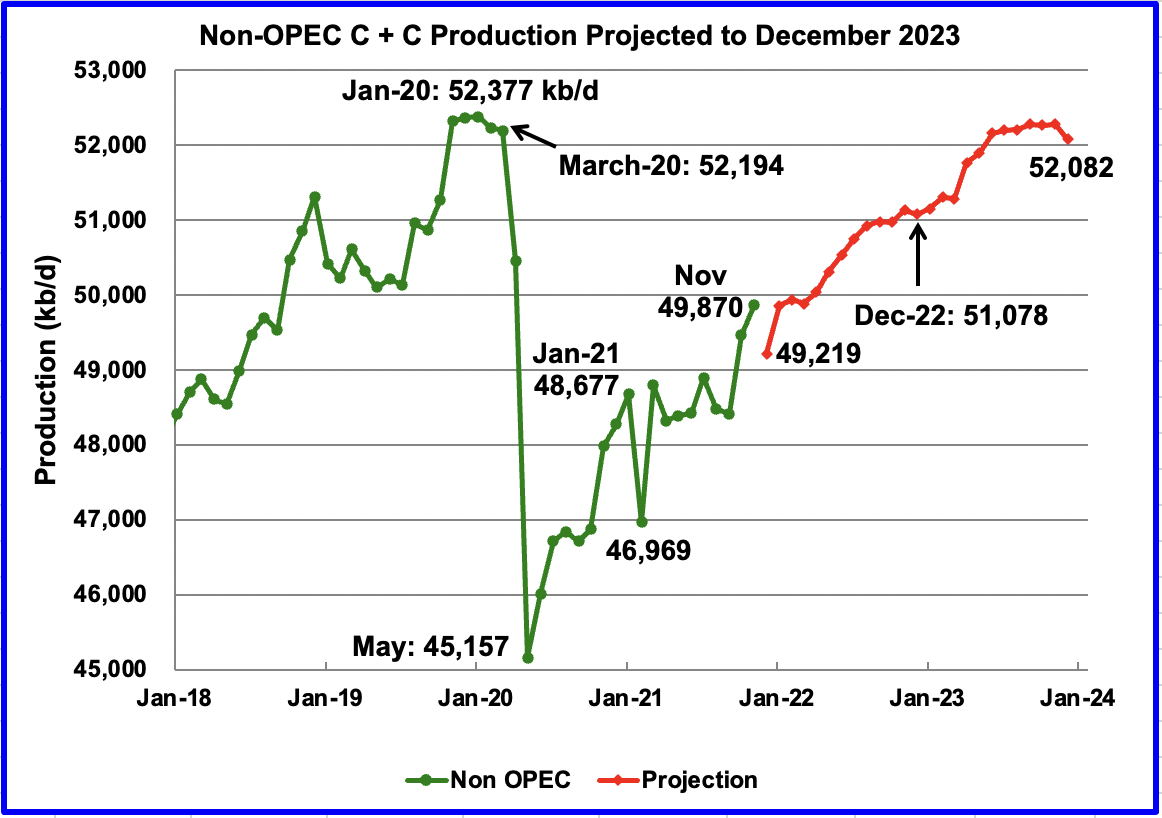
November Non-OPEC production increased by 410 kb/d to 49,870 kb/d. Of the 410 kb/d increase, the biggest increase came from the US with 244 kb/d along with a number of smaller increases. The other increasing countries were Brazil 74 kb/d, Kazakhstan 82 kb/d and Russia, 63 kb/d for a total of 463 kb/d. The biggest declines occurred in Guyana 86 kb/d and Norway 85 kb/d.
Using data from the March 2022 STEO, a projection for Non-OPEC oil output was made for the time period December 2021 to December 2023 (Red graph). Output is expected to reach 52,082 kb/d in December 2023, which is 295 kb/d lower than the January pre-covid peak of 52,377 kb/d. Note the projected drop for December 2021.
The current December 2023 output of 52,082 was revised down by 474 kb/d from the previous February report. The downward revision is primarily related to the STEO’s downward projection of close to 500 kb/d for Russian output, relative to February 2022. The revision is due to sanctions imposed by the US and its allies and the difficulty Russia is having in finding buyers for its oil. See Russia chart below for further details.
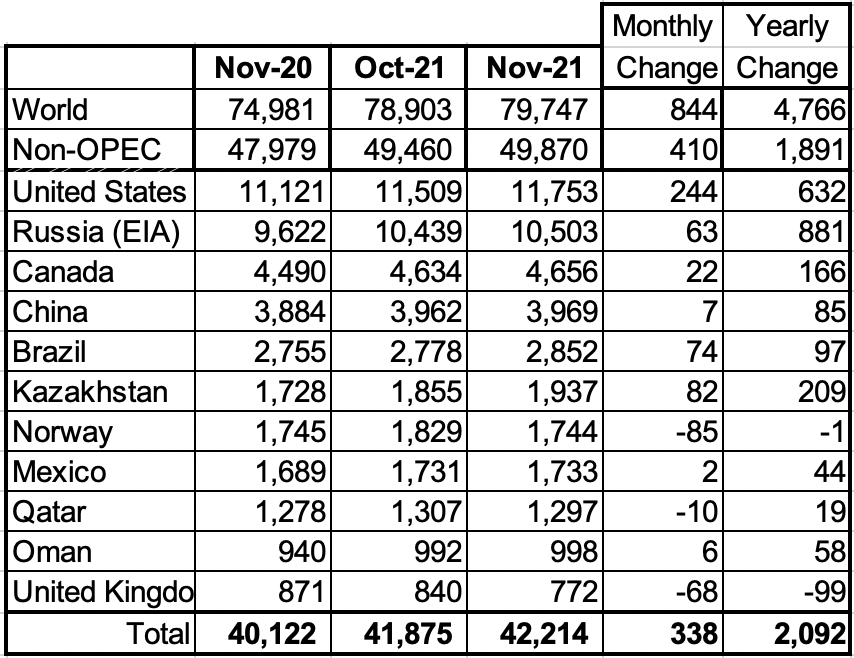
Above are listed the world’s 11 largest Non-OPEC producers. The original criteria for inclusion in the table was that all of the countries produced more than 1,000 kb/d. The last two have currently fallen below 1,000 kb/d.
In November, these 11 countries produced 84.6% of the Non-OPEC output. On a YoY basis, Non-OPEC production increased by 1,891 kb/d while on a MoM basis production increased by 410 kb/d to 49,870 kb/d. World YoY November output increased by 4,766 kb/d.
Production by Country
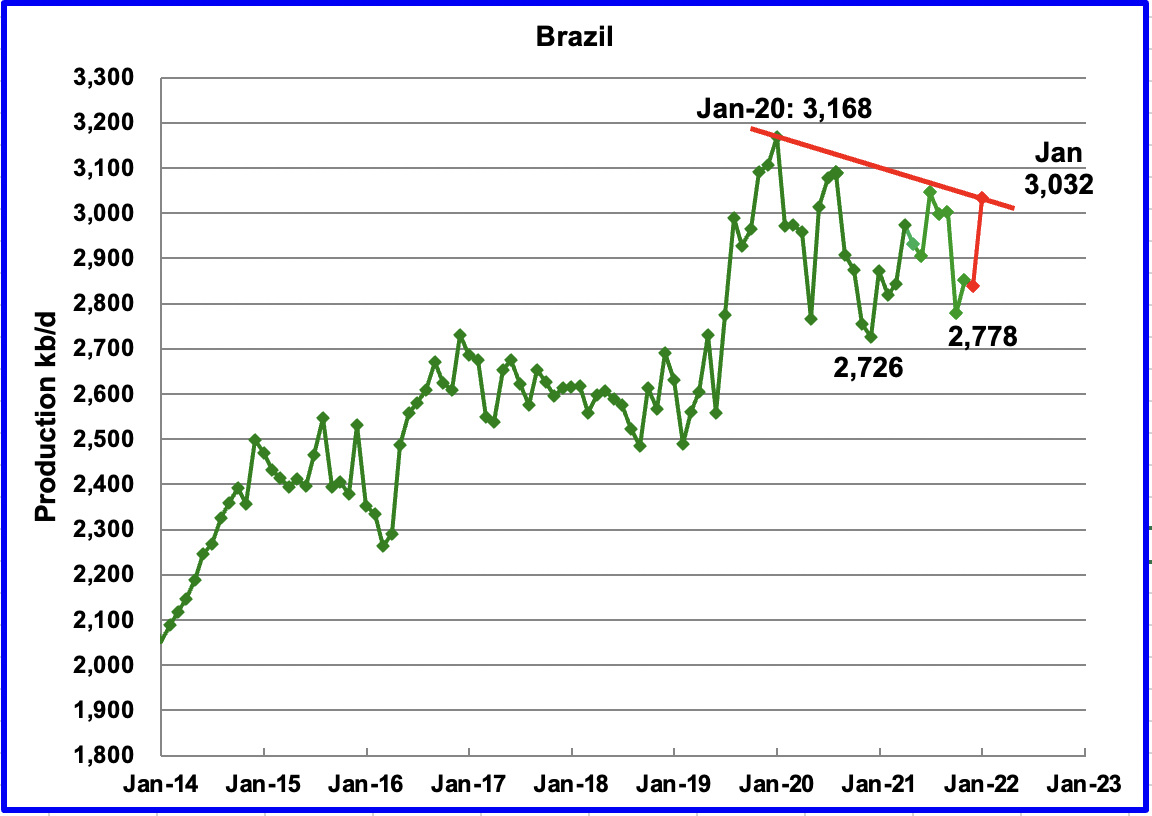
The EIA reported Brazil’s November production increased by 74 kb/d to 2,852 kb/d. The national petroleum association reported that January output rebounded to 3,032 kb/d. (Red Markers).
Brazil production is expected to increase in 2022. According to OPEC: “Crude oil production is expected to rise through two new project start-ups: Mero-1 (Guanabara), which was initially planned to start in 2021, and Peregrino-Phase 2. Moreover, in Buzios, a fifth unit, the Almirante Barroso FPSO — to be supplied by Japan’s Modec — is due to begin operations in 2022.
Peak production was reached in Brazil in January 2020, followed by two subsequent lower peaks. The Brazilian pre-salt reserves are being developed by Petrobras, as well as multinational oil companies such as Royal Dutch Shell, British Petroleum (BP), Chevron (CVX), and Exxon Mobil (XOM). These companies are spending hundreds of millions of dollars to produce the oil. One has to wonder if these companies are cutting their production expenditures, leading to the decline in production that started in January 2020 or is it related to geology?
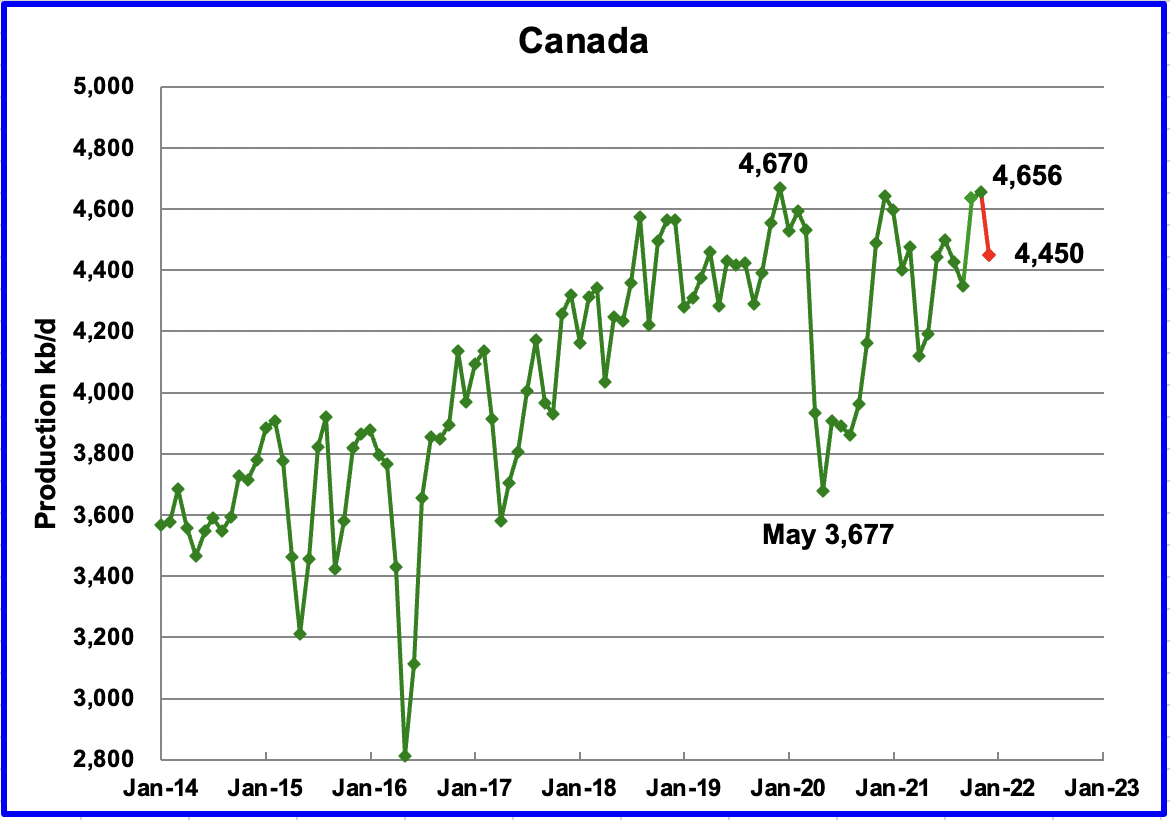
According to the EIA, November’s output increased by 22 kb/d to 4,656 kb/d.
The Canada Energy Regulator published partial production information for Canada’s December output. Filling in some of the blanks using info from the previous months, it appears that December production will drop by approximately 200 kb/d to 4,450 kb/d.
Suncor (SU), one of Canada’s major oil producer, expects to increase its crude oil production in 2022 and reduce its oil sands operating costs.
Suncor’s Oil Sands operations production of 395,000 to 435,000 barrels per day (bbls/d) and cash operating costs(1) per barrel of $25.00 – $28.00 reflects a larger proportion of production being higher margin SCO as well as planned maintenance at Firebag – its first major turnaround in 10 years.
“Fort Hills production of 85,000 to 100,000 bbls/d, net to Suncor, represents a two-train operation for the year and expected utilization of 90%. This production increase and focus on costs is expected to result in an approximately 40% reduction of Fort Hills cash operating costs(1) per barrel to $23.00 – $27.00 compared to the midpoint of 2021 guidance. Fort Hills will ramp up imminently in late December 2021 to a stable two train operation.”
I think the operating costs are strictly labour, fuel and maintenance. Administration and interest charges are not included.
In December, Canada shipped 131.2 kb/d by rail to the US, essentially unchanged from November which was 132.3 kb/d.
Canada looking at boosting oil pipeline flows to U.S.
According to this report the Minister of Natural Resources is working with Enbridge to increase the capacity of its pipeline system to flow more crude to the U.S. and Europe. Both Enbridge (ENB) and TransCanada Pipeline have used friction reducing additives to increase pipeline flow.
“Even if Canada is able to increase pipeline export capacity, many producers have been reluctant to adjust spending plans to significantly boost output.
However, Suncor Energy’s chief executive, Mark Little, said earlier this week he expects Canadian production to climb by a “few hundred thousand” barrels this year as prices soar.
Canadian oil companies exported a record amount of crude out of the U.S. Gulf Coast at the end of 2021, most of which went to big importers India, China and South Korea. read more”
Note that in Q2-22, many of the oil sands plants have scheduled maintenance which will reduce Canadian oil supply.
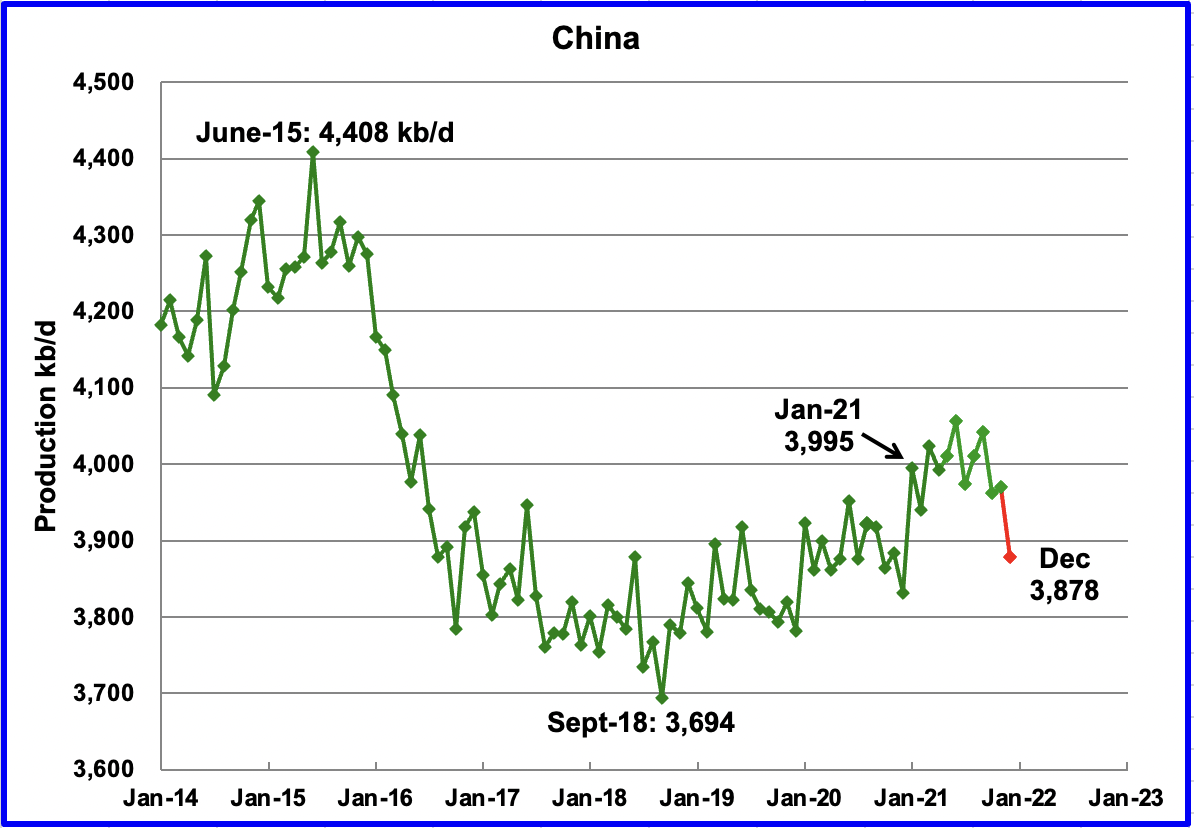
The EIA reported China’s output increased by 7 kb/d from 3,962 kb/d in October to 3,969 kb/d in November. December’s output declined according to this source to 3,878 kb/d. (Red marker).
A sidebar: Close to the 22nd of every month I access the Chinese National Bureau of Statistics to get their crude production for the previous month. The information is no longer available. December was the last month when the information was provided. Will China’s oil production information now become a state secret?
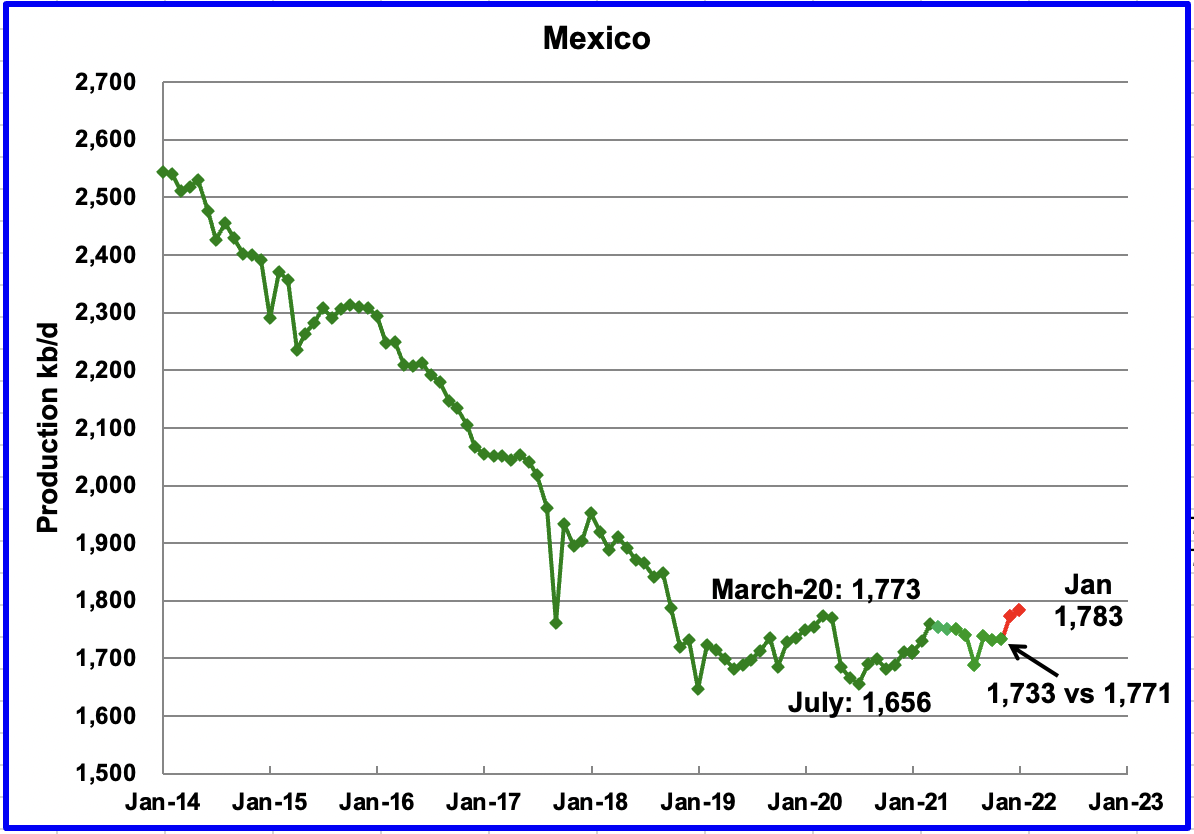
Mexico’s production as reported by the EIA for November increased by 2 kb/d to 1,733 kb/d.
Data from Pemex showed that November’s output climbed to 1,771 kb/d and was essentially unchanged for December and January at 1,783 kb/d. (Red markers). For some unknown reason, it appears that the EIA reduced Mexico’s official November C + C number by 38 kb/d. The January output of 1,783 kb/d may again be reduced by the EIA.
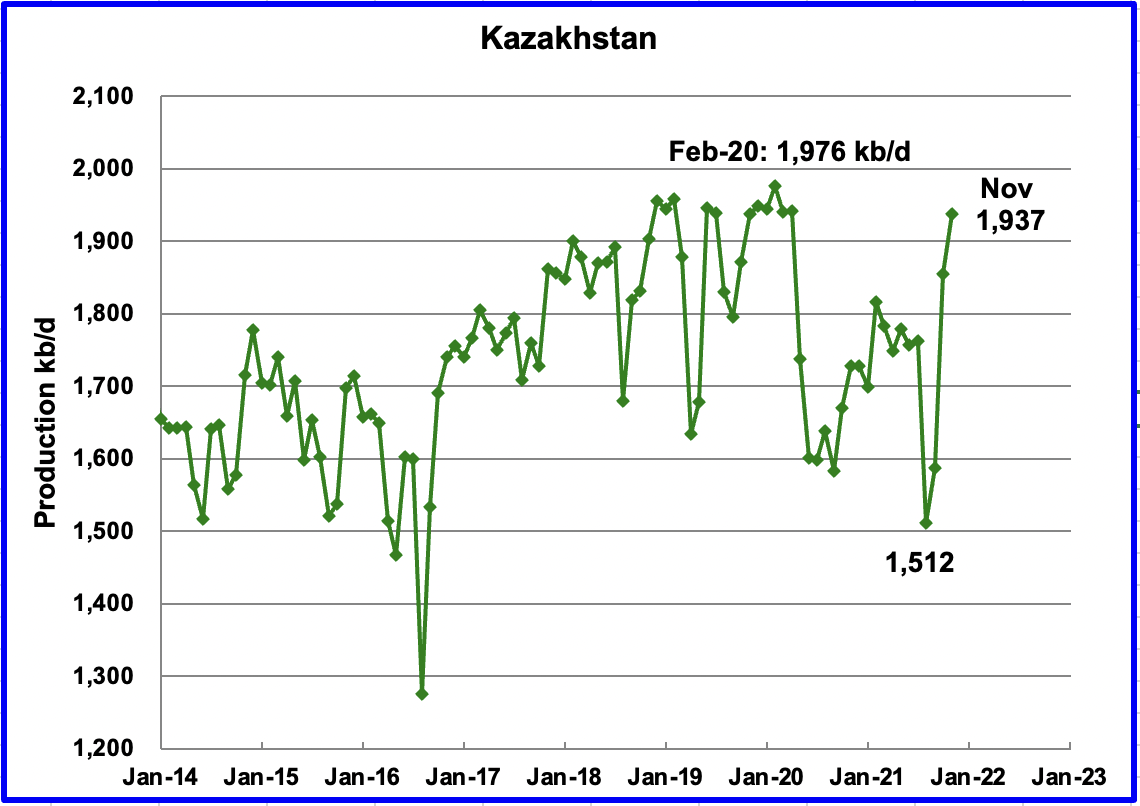
Kazakhstan’s output increased by 82 kb/d in November to 1,937 kb/d following the end of maintenance in the Tengiz field. November was the highest output since May 2020. OPEC expects a small increase, possibly 10 kb/d, in December.
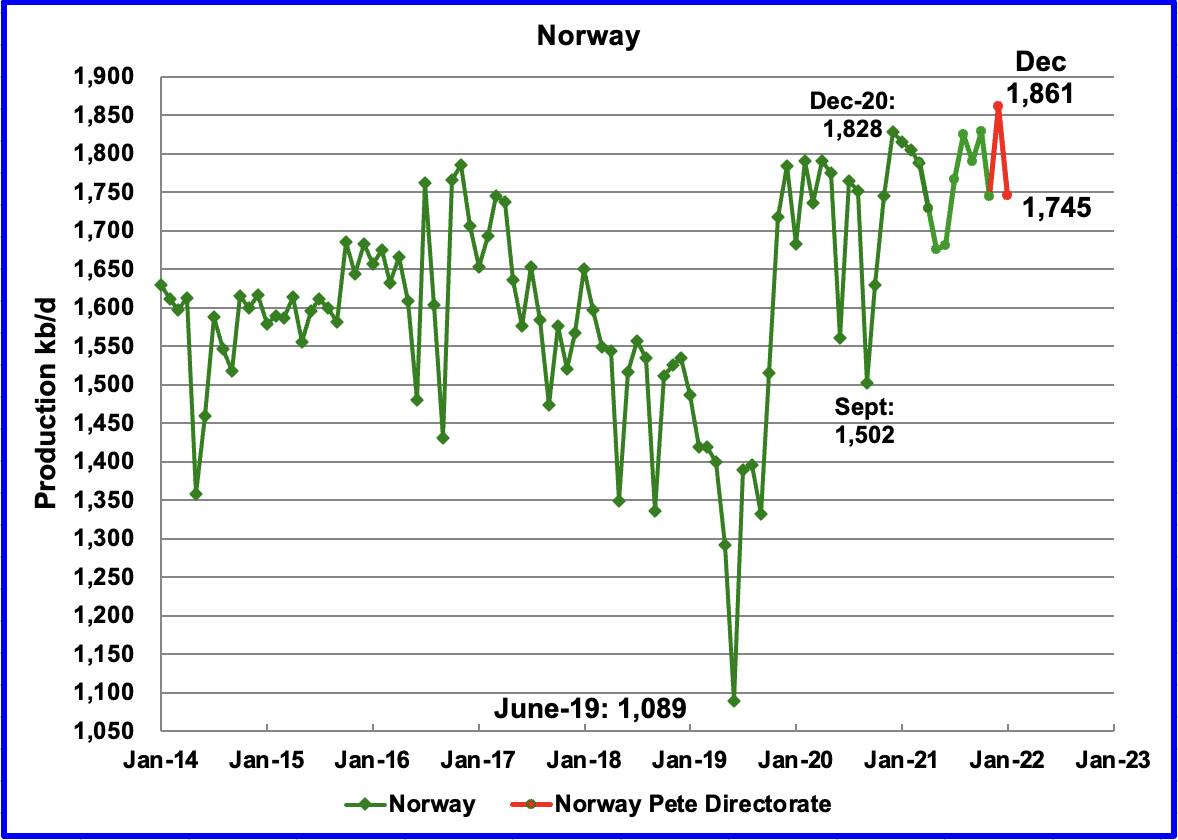
The EIA reported that Norway’s November production declined by 85 kb/d to 1,744 kb/d. The Norway Petroleum Directorate (NPD) reported that production in December increased to 1,861 kb/d and then dropped to 1,745 kb/d in January. (Red markers.)
According to the NPD, November production dropped due to technical problems. The production level was 5% lower than the Directorate had forecast.
Earlier this year, the NPD implied that Norway’s production would exceed the December 2020 output in the latter half of 2021. Their prediction was validated in December 2021 with a recent production record of 1,851 kb/d, which was much lower than its previous peak.
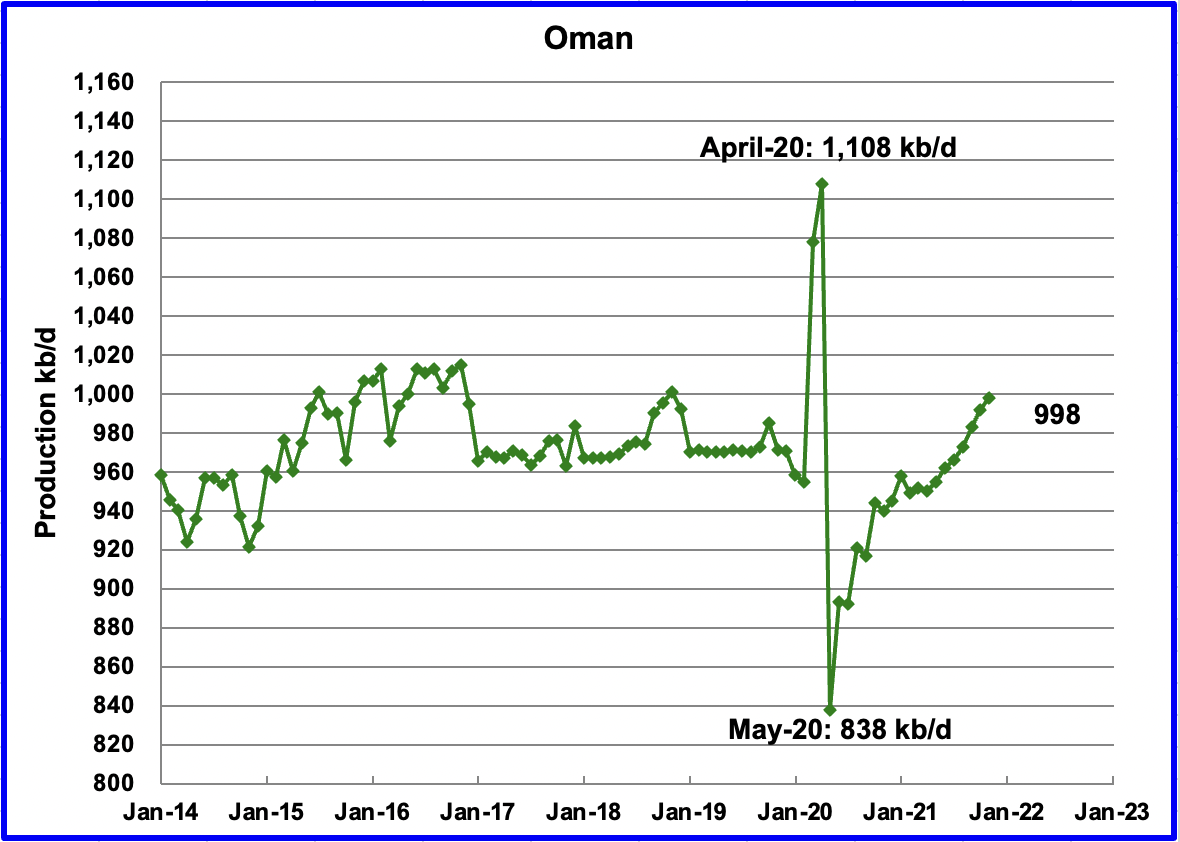
Oman’s November production increased by 6 kb/d to 998 kb/d.
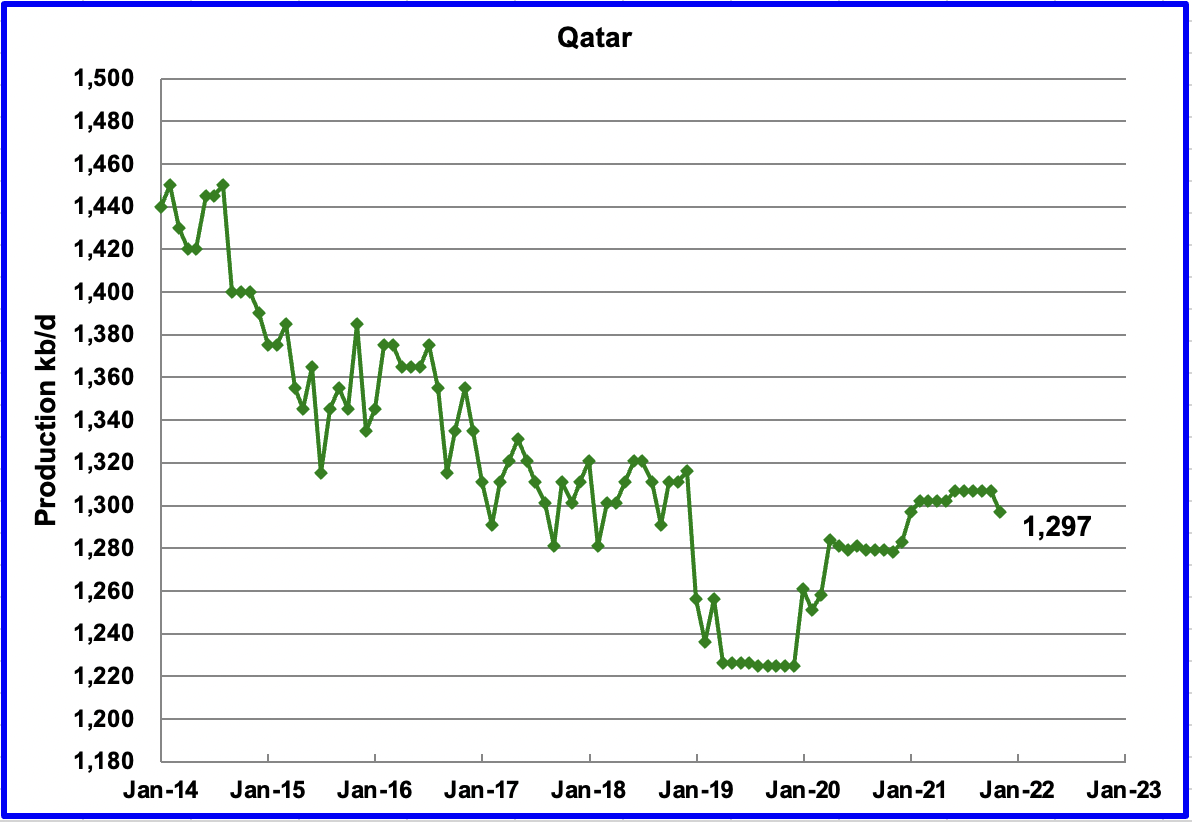
November’s output dropped by 10 kb/d to 1,297 kb/d.
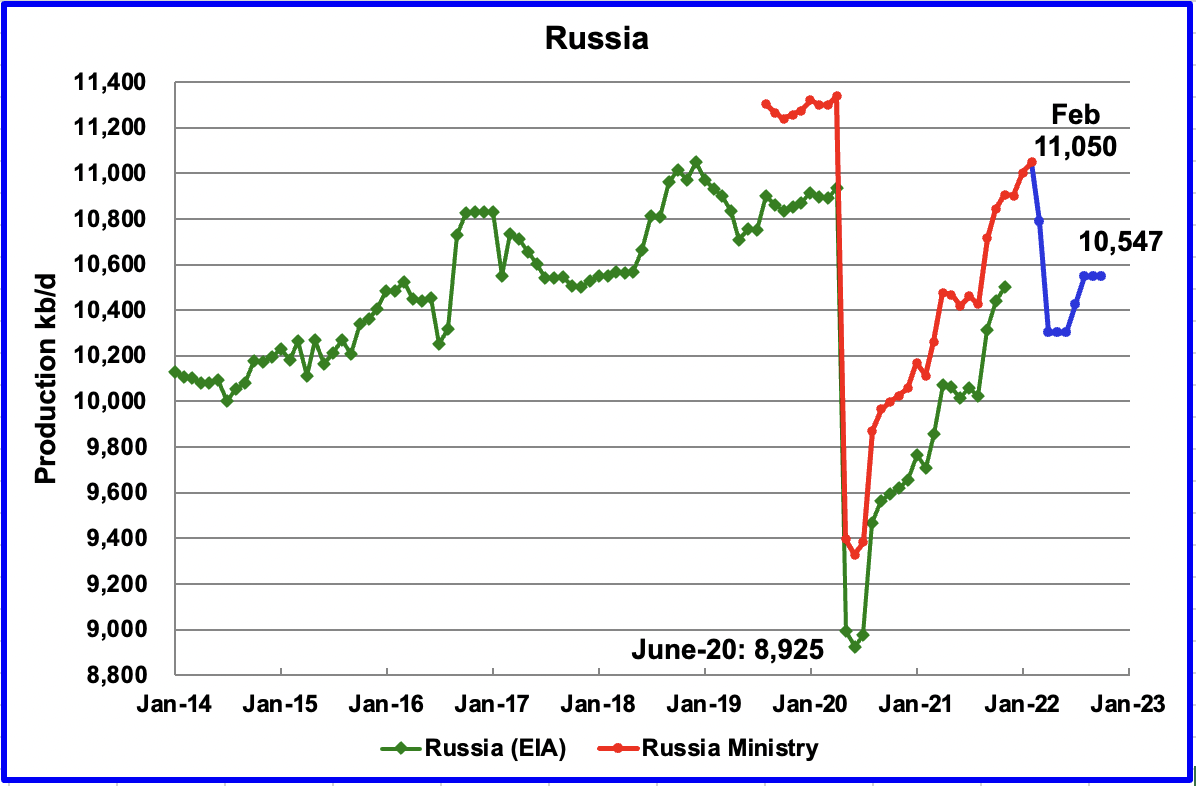
The EIA reported that Russian output increased by 63 kb/d in November to 10,503 kb/d. According to this source, February’s production increased by 50 kb/d over January to 11,050 kb/d. The blue graph represents the STEO’s forecast for Russian production up to October 2022 and beyond due to the imposition of economic sanctions by the U.S. and many other countries.
The C + C forecast was made by comparing the ratio of the STEO’s all liquids output with the Russian Ministry C + C output over the period October 2021 to February 2022. Russian C + C was close to 97.5% of the STEO all liquids data. That percentage was used to generate the Blue graph.
It is difficult to fully assess Russia’s compliance with the OPEC+ deal as the CDU-TEK data doesn’t provide a breakdown between crude and condensate, a lighter type of oil that’s excluded from the agreement. If Russia’s condensate output for February was close to December’s level of 950 kb/d, crude-only daily production was around 10,100 kb/d, some 127 kb/d below its February quota of 10,227 kb/d. Note that both Russia’s and Saudi Arabia’s commitments increase each month by 105 kb/d.
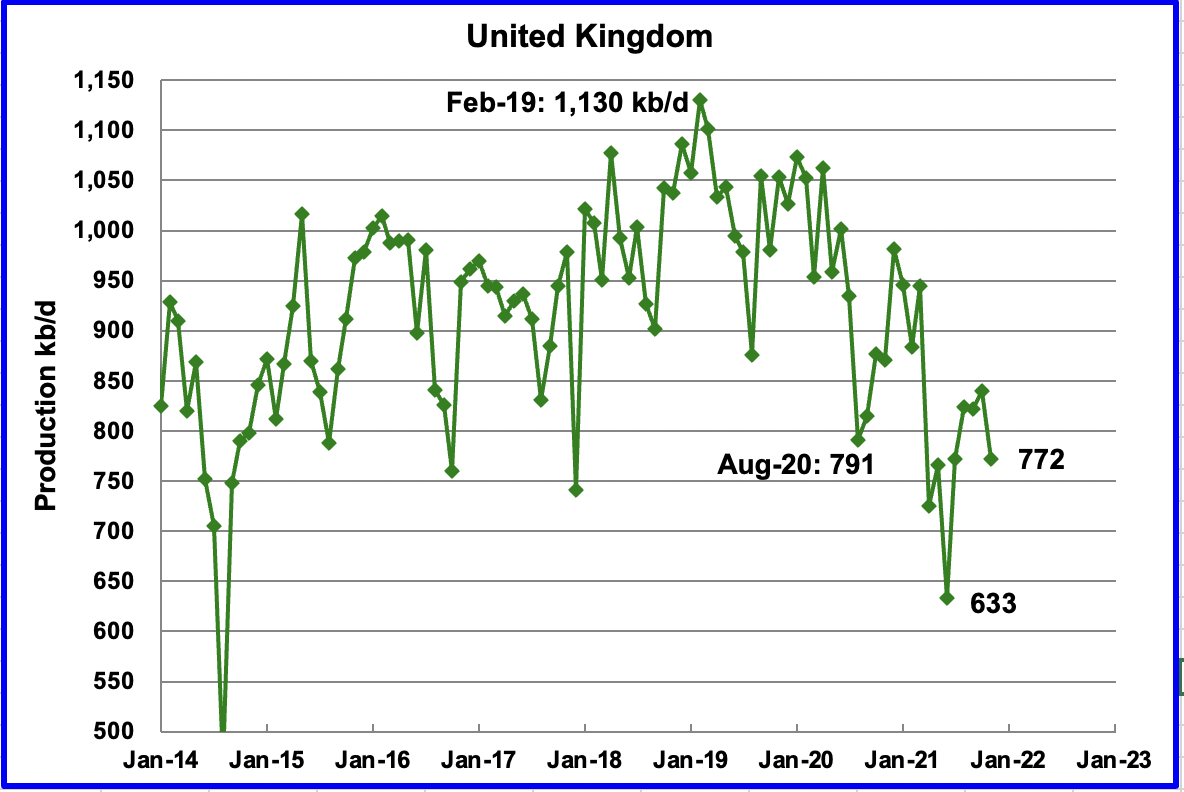
UK’s production decreased by 68 kb/d in November to 772 kb/d. The chart indicates that the UK may have entered a steep decline phase.
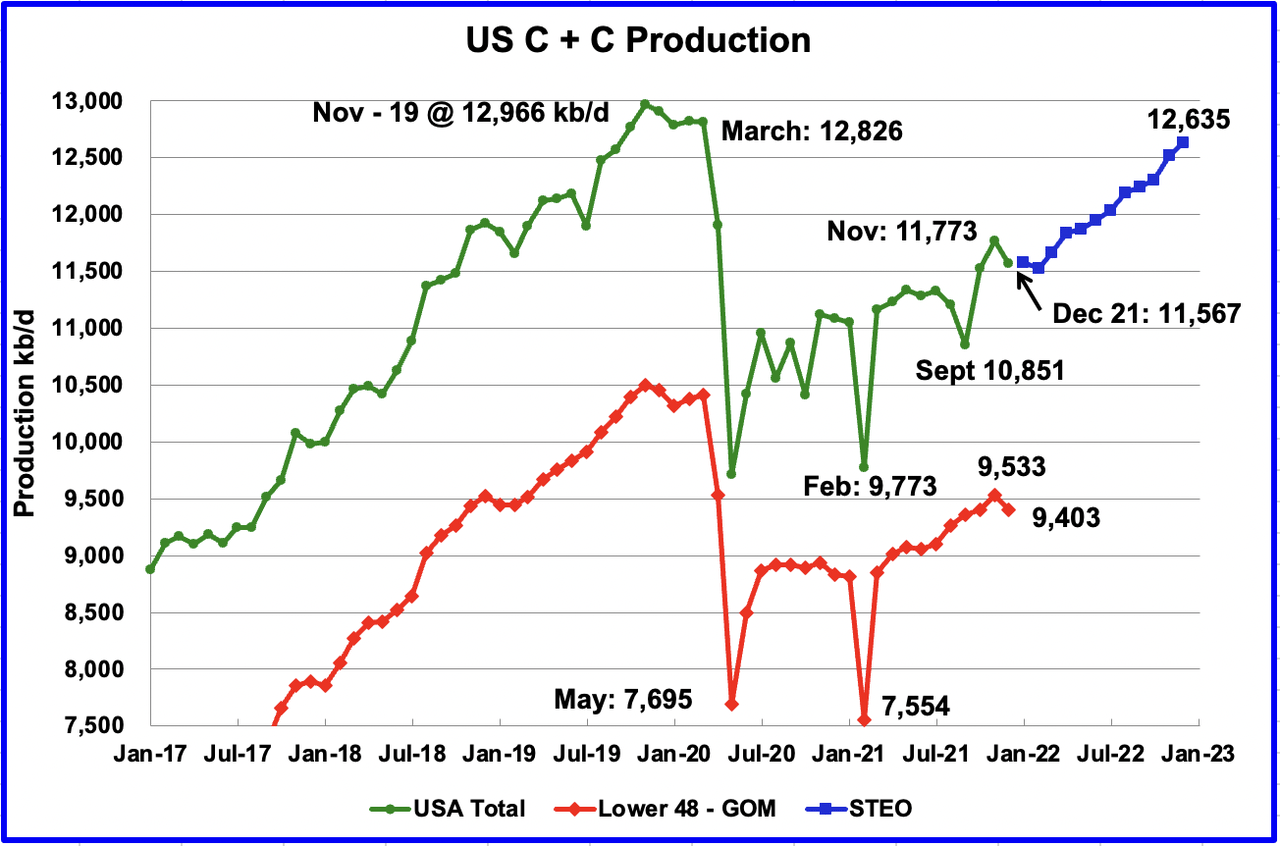
U.S. December production decreased by a surprising 206 kb/d to 11,567 kb/d. The main declining contributors were New Mexico 61 kb/d, ND 25 kb/d, GOM 81 kb/d and Texas 16 kb/d.
The blue markers, obtained from the March 2022 STEO, are the production forecast for the U.S. from January 2022 to December 2022. Output for December 2022 is expected to be 12,635 kb/d an increase/revision of 245 kb/d higher than was forecast in the February STEO report. Note the blue markers have been updated from those posted last Thursday in the previous US update. That is why December 2022 was revised up by 245 kb/d.
From February 2022 to December 2022 output is forecast to increase by 1,108 kb/d or an average of 110.8 kb/d/mth. Almost unbelievable.
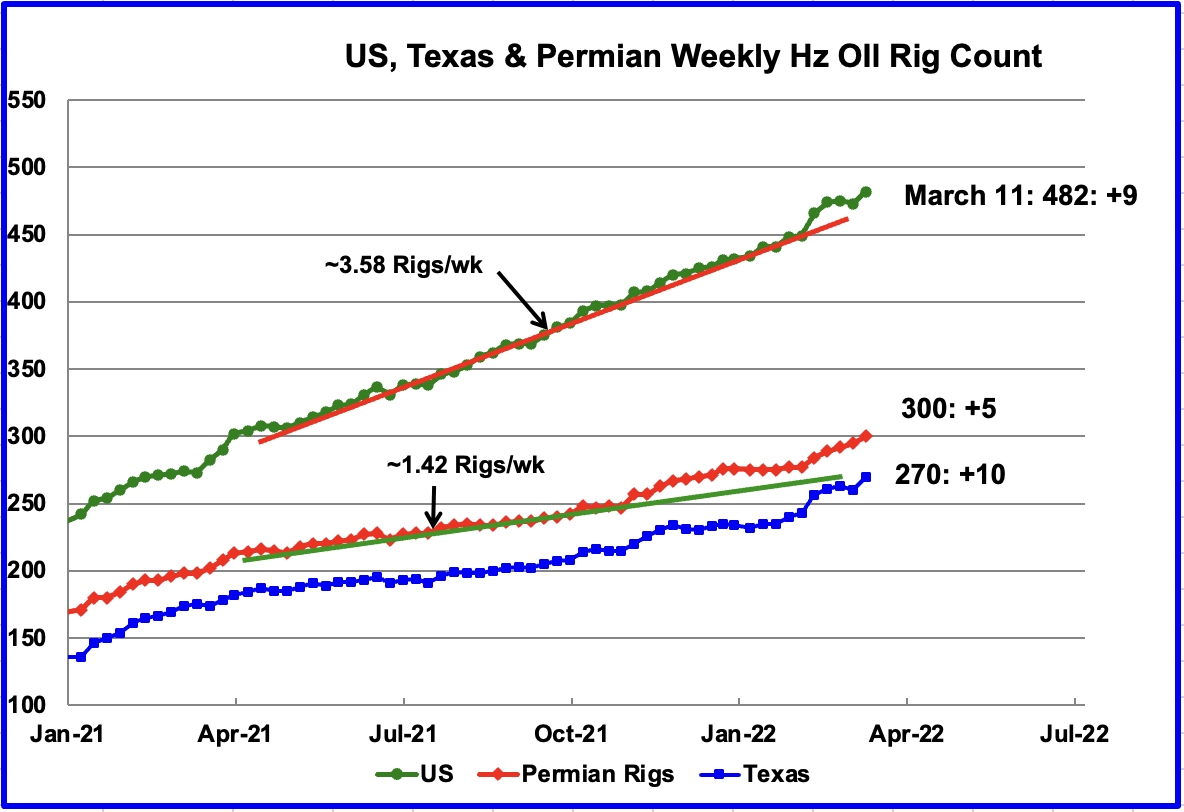
From the beginning of April 2021 to the end of January 2022, the US has been adding horizontal oil rigs at an average rate of close to 3.58 rigs/wk. However since the beginning of February, rig additions have accelerated in the US and particularly in the Texas Permian.
Over the last five weeks, an additional 32 rigs, or 6.4 rigs/wk, have been placed into operation in the U.S. Over the same period, 23 rigs have been added to the Permian, 4 in NM and 19 in Texas.
For the week ending March 11, 9 horizontal oil rigs were added for a total of 482. Permian rigs increased by 5. In Texas, the rig count increased by 10 while New Mexico dropped by 1.
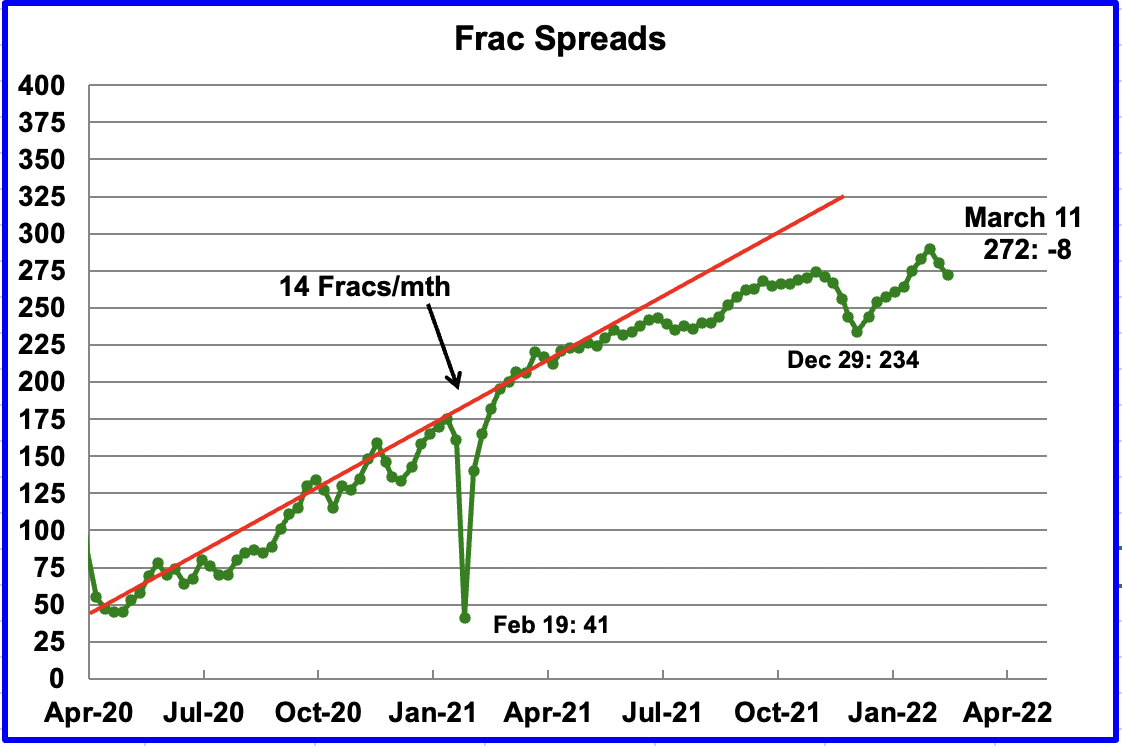
During December 2021, 37 frac spreads were decommissioned primarily due to the holidays and dropped to a low of 234 on December 29. Starting in early January up to the end of February, frac spreads were added at an average rate of 7 per week and peaked at 290 in the week ending February 25. However, since then the frac count has dropped by 18 over the first two weeks of March, 10 last week and 8 for the week ending March 11.
Note that these 272 frac spreads include both gas and oil spreads, whereas the rigs information is strictly oil rigs.
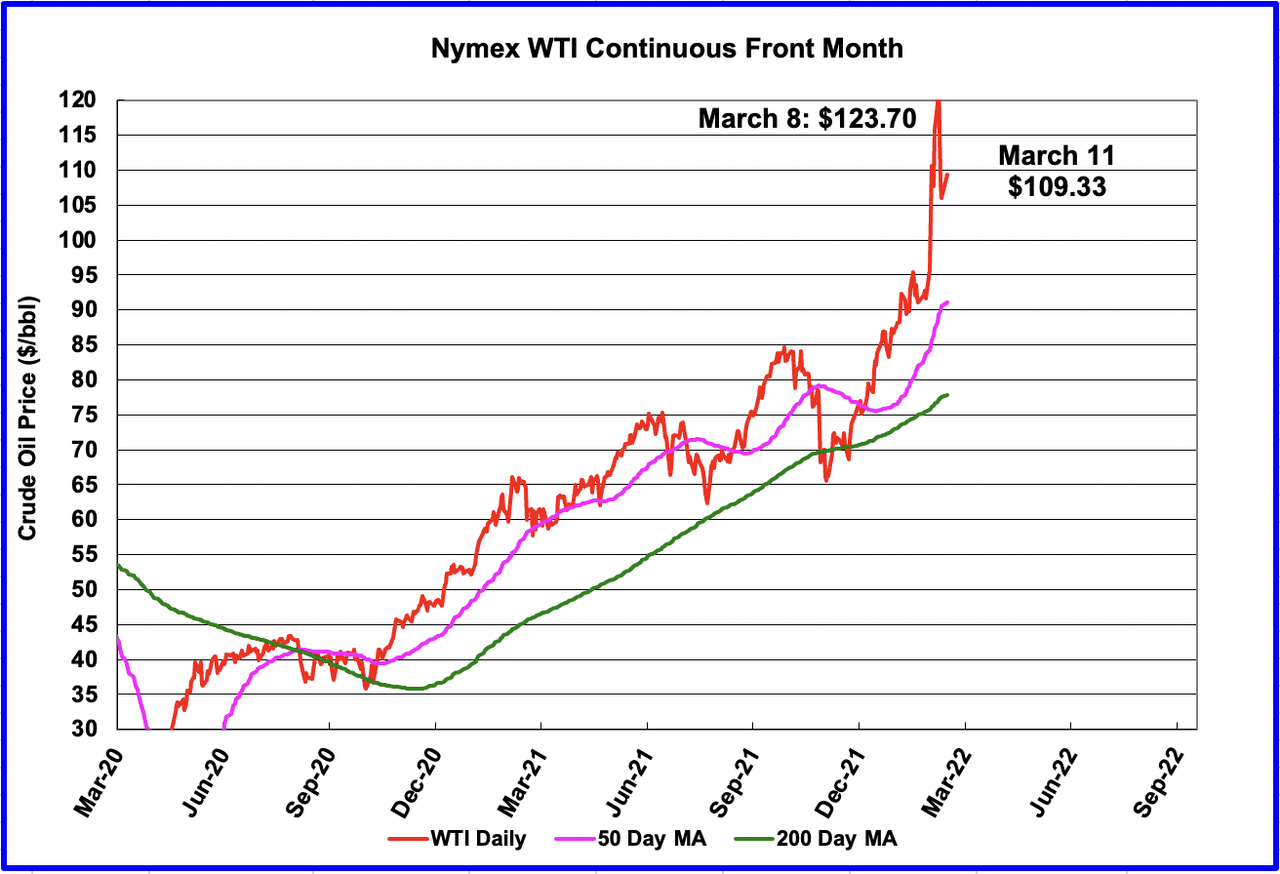
The Ukrainian crisis caused the price of WTI to increase from $95.72/b on Feb 28 to a recent high of $123.70/b on March 8. Over the last few days the price has settled back to $109.33/b.
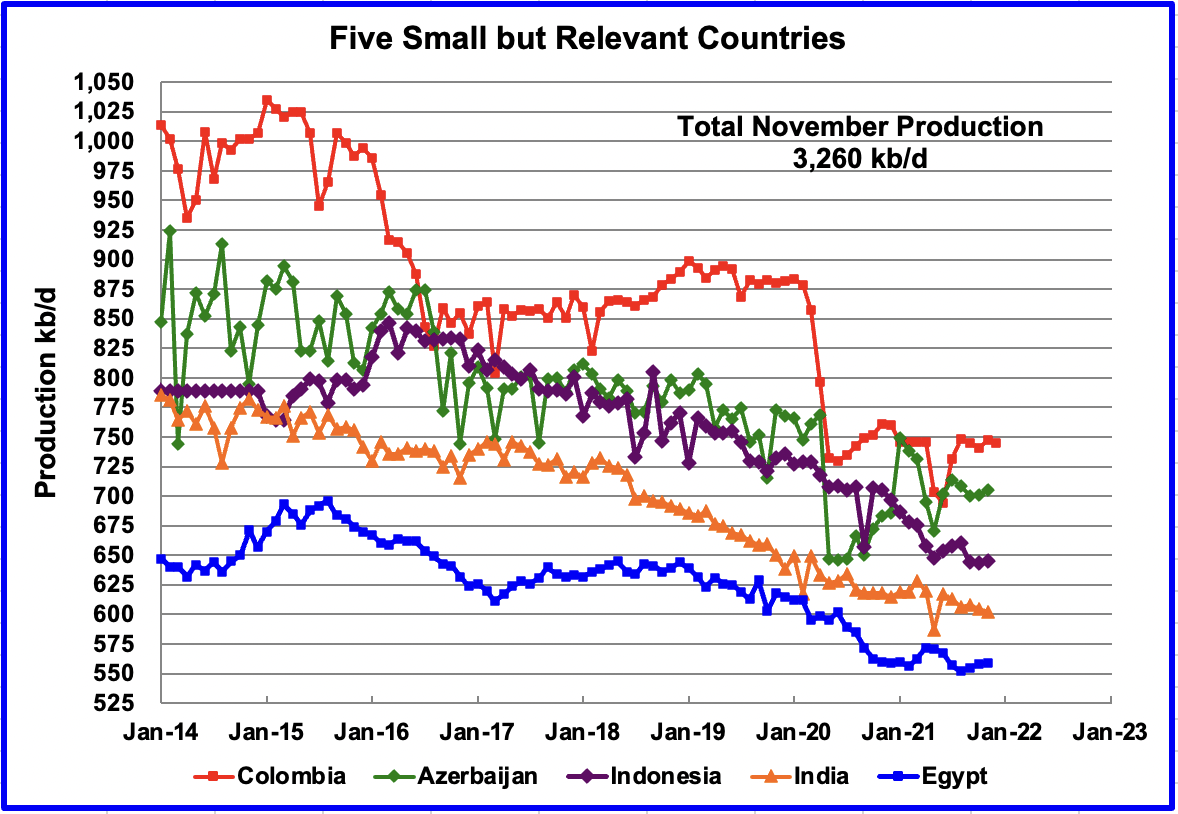
These five countries complete the list of Non-OPEC countries with annual production between 500 kb/d and 1,000 kb/d. Their combined November production was 3,260 kb/d, up by 12 kb/d from October.
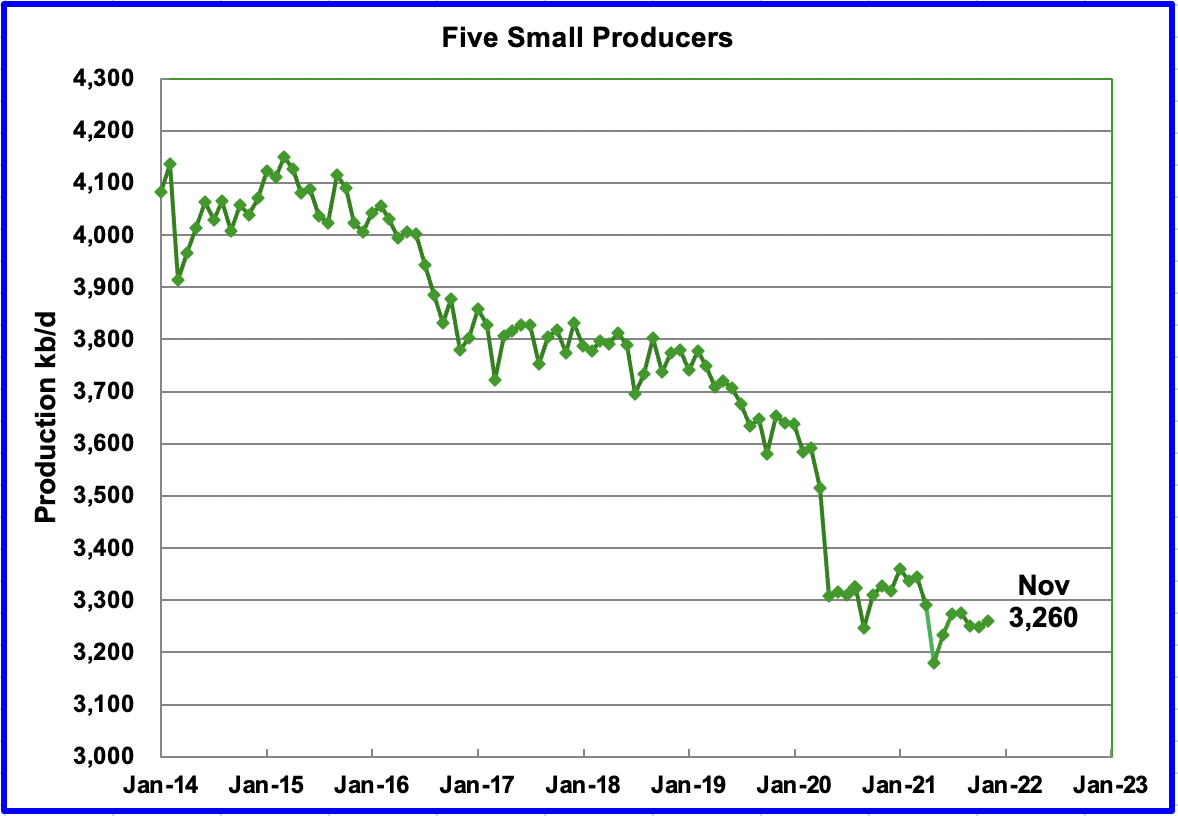
The overall output from the above five countries has been in a slow decline since 2015. The drop in May 2020 from 3,500 kb/d to 3,300 kb/d was primarily from Azerbaijan, 125 kb/d, which is a member of OPEC + and Colombia.
World Oil Production
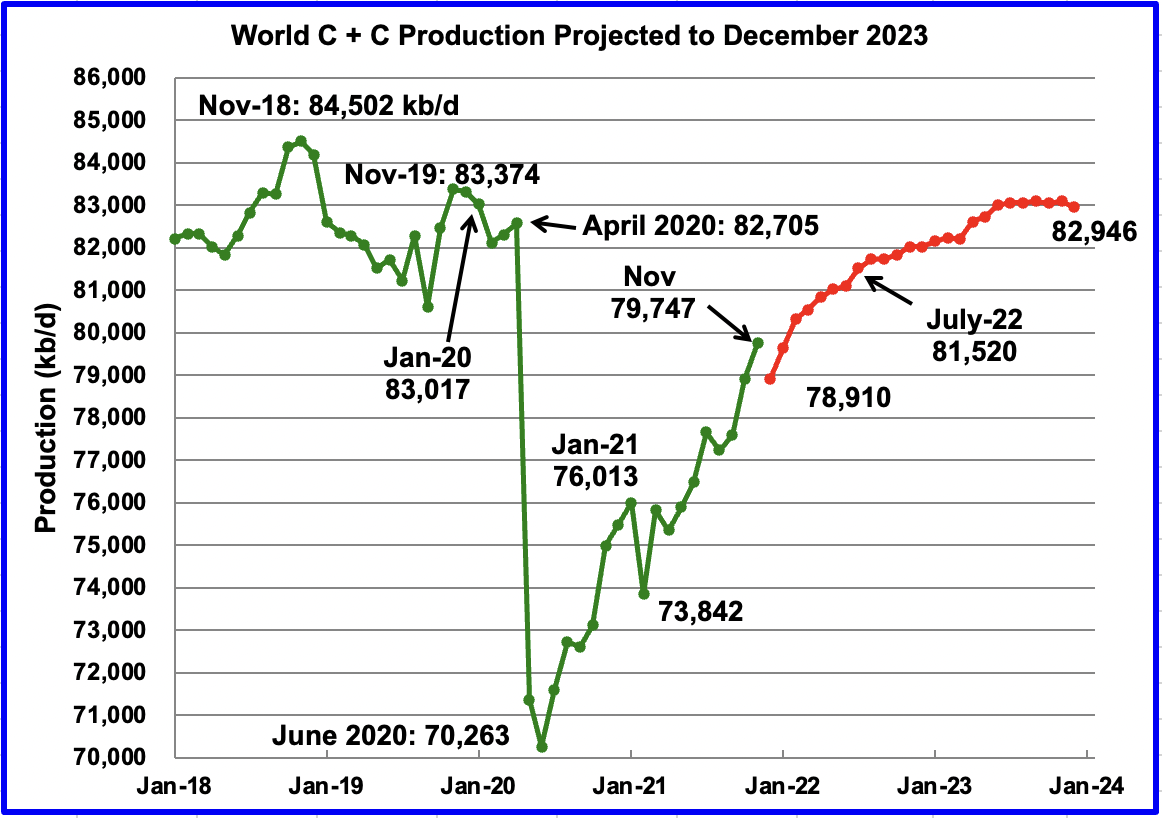
November’s world oil production increased by 844 kb/d to 79,747 kb/d according to the EIA. Of the 844 kb/d increase, the biggest production increase occurred in the US, 244 kb/d, followed by Saudi Arabia 102 kb/d, Kazakhstan 82 kb/d, Venezuela 80 kb/d, Brazil 74 kb/d and Russia 63 kb/d. The biggest declines occurred in Guyana 86 kb/d, Norway 85 kb/d and the UK 68 kb/d.
This chart also projects world production out to December 2023. It uses the March 2022 STEO report along with the International Energy Statistics to make the projection. (Red markers).
It projects that world crude production in December 2023 will be 82,946 kb/d, 278 kb/d lower than projected in the February report. It is also 71 kb/d lower than the January pre-covid rate of 83,017 kb/d and 1,556 kb/d lower than the November 2018 peak.
Editor’s Note: The summary bullets for this article were chosen by Seeking Alpha editors.
Be the first to comment