

jamesbenet/E+ via Getty Images
Investment Thesis
In order to protect investment capital during equity market corrections, it is safe to liquidate the equity positions and to hold cash or US Treasury bonds. Since the Treasury bonds are, most of the time, inversely correlated to stocks, it is expected that bonds make gains when stocks sell off.
Over the last ten years the average correlations of Treasury Bond ETFs with SPY are shown in the following table.
|
Correlation |
BIL |
SHY |
IEI |
IEF |
TLH |
TLT |
TYD |
TMF |
|
SPY |
-0.18 |
-0.28 |
-0.31 |
-0.37 |
-0.38 |
-0.39 |
-0.40 |
-0.39 |
In principle, all these funds are useful for protection of capital during market corrections. The non-leveraged Treasury ETFs are commonly used in the composition of so-called “balanced funds” and also for portfolios with tactical asset allocation. In my previously published articles on Seeking Alpha I used them for portfolio risk protection.
The question I try to answer in this article is whether the leveraged Treasury ETFs, TYD and TMF, may be profitably used for the same purpose. I present simulation results for a very simple portfolio for a period of over seven years, from January 2015 to April 2022.
TMF and TYD
The Direxion Daily 20+ Year Treasury Bull 3X Shares (NYSEARCA:TMF) is available since April 2009. It currently yields 2.70% and has a net expense ratio of 1.06%.
The Direxion Daily 7-10 Year Treasury Bull 3X Shares (TYD) is also available since April 2009. It seldom pays any dividends (last distribution was in December 2020) and has a net expense ratio of 1.09%.
While TMF trades heavily at an average of over 3 million shares per day, TYD is less popular; its trade volume is about 20 k per day. Nevertheless, both are suitable for medium sized portfolios.
Simulations
A very simple portfolio invests during market risk-on periods in the top 2 ETFs from the following universe: DIA, QQQ, SPY, XLF, XRT. During risk-off periods, it invests all the funds in a single Treasury bond fund.
The summary performance of the portfolios is shown in the table below.
|
2015-22 NONLEV |
CAGR |
stdev |
maxDD |
Sharpe Ratio |
Sortino Ratio |
|
BIL |
22.79% |
13.18% |
-10.59% |
1.73 |
2.01 |
|
SHY |
23.44% |
13.20% |
-10.59% |
1.78 |
2.17 |
|
IEI |
24.74% |
13.33% |
-10.59% |
1.86 |
2.35 |
|
IEF |
26.23% |
13.68% |
-11.18% |
1.92 |
2.52 |
|
TLH |
26.79% |
14.71% |
-13.41% |
1.82 |
2.42 |
|
TLT |
28.76% |
16.33% |
-16.23% |
1.76 |
2.38 |
|
TYD |
33.06% |
18.20% |
-18.25% |
1.82 |
2.43 |
|
TMF |
36.84% |
31.31% |
-43.82% |
1.18 |
1.39 |
A quick look at the numbers reveals the following:
Largest CAGR: TMF 36.84%, Lowest volatility: BIL 13.18%, Lowest maxDD: BIL, SHY and IEI -10.59%, Largest Sharpe ratio: IEF 1.92, Largest Sortino Ratio: IEF 2.52
Overall, most investors would select IEF as their choice because it achieves the highest risk adjusted return, while getting a reasonably large return with negligible increase in volatility and draw downs.
Author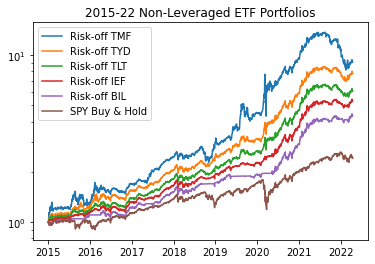
But, as we will show below, there are better choices for different periods of time. The table below shows the annual returns of the portfolios.
|
YEAR |
BIL |
SHY |
IEI |
IEF |
TLH |
TLT |
TYD |
TMF |
|
2015 |
10.55% |
10.82% |
12.52% |
14.16% |
13.89% |
16.69% |
21.97% |
25.44% |
|
2016 |
9.94% |
10.75% |
12.64% |
14.31% |
15.10% |
17.60% |
25.37% |
33.33% |
|
2017 |
23.79% |
23.75% |
24.57% |
25.98% |
27.12% |
30.67% |
32.40% |
44.73% |
|
2018 |
14.38% |
15.04% |
15.42% |
16.30% |
16.28% |
16.85% |
20.01% |
19.81% |
|
2019 |
12.21% |
13.24% |
15.07% |
17.98% |
20.69% |
25.35% |
28.01% |
50.78% |
|
2020 |
51.74% |
55.20% |
59.44% |
63.90% |
70.98% |
75.52% |
87.93% |
110.71% |
|
2021 |
40.20% |
39.80% |
38.80% |
36.97% |
32.85% |
30.01% |
30.34% |
10.40% |
|
2022 |
-0.82% |
-1.62% |
-2.61% |
-3.58% |
-5.49% |
-6.77% |
-9.38% |
-18.49% |
Here are a few observations:
TMF was the best performing risk-off asset in 2015, 2016, 2017, 2019 and 2020. 2018 was a draw between TYD and TMF. BIL was the best in 2021 and 2022
Based on these observations, the “optimal” choice would have been to employ TMF as the risk-off asset in the period 2015- 20, and then switch to BIL for 2021-22.
Current Environment
Since August 2020 when all Treasury bond ETFs made a top, they all started a long-term downtrend. That downtrend has been relentless, having a single 4-month counter-trend during April – July 2021. Since August 2021, the downtrend has accelerated due to many contributing factors, chief among them being the change in the FED monetary policy.
A vivid illustration of the losses in Treasury bonds of all durations can be seen in the following chart. In three months and a half, TMF lost over 48% of its value.
StockCharts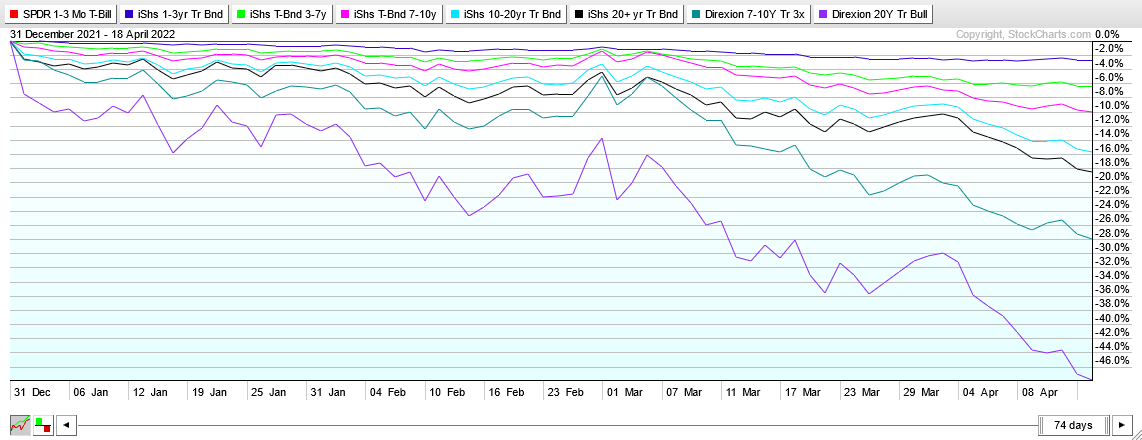
Conclusion
The current economic environment coupled with the so-called “Quantitative Tightening” and FED raising of FED fund rates, are expected to support the continuation of the current downtrend in the Treasury Bond prices.
My TMF rating is a SELL.
Be the first to comment