

ArtemisDiana/iStock via Getty Images
That’s right, I have been incredibly outspoken as a bear on bonds in my writings on Seeking Alpha since the March 2020 announcement of “Unlimited QE” by Federal Reserve Chairman Powell, to fight pandemic-related closures. My last bearish article in August linked here, screamed at investors to avoid bonds. But, as of this week I am changing my tune. It has everything to do with an inverted Treasury yield curve in November, the structure of bond market yields. Rarely have short-term rates been this far above long-term ones, and the vast majority of occurrences since 1982 have proven a GREAT time to buy/add long-term bonds to your portfolio. So, I am pulling rank and switching teams from bear to bull on the U.S. bond market.
In my view, the two smartest bond ETF vehicles to buy right now in portfolio construction are the iShares 20+ Year Treasury ETF (NASDAQ:TLT) and Vanguard Long-Term Bond ETF (NYSEARCA:BLV). The first is focused on long-dated Treasuries, while the second is roughly 50% government bonds and 50% corporate issues (which do carry higher risk of default in a recession). Immediate yields of nearly 4% in TLT and 5% in BLV are now the norm. Why not lock in higher yields and ride the likelihood of climbing bond prices into the future, especially when the Fed decides to ease banking policy and liquidity in 2023? The U.S. central bank might even be forced to directly purchase bonds again in a deep recession, putting its firepower behind your debt purchases today.
The bullish thesis: recessions lead to falling inflationary pressures and a capital exodus out of the stock market into safer investments with stronger yields, namely bonds. I mentioned this investor transition was underway a few weeks ago here, in an article explaining why inverted yield-curve spans have proven a rotten time to own/accumulate stocks. And, with bonds providing the best relative yield to the equity market since late 2007 (before the whole QE mess began in 2008), a valuation argument in favor of credit market investment holds some logic.
YCharts – Yields on 10-Year Treasury Bond vs. S&P 500 Dividends, Since 2000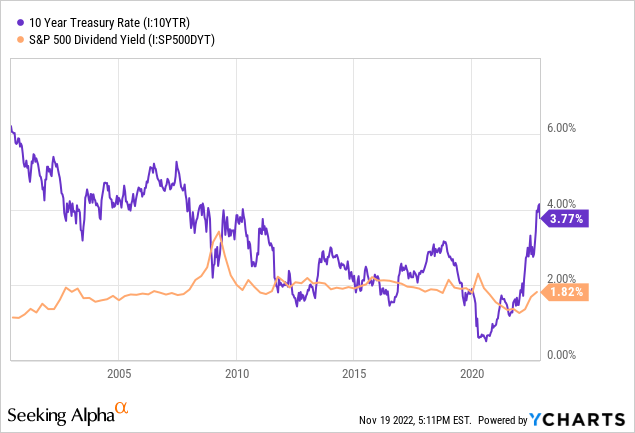
Inverted Yield Curve Bullish for Long Bonds
November has reached for the steepest yield curve inversion since 1982, according to several brokerage notes last week. Anecdotally, trading and investing since 1986, this is the greatest inversion event I can remember. The horrible news for the economy is banking and financial system liquidity appears destined to contract sharply into early 2023. I am modeling the potential for a 5% or greater jump in the number of unemployed Americans next year, as company profits may plunge in the first half of 2023 vs. 2022. If I am correct, nearly 1 in 20 workers could soon lose their jobs.
Statistically, today’s positive spread between 3-month Treasury bills and 30-year bonds is the widest since 2007, just before sliding into the Great Recession real estate bust and banking crisis. Over the last 40 years, this instance plus similar spreads in 2001 and 1982 were clear harbingers of approaching recession.
Below is a graph of 30-year yields back to 1982 measured against recessions (shaded in grey), and the 3-month to 30-year structure of government interest/borrowing rates. You will notice the raw increase in 30-year rates since 2020 is the scariest jump in 40 years. There is no doubt in my mind this rise (with a 6 to 12-month lag) will create serious calamity in the economy next year. The debate currently raging between experienced commentators and analysts is whether a mild (1990-91, 2001-02) or severe (1982, 2007-09) recession is next.
Since 1982, any positive inversion for 3-month rates vs. 30-years is statistically associated with 90% odds of a “positive” total return over the following 12 months for bonds maturing in the distant future. Long-bond investment gains over 24 months were basically 95% common. That’s a pretty clear track record, hard to ignore.
YCharts – Yields on 3-Month Treasury vs. 30-Year, Since 1982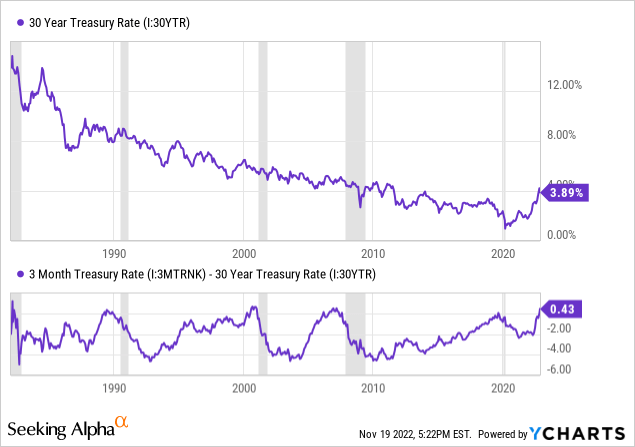
When we look at the spread between 1-year and 10-year rates, the investment forecast for bonds becomes a bit cloudier, although it still suggests bonds as an area of interest. Today’s almost 1% difference is the highest since 1982, matched only by 1979-82, late 1969, and 1973-74. Using this data since 1982, any inversion statistically increased the odds of “positive” 12-month long-bond investment total return above 85%. However, the odds of a successful bond trade during the late 1960s and whole 1970s decade were well under 50%, as inflation was never really put back into pandora’s box.
YCharts – Yields on 1-Year Treasury vs. 10-Year, Since 1963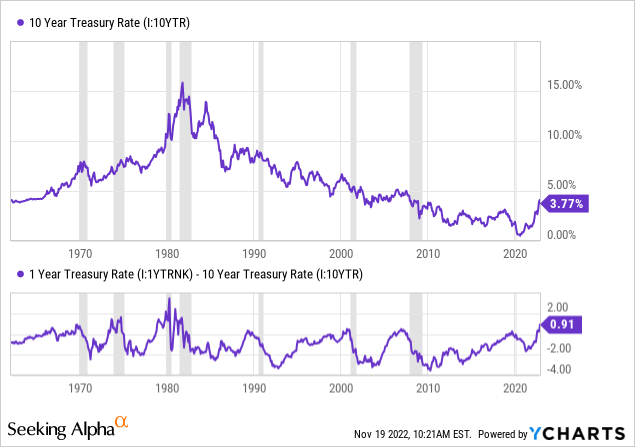
Commodity Inflation Cooling
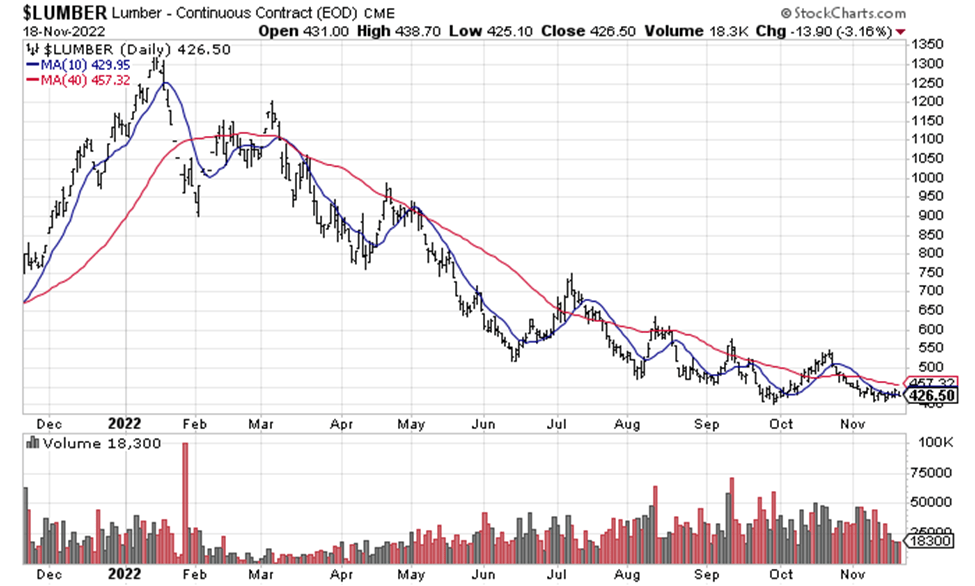
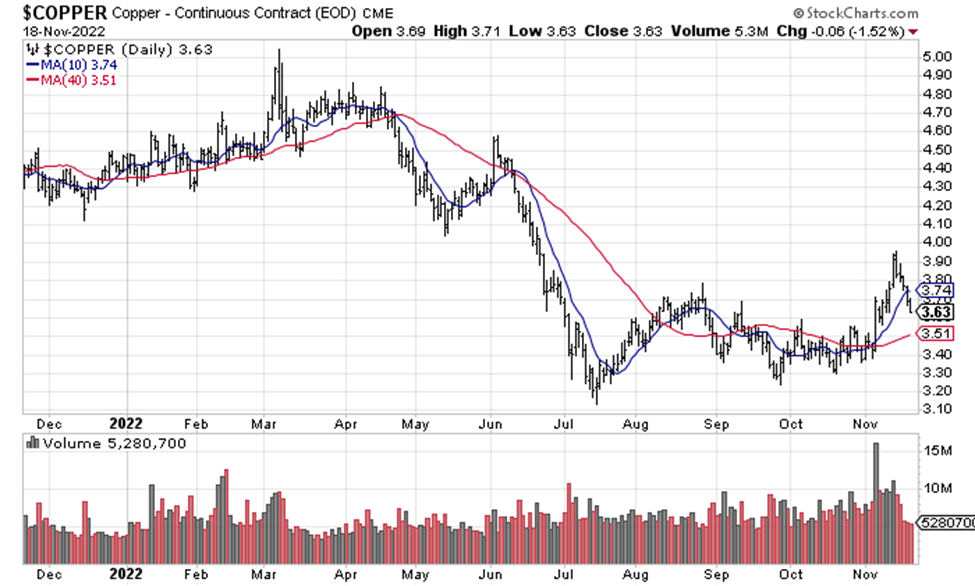
Another bullish piece of evidence that inflationary pressures are easing is found in the decline of industrial commodities like crude oil, lumber, and copper since the spring. Believe it or not, U.S. crude oil prices have nearly returned to the same $75 a barrel level of 52-weeks ago. Why is this important? Because energy prices are one of the critical components of inflation in the economy. If energy prices fall further into the end of 2022, a function of recessionary demand forces (which assumes Russia does not up the ante in its Ukraine war and the Middle East political picture remains calm), headline CPI rates of inflation may actually fall back toward “core” rates in the 5% to 6% YoY range by January.
StockCharts.com – Nearby Light Sweet Crude Oil Futures, Daily Price and Volume Changes, 1 Year StockCharts.com – Nearby Lumber Futures, Daily Price and Volume Changes, 1 Year StockCharts.com – Nearby Copper Futures, Daily Price and Volume Changes, 1 Year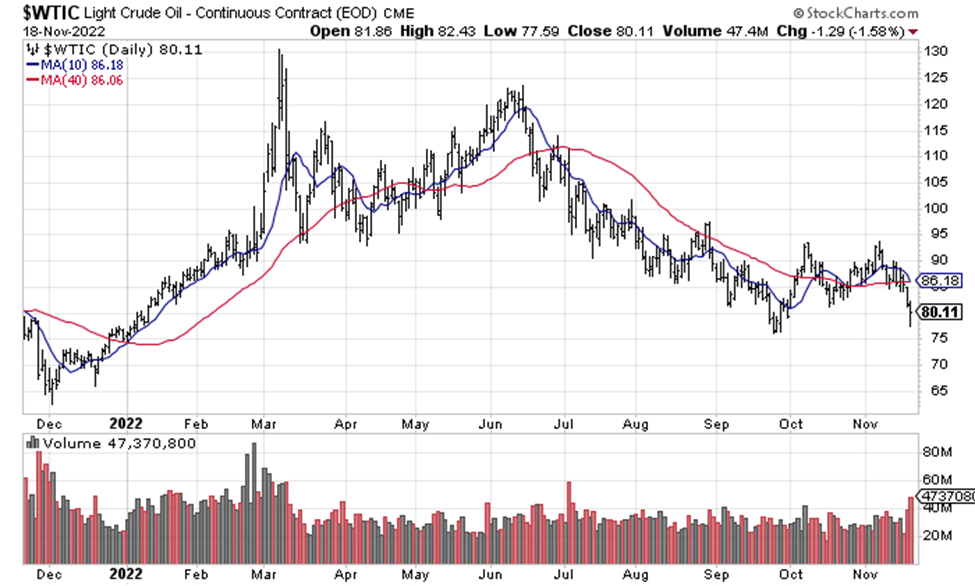
Review of Bond Returns
The rotten news for stubborn and committed bond owners is this asset class has generated sizable losses over the last 1-year and 5-year periods. With Treasury bills, cash at the bank, and money market funds performing about the same as long-bonds over the past decade. If you believed bonds were close to risk-free yield vehicles, you may not have understood artificially low rates by the Fed (QE controlled) would eventually lead to a substantial slide in bond prices and yield-free risk following 2020-21.
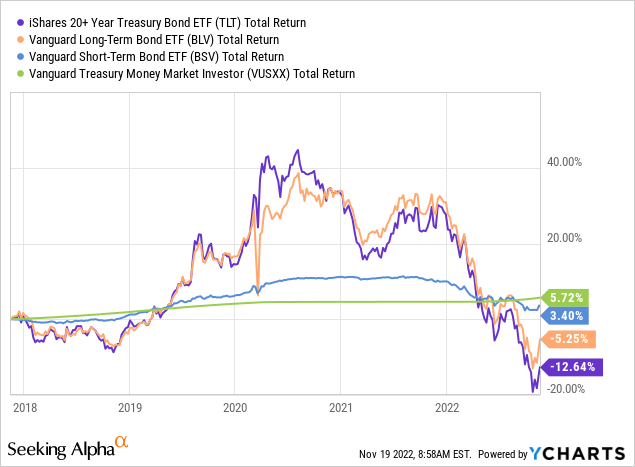
Below I have charted total returns (including dividends and price changes) for iShares 20+ Year Treasury Bonds and Vanguard Long-Term Bonds vs. the Vanguard Short-Term Bonds ETF (BSV) and Vanguard Treasury Money Market Investor (VUSXX) fund. I know it’s hard to swallow, but cash earning next to nothing for interest over the past decade has performed just as well as bonds with maturities 5 to 30 years into the future.
YCharts – U.S. Bond Investment Total Returns, 1 Year YCharts – U.S. Bond Investment Total Returns, 5 Years YCharts – U.S. Bond Investment Total Returns, 10 Years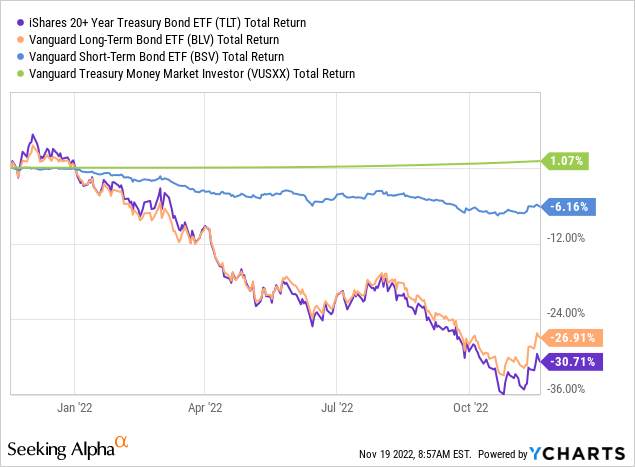
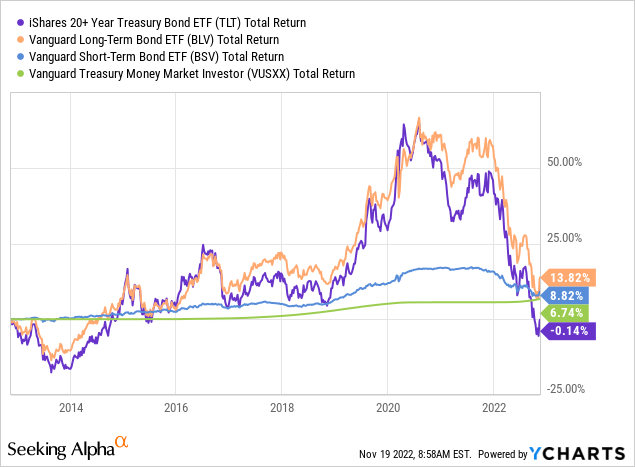
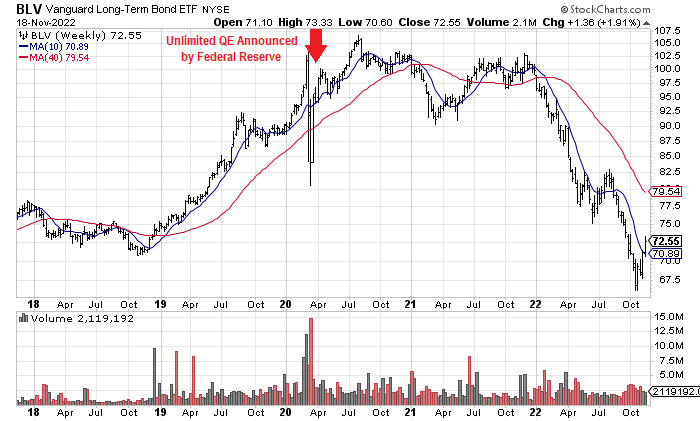
5-year charts of weekly trading in TLT and BLV are drawn below. Both have been adjusted to include dividend payments (previous price values have been adjusted lower to compensate). I have marked with red arrows the March 2020 announcement of Unlimited QE by the Federal Reserve. This decision effectively pinpointed the panic buying top in bond prices (between March and July).
StockCharts.com – TLT, Weekly Price and Volume Changes, 5 Years StockCharts.com – BLV, Weekly Price and Volume Changes, 5 Years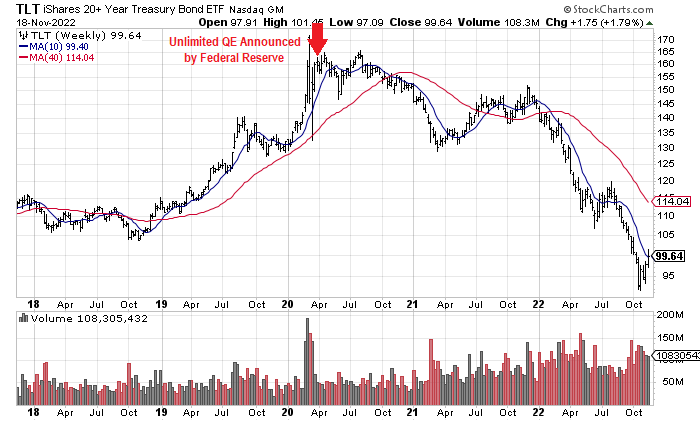
Will Rising Rates Kill Economic Growth?
Now some context. The main reason I am leaning toward trusting the positive yield-curve outcomes since 1982 revolves around the U.S. and world debt situation. With record U.S. debts (including corporate, consumer, federal/state/local governments) to GDP output today, I seriously doubt the economy can survive (much less thrive) with interest rates at current levels.
For starters, the $31 trillion in U.S. sovereign Treasury debt is about to witness a yearly “expense” increase of $1 trillion or more, if rates (borrowing costs) do not reverse and come back down in 2023-24. Such an increase effectively busts the $5.8 trillion in total federal outlays for FY2022, with $4.5 trillion in tax collections, and a $1.3 trillion deficit shortfall already in place structurally.
Incredibly high debts and deficits did not exist in the 1960s and 1970s to restrain spending and inflation, when borrowing costs spiked. Further, if we assume the Fed does not intervene with heavy-handed QE, a big jump in interest rates should dramatically slow debt creation and final demand in the economy, while driving inflation rates lower.
My forecast is the 2023 economy will be hobbled by the current interest-rate profile and its effect on our debt-financed demand reality. Honestly, we find ourselves in a precarious spot during late 2022, where we risk financial ruin as business and consumer defaults could mushroom with little warning. Don’t take my word for it. Financial experts and corporate managers from Amazon’s founder Jeff Bezos here to JPMorgan Chase’s CEO Jamie Dimon here have been warning of trouble for months. These two individuals perhaps have the best view of data on the economy as anyone.
To fully support (1) a growing economy, (2) mildly rising inflation [necessary to continue America’s “soft default” on unpayable debts discussed in previous articles], and (3) the potential for a skyrocketing federal deficit, I predict the Fed will have to relent and print more money in 2023, maybe with record rates of QE bond buying again. Yet, our central bank is stuck tightening until something breaks (for example: the economic expansion falters, the U.S. dollar’s value drops out of the blue, bond market liquidity dries up, or equity market pricing sinks dramatically). If Fed governors vote to drop rates prematurely, inflation rates could stay high and/or the dollar will begin to collapse in demand and value.
Lack of M2 Money Growth Getting Scary
My last bullish bond argument that a recession and declining inflation rates are getting near has to do with the monster contraction in basic M2 money stock growth vs. 2021. On the chart below you can review how YoY gains in underlying money creation (really the lifeblood of inflationary forces and consumer spending) has tanked from +26% to under +2.5% today. On the 60-year graph below, you can see low M2 growth rates are strongly correlated with minor (typically declining) inflation rates. 1970, the early 1990s, and 2010 were the only times YoY M2 expansion was lower than November 2022. The average CPI advance of 2.8% 12 months later, using prior instances of +2.5% M2, is a hopeful signal for bond owners. The sharpest ever rise in M2 during 2020-21 supported our spike to 40-year high inflation. What will the biggest historical drop in M2 expansion during 2022 bring for the 2023-24 economy?
YCharts – YoY Growth for U.S. M2 Money Supply vs. CPI Inflation, Since 1963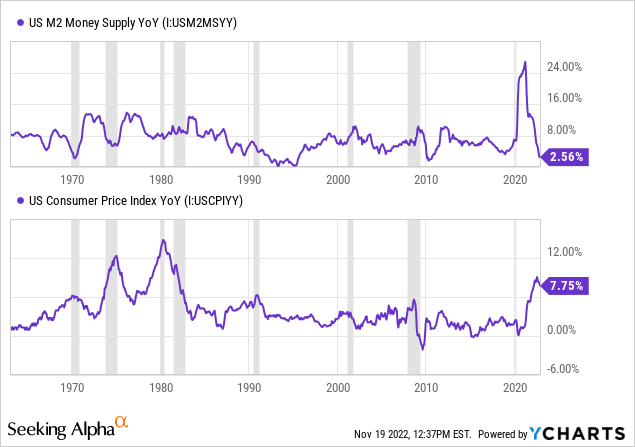
Trading Risks and Strategy
What’s are the main risks to bond ownership? I can think of a variety of potential bond selling catalysts from deep recession and spiking Treasury default risk to a declining dollar affecting import prices. To me, I am most worried about the dollar’s value. If foreigner investors to give up on American investments, all sorts of financial trouble would hit quickly. Specifically, macroeconomic worries revolving around a sinking dollar could launch inflation rates well above 10%, under worst-case scenarios (with an import/export component on 40% of all goods in the U.S. economy). Other inflation risks include any U.S. military loss overseas collapsing confidence in the dollar, a serious political fracture in our government leads to all kinds of economic turmoil, and the potential for a Middle East war surging oil prices above $200 a barrel. For sure these are hard to imagine outlier risks. But who saw the COVID-19 pandemic coming? Stuff happens.
In IRAs/401Ks, I moved 20% of my total portfolio from cash to long-term bonds last week, with a sizable 50% cash stake still my liquid and safety-minded short-term exposure (now earning 3%+ for yield). 20% is parked in gold/silver/platinum ideas, which usually lead the stock market out of a recession bottom or liquidity crisis. Gold and silver are also great hedges against massive geopolitical change in the world, alongside dollar devaluations over time. The remaining 10% is invested in my favorite stocks as regular equity exposure. My working plan is to add another 10% to 20% to bonds in coming weeks, exchanging cash for the position.
The logic is acquiring immediate 4% to 5% dividend yields from investments “safer” than equities in a serious recession may be the best battle plan going forward. In the end, if the Fed can slow inflation and soon finds it necessary to fight rising unemployment and declining real GDP next year, long bonds will almost surely rise a little in price. My research suggests long-dated bonds can outline +10% to +15% total returns next year, likely better than S&P 500 returns for 2023 in a recession. There are scenarios where small losses to outsized gains are also possible.
Essentially, long-term bond buyers may benefit from weaker economic demand trends, falling inflation rates, and flight-to-safety investment buying, while potentially front running another QE buying effort by the Fed. Offsetting your possible job loss and stock market portfolio in decline, one angle to earn a buck in 2023 may be to take a position in U.S. bonds today. Food for the thought anyway.
Thanks for reading. Please consider this article a first step in your due diligence process. Consulting with a registered and experienced investment advisor is recommended before making any trade.
Be the first to comment