

ZargonDesign/E+ via Getty Images
“Recession”
It is probably the most commonly used term in financial literature these days. The Russia-Ukraine war is causing a new surge of (energy) inflation. Meanwhile, unprecedented quantitative easing by the FED will make place for quantitative tightening in the coming quarters.
Over the past months, we already witnessed the first signs of weakening economic activity on consumers and businesses. Consumer sentiment reached its lowest level in over a decade as purchasing power falters. Company earnings guides during the fourth quarter of 2021 were the weakest in over five years as demand is falling off a cliff compared to previous expectations.
Last week, concerns regarding a potential recession intensified as the most accurate leading indicator for a recession sent an ultimate warning signal.
On Tuesday 2022/03/29, the 10 year minus 2 year treasury yield spread dropped below zero for the first time since August 2019. Since 1955, this event was followed by a recession for 9 out of 10 times.
A recession seems imminent.
Astonishingly, the stock market is rallying while all these recession concerns are intensifying. After its 10% gain from the bottom less than a month ago, the S&P 500 (SPY) index is on track to reach new all-time highs.
“How is this possible?”, I hear you thinking. Maybe these recession concerns are overblown? Or maybe they aren’t, but the impact on the stock market is not that bad as some are assuming?
In this article, I will provide valuable information regarding the recession fears and how you should manage your portfolio during these challenging times.
Why Does The 10Y-2Y Yield Spread Predict Recessions So Well?
Insider Opportunities based on FRED data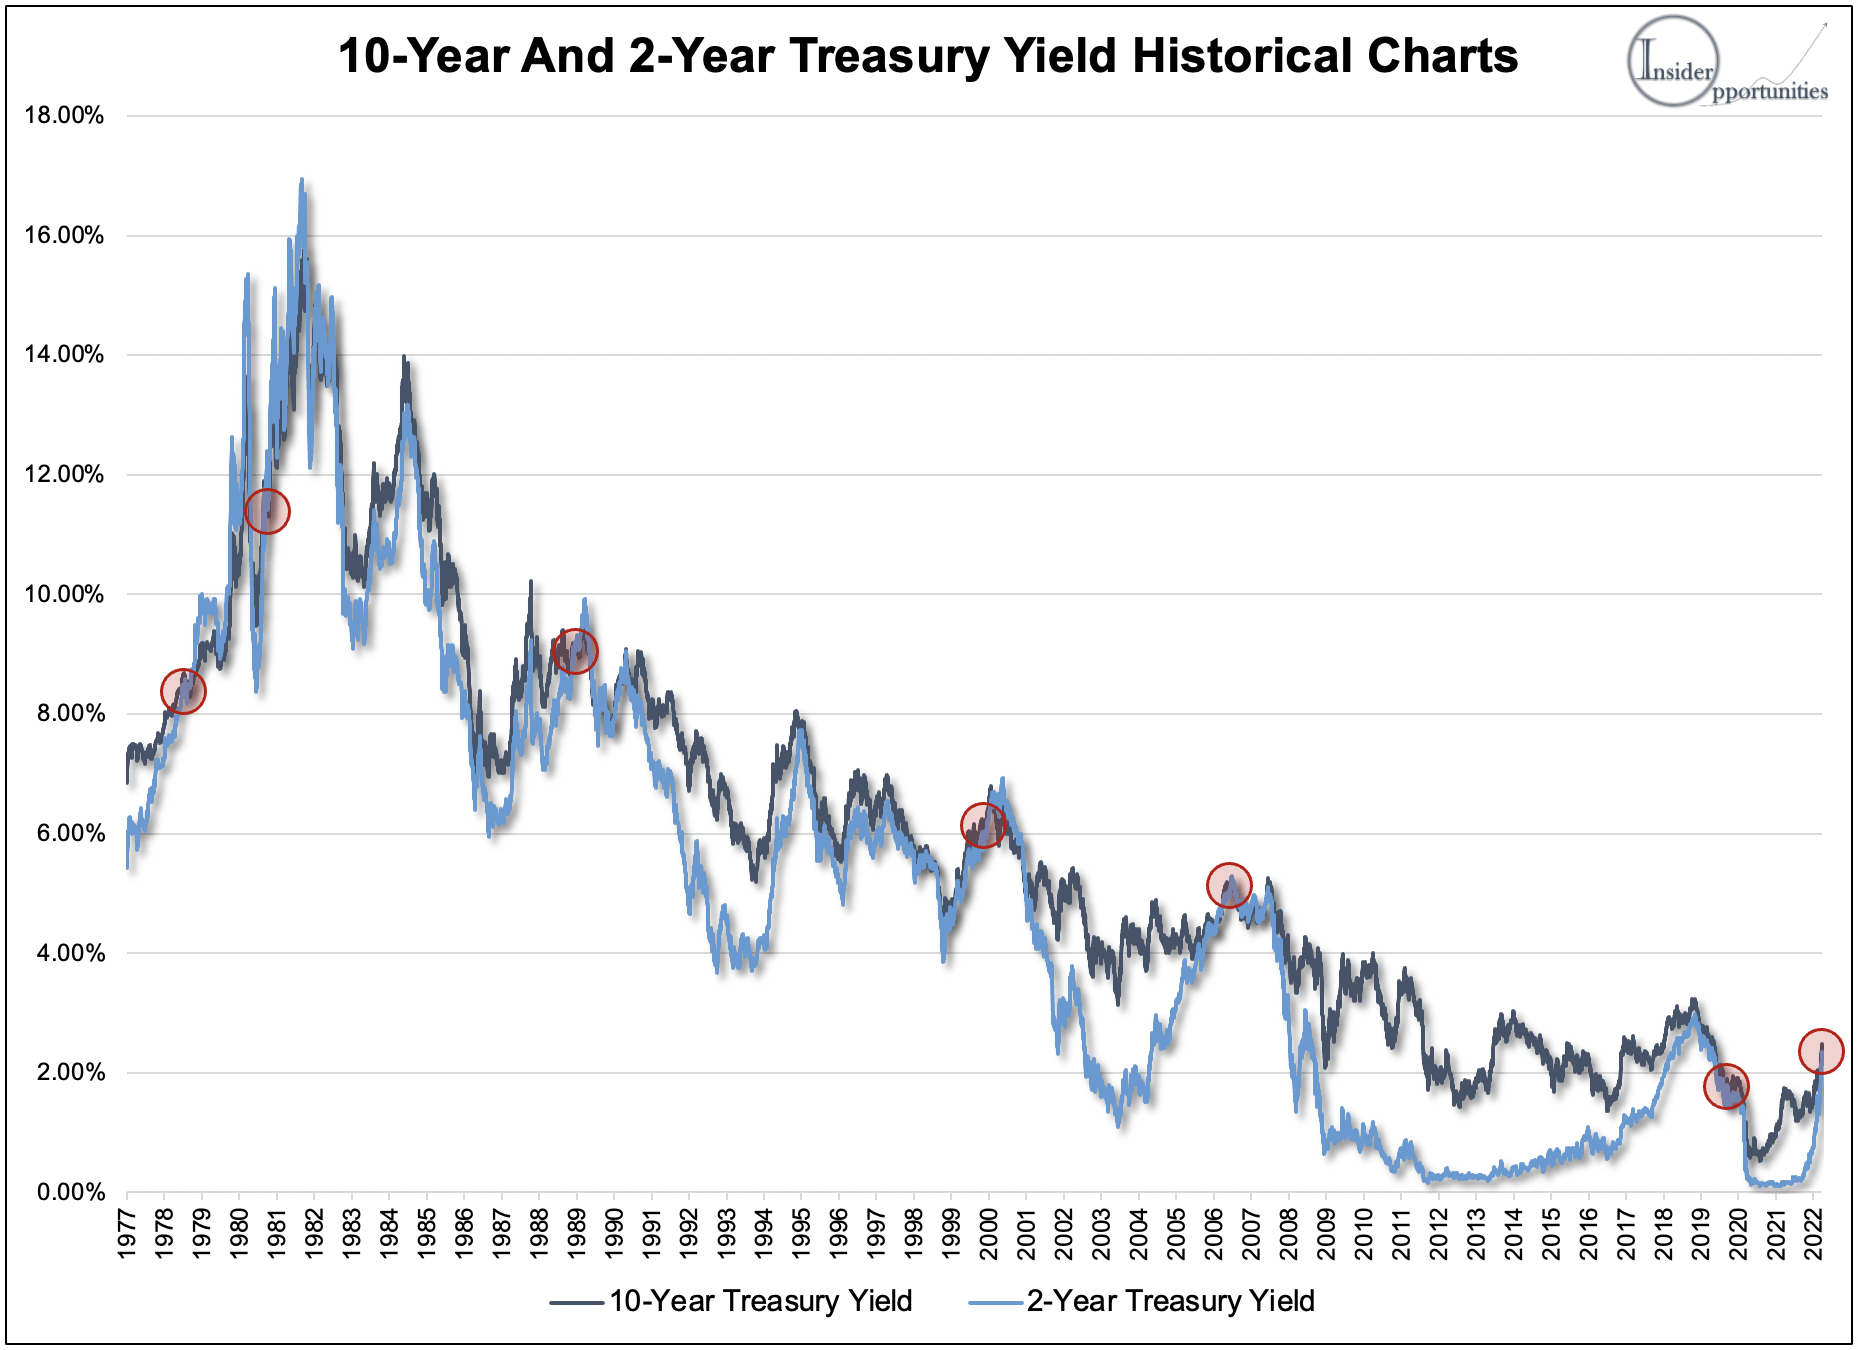
To be able to fund government spending, the U.S. Treasury raises debt by selling bonds on the open market. This debt goes from short-term maturities of one month (also called T-bills) to longer-term duration bonds of as much as 30 years (also called Treasuries). They pay an interest on this bond (the yield) and pay back the value once it matures. After they are issued, these bonds are constantly traded on the financial market.
Investors always want to be compensated with a higher return if they take on more risks. The longer the duration of the bonds, the higher the risk that the government won’t be able to pay it back (a lot more can go wrong in 30 years than in one month). As such, short-duration bonds are typically trading at a lower yield than long-duration bonds.
This phenomenon can be observed in the chart above. On average, the 10-year treasury (dark line) yields 0.9% more than the 2-year treasury (light line). In other words, investors are rewarded with an additional return of almost 1% per year by taking on more risks.
However, in some rare occurrences the 2-year yield drops below the 10-year yield, as indicated with red circles in the chart above. In jargon, this is also called an “inversion” of the curve.
So what does this 10-2Y yield inversion have to do with our economy?
Financial parties are constantly trading US government bonds on the market based on expectations around future movements of the FED funds rate. As such, the x-year treasury yield is a function of where market participants expect the FED funds rate to be in x years. The FED raises its rates when the economy is too hot and lowers its rates when the economy is too weak.
When the 2-year yield rises above the 10-year yield, this means that investors anticipate on a sharp rise of the FED funds rate in the near term together with a decline of the FED funds rate afterwards.
In other words, an inversion of the 10-2 year yield curve indicates that a red-hot economy in the short term would be impaired by rising rates from the FED. Afterwards, the FED is obligated to stimulate the impaired economy by lowering rates again. Between these two occurrences, a rising rate environment and a declining rate environment, a recession typically occurs.
According to this report, each recession since 1955 is preceded by an inverted yield curve. The other way around, 9 out of 10 yield curve inversions during this period have been followed by recessions.
The correlation between the 10-2 year yield curve and recession is impressive.
To make this more clear to you, I visualized this correlation in the chart below which shows data since 1977. As you can observe, the yield curve inverted seven times during this period and has always been followed by a recession:
- August 1978 – February 1980: the yield curve inverted as the market was anticipating on rising FED funds rate to battle red-hot inflation. 18 months later, a recession occurred.
- September 1980 – July 1981: financial turmoil was so significant during this period of extremely high inflation that a second recession occurred a little over one year later. This time, the recession was preceded by an inversion of the 10-2 yield curve 10 months in advance. Also, the yield curve inverted another time during the recession itself.
- December 1988 – July 1990: the yield curve inverted as the market was anticipating on monetary tightening by the FED to battle a resurgence of inflation. This eventually led to a mild recession 19 months after the inversion.
- February 2000 – March 2001: the combination of a bubble in stock market valuations and a red-hot economy led to significant monetary tightening by the FED. A recession occurred 13 months after the yield curve inverted.
- February 2006 – December 2007: the bubble in the real estate market and excessive risk taking by banks first inflated the economy, but was later followed by a bust. The inverted yield curve anticipated this severe recession 22 months in advance.
- August 2019 – April 2020: the yield curve inverted in anticipation on rising FED funds rate to cool off the economy, followed by a recession. Eventually, the Covid-19 pandemic might have pushed forward the recession which was destined to happen. In this case, the gap between the inversion and the recession was the lowest in history at 8 months.
On March 29, 2022, the yield curve inverted for the eighth time in 45 years. Again, it is very likely that this event will be followed by a recession.
However, the timing of this recession is highly uncertain. Based on history, a recession might occur as early as late-2022 and as late as mid-2024.
Insider Opportunities based on FRED data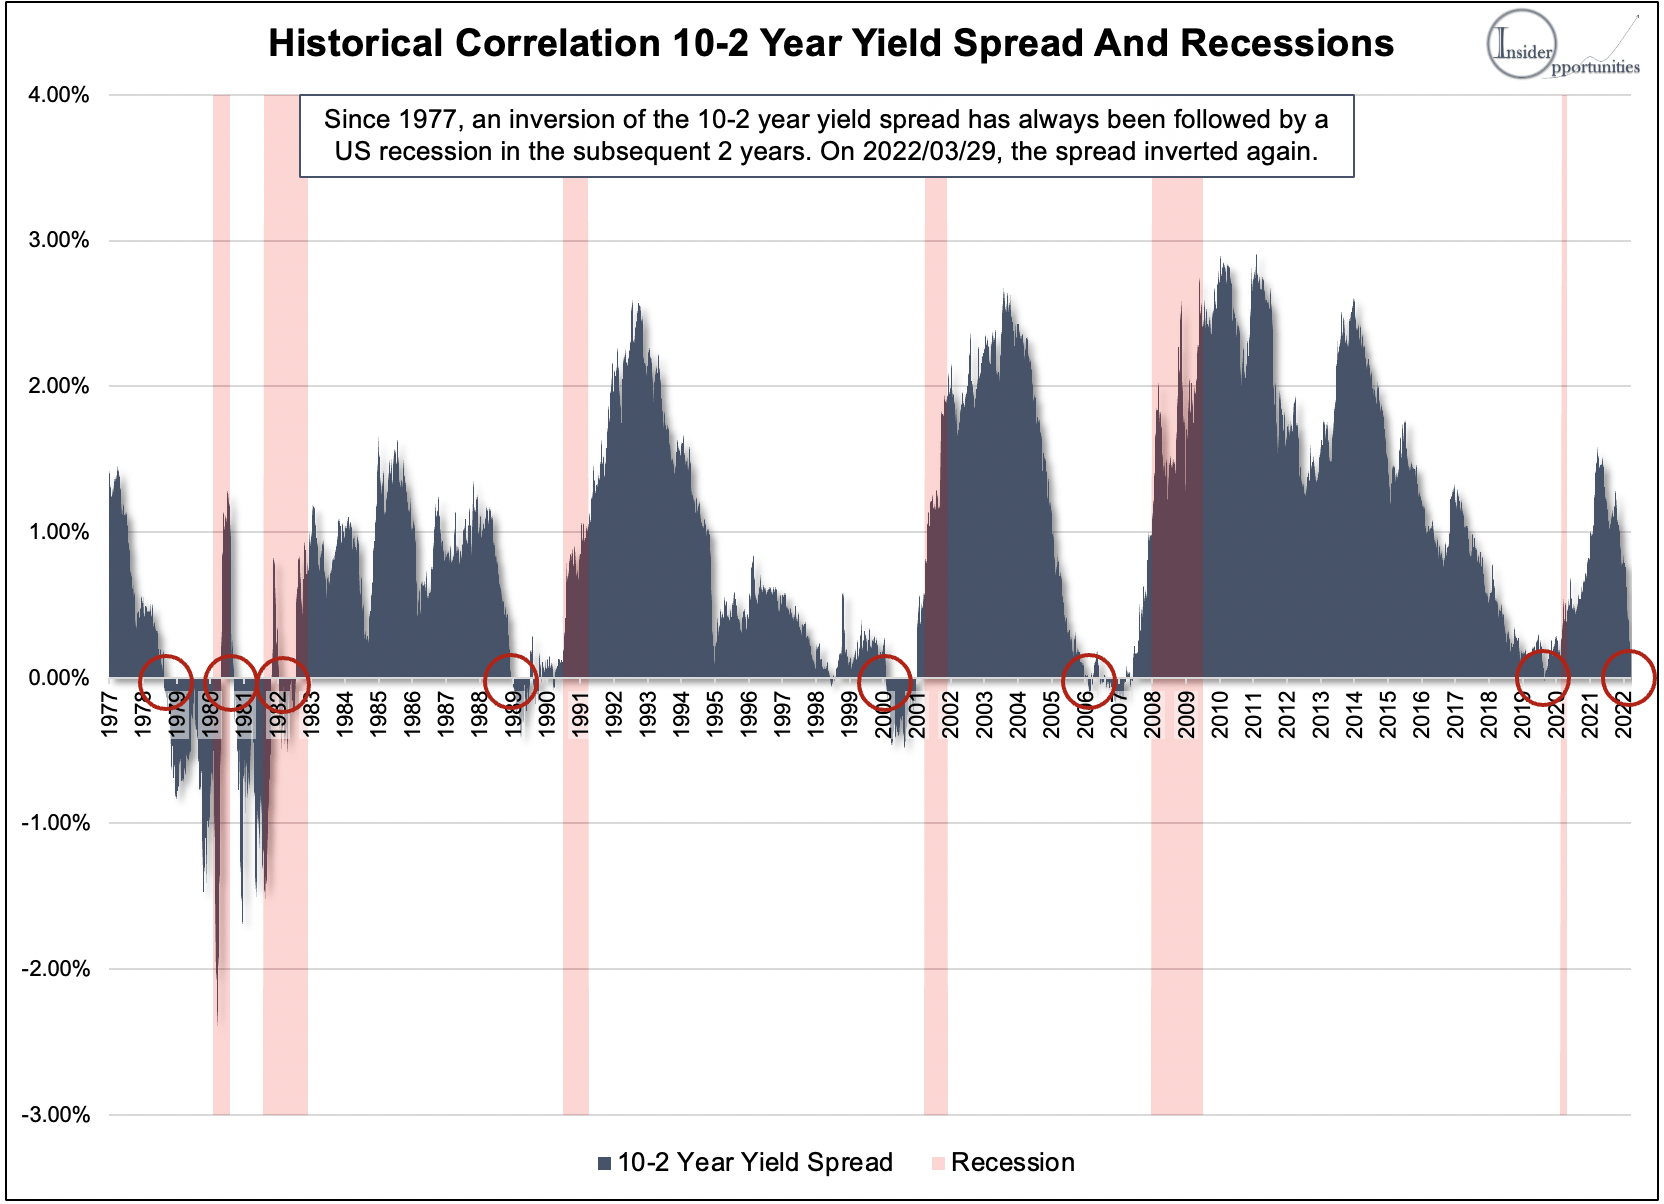
What an inverted 10-2 Yield Curve Means For The Stock Market
The stock market is not the economy and the economy is not the stock market.
Previously, we After having discussed the impact of an inverted yield curve on the economy (followed by a recession after 8-22 months), let’s now discuss how it might impact the stock market.
Below, I added a very interesting chart which plots the 10-2 year yield spread against the forward 1-year return of the S&P 500. This visualization given us a good indication of what might happen with the stock market in the coming year.
Astonishingly, only 1/7 times in history an inverted yield curve has been a strong short-term sell signal.
The inversion in February 2000 occurred very close to the stock market peak of the dot com bubble. It was swiftly followed by a one-year downturn of as much as 34% and multi-year bear market.
In the other six cases, becoming highly bearish about the stock market after a yield curve inversion has not worked out well.
In some cases (1978, 1988, 2006) the stock market rallied for much longer before starting its downturn. This could be explained by the fact that an inverted yield curve is first followed by a very strong economy, before a recession occurs.
In other cases (1980, 1982, 2019), the stock market declined rather quickly, but the swift recovery afterwards has been much stronger.
| # days before S&P 500 peak | Return to S&P 500 peak | # days from peak to bottom | Return to S&P 500 bottom | |
| 8/18/1978 | 544 days | 14.8% | 43 days | -21.6% |
| 9/12/1980 | 77 days | 13.5% | 623 days | -27.6% |
| 1/14/1982 | 15 days | 6.4% | 196 days | -15.6% |
| 12/13/1988 | 577 days | 33.8% | 87 days | -20.1% |
| 2/11/2000 | 50 days | 9.7% | 934 days | -51.0% |
| 01/31/2006 | 617 days |
23.0% |
512 days | -57.7% |
| 08/27/2019 | 176 days | 17.3% | 33 days | -35.4% |
| Average | 294 days | 16.9% | 347 days | -32.7% |
Insider Opportunities with FRED and Finance Yahoo data
Investor Takeaway for 2022, A Year With A Potential Recession On The Edge
The market is full of valuable information. You just need to know where to look.
The US 10-2Y yield curve is a powerful indicator of how the economy will evolve in the future. Today’s inversion of this curve tells us that the economy will likely be red-hot in the near term, followed by a recession due to monetary tightening. This recession will likely occur in 8-22 months from now.
Should we therefore be bearish about the stock market in 2022 and beyond? Not necessarily, based on two reasons:
- An inverted yield curve has historically been followed by strong stock market gains in the short-to-mid-term. On average, the stock market rallied by 16.9% and 10 months before a downturn occurred.
- An economic recession is not necessarily a disaster for stocks in the long term either. In several cases, the short-term gains and swift recovery after the downturn more than offset the downturn itself. With the dot com bubble and Great Recession still fresh in our mind, investors often forget that a “mild recession” like in 1988 is one of the possibilities as well.
Yes, you should definitely be aware of long-term economic cycles.
However, there is one thing in the market which should be much more important for your investment decisions: market sentiment (fear & greed). Understanding this will improve your returns dramatically.
As discussed in my recent article “Bottom Predictor Urges You To Buy The Current Dip”, the market moves in cycles based on sentiment. At Insider Opportunities, we track this sentiment with our IO Opportunities & Risks Index.
A high-greed read-out (indicated in red) has historically been followed by very weak returns for the small-cap Russell 2000 Index (IWM).
In contrast, a high-fear read-out (indicated in green) has historically been followed by very strong returns.
Insider Opportunities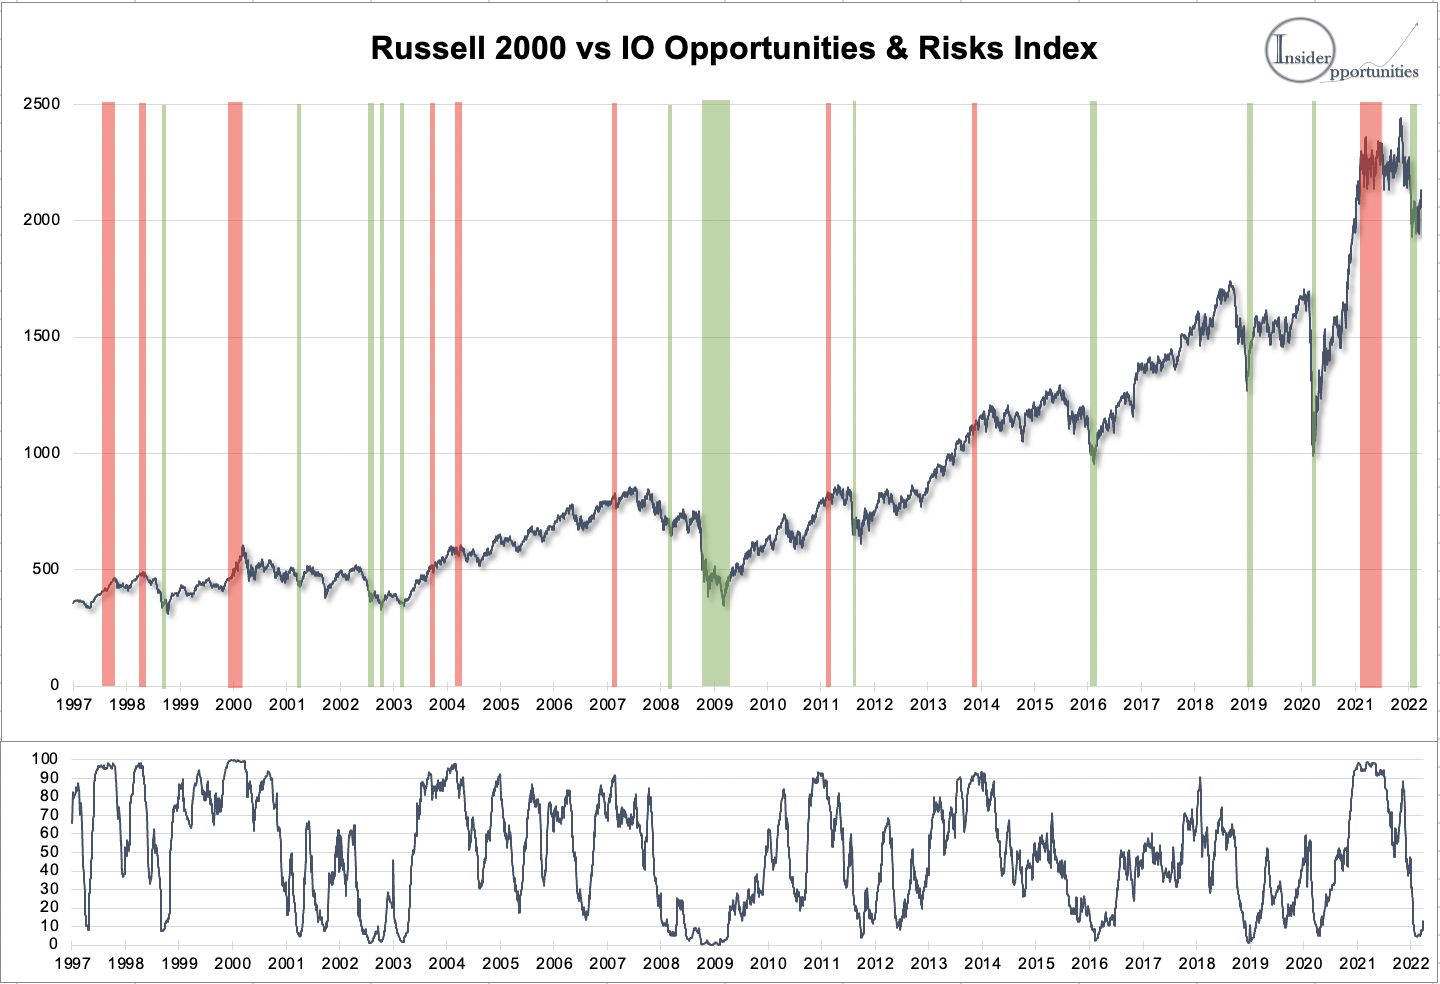
The data is perhaps even more impressive when visualized in a table. As you can observe below, the IO O&R Index has predicted future stock market returns very accurately, especially in the mid-to-long-term.
For example, the average read-out below 5 was followed by a 1-year return of 28.3%. Meanwhile, a read-out above 95 was followed by a negative 1-year return of -4.94%.
Insider Opportunities; data since 1997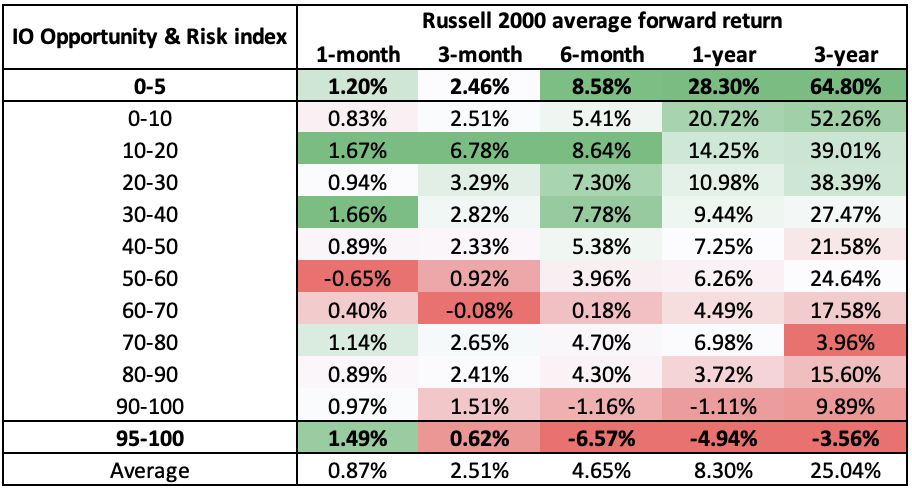
How does this translate to today?
If the yield curve inversion would have been accompanied with high greed in the market, similarly to early-2000 when the Nasdaq (QQQ) collapsed quickly, I would be highly bearish on the markets.
Luckily, this is not the case.
In fact, the O&R Index dipped below 5 (extreme fear) as Russia invaded Ukraine. While everyone was selling out and buying hedges, we urged our members to heavily buy the dip on February 24:
Insider Opportunities chat room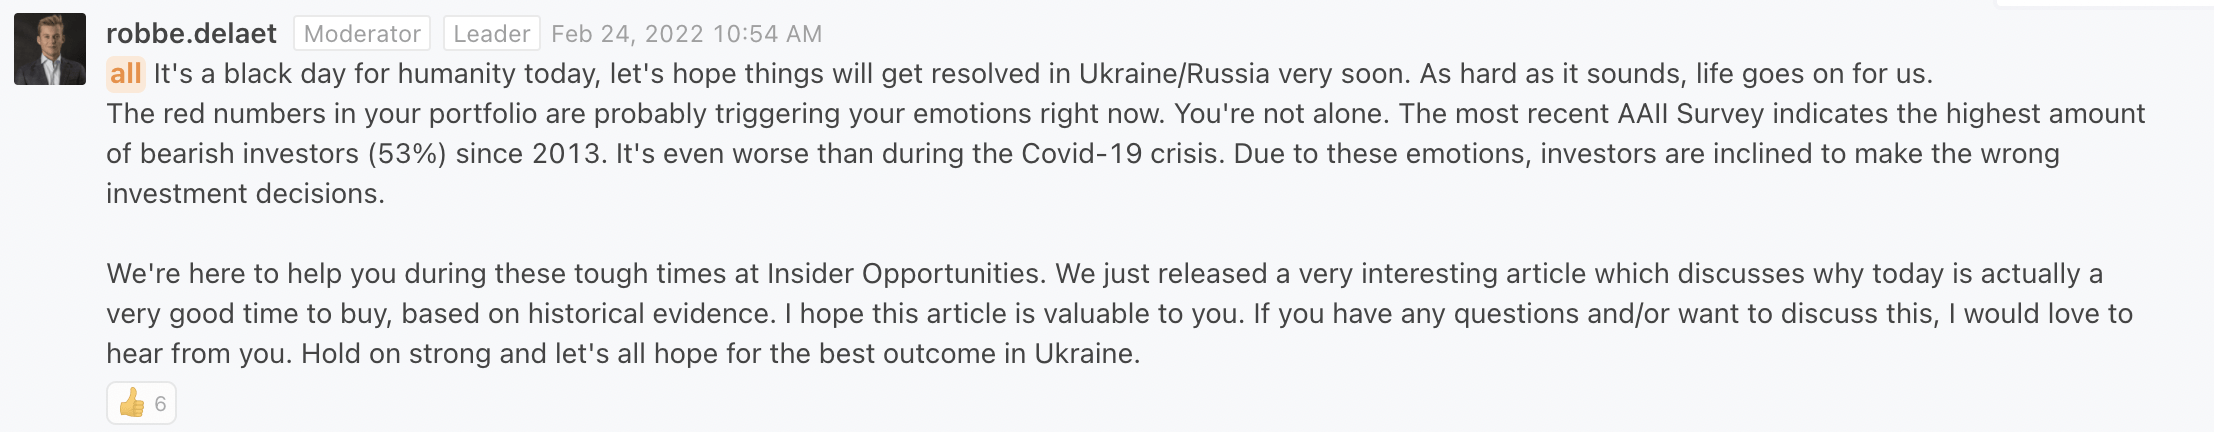
The O&R Index is an eye-opener.
Last month, everyone has been astonished by the massive rebound in the markets. Investors who understand the impact of sentiment on markets, weren’t.
So what’s next? Our O&R Index is currently trading at 12.9, which indicates that there is still significant upside ahead as investors become less fearful. A similar scenario to 2006 and 2019 is definitely possible: continued gains despite looming recession fears.
After being defensive in 2021, we started being more aggressive with our Insider Outperformance Portfolio over the last months and are continuing to do so as long as fear dominates the market.
However, it is more important than ever to be more skeptical than ever in your stock picking. With inflation at 40-year highs and an economic downturn on the edge, you should avoid companies with limited pricing power and high exposure to economic cycles. For example, for the coming 3 years I’m bearish on tech stocks like Apple (AAPL), Tesla (TSLA) and Nvidia (NVDA). While I’m a long-term bull on these names, their valuations are not at all reflecting a significant slowdown in demand, which is definitely bound to happen.
Buying stocks which are attractively valued compared to their future prospects (taking into account the inflation and recession) will continue to generate tremendous returns. That’s what we are currently doing at Insider Opportunities. We find such stocks by following insider purchases with our in-house algorithms.
For example, we remain very bullish on Vertex Pharmaceuticals (VRTX) which has an undisputed monopoly on drugs to battle the life-threatening Cystic Fibrosis disease. They won’t be impacted by worsening economic conditions at all. Despite the 17% year-to-date return, this high-quality growth stock (37% revenue CAGR, 66% ROIC) remains undervalued at an 18x fwd P/E. Vertex came on our radar as a Golden Idea after insiders Sachs (director) and Rahma (“CEO”) purchased respectively $6 mln and $2 mln worth of shares.
I am looking forward to continue building wealth in the market by being long in great companies as long as sentiment remains below “greed” levels. Don’t let noise in the market distract you from your investment journey.
Be the first to comment