


ChristianNasca/E+ via Getty Images
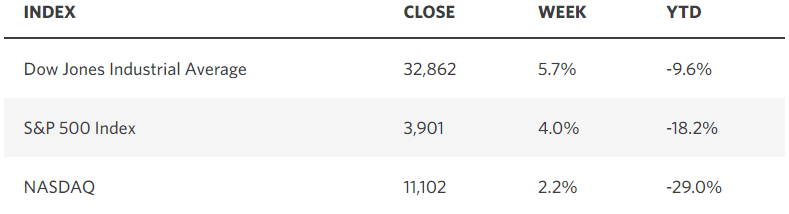
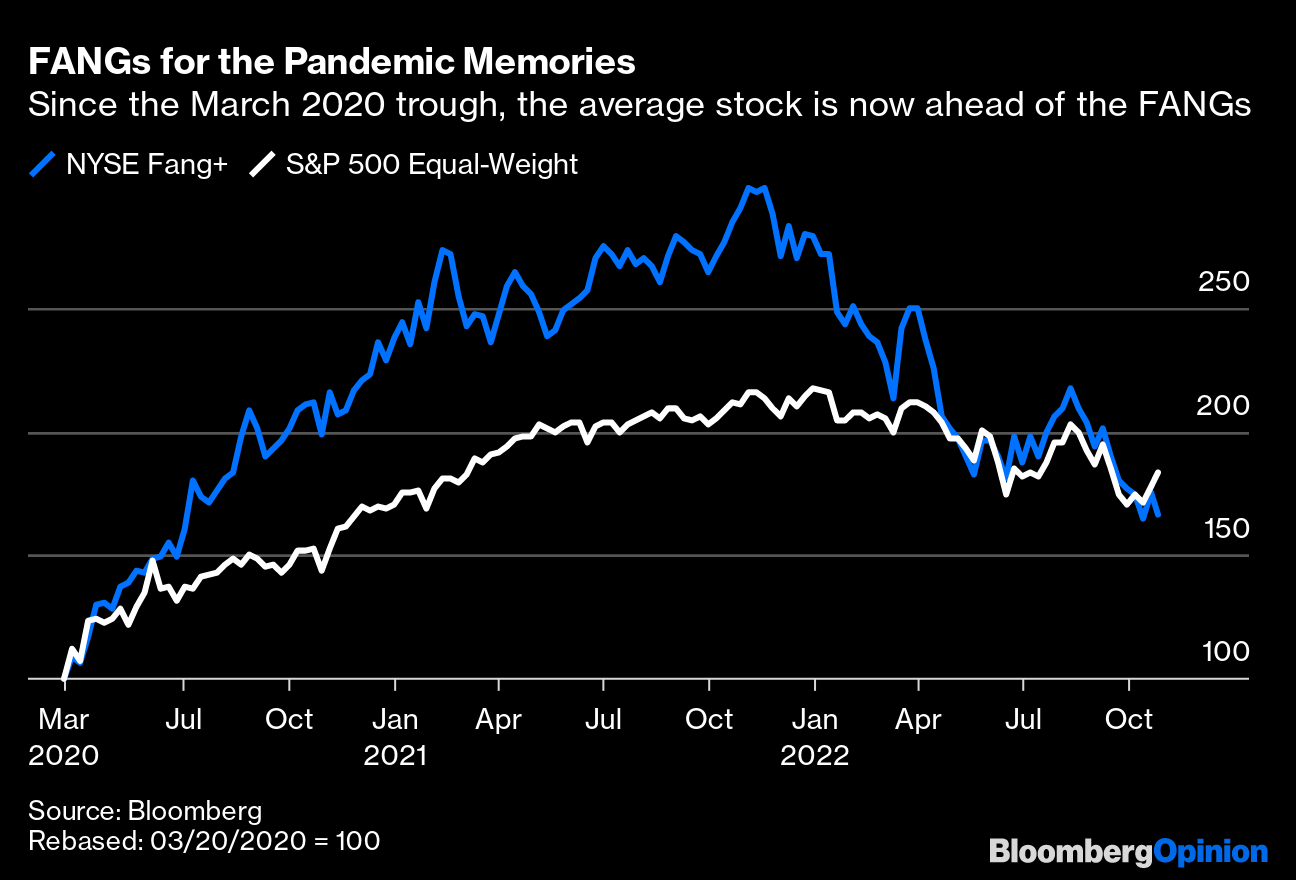
My expectation for a fourth-quarter rally is firmly on track, and we have yet to conclude the midterm elections, which have historically been followed by much higher stock prices. The Dow is already up 14.4% for the month of October, which ranks as the 10th best month for that index since 1915. Stocks soared last week, despite dismal performances from the likes of Meta Platforms (Facebook), Amazon, and Alphabet (Google), which are three of the largest weightings in the index. In fact, the performance of the FAANG stocks, which also includes Netflix and Apple, has been so poor this year that the equal-weighted version of the index is now outperforming the one that is market cap weighted dating back to the March 2020 low.
Edward Jones
Wall Street strategists with a bearish take on next year claim that poor performance from these titans of technology foreshadows poor performance for the remaining constituents of the index, but that is not the historical precedent. The generals are typically the last to fall on the battlefield of a bear market, and the three that collapsed last week are all five stars. This is a sign of the end and not the beginning.
Bloomberg
According to FactSet, corporate profit growth has slowed to what is now just 2.2% halfway through earnings season, which is down from 2.8% expected at the end of the quarter, but up from the 1.3% rate at the end of last week. Revenue growth of 9.3% today is better than expectations for 8.7% at the end of the quarter. While the consensus has lowered earnings growth expectations for next year from 10% to 6.4%, which is part of the bottoming process, I think the 20-30% declines in the S&P 500 and Nasdaq Composite have accounted for this deceleration. This is why the broad market, led by the average stock, is turning up.
The bears see a larger adjustment in valuations coming based on today’s level of inflation, but if the rate of inflation is halved next year, as I expect, then it should support higher valuations for the average stock than we see today. Markets look forward, while inflation is a backward looking indicator.
I view last week’s economic data as consistent with the soft landing I still expect to see in 2023. The rate of economic growth in the third quarter rebounded to 2.6% from the declines seen in the first two quarters, but the strength was as overstated as the weakness was during the first half of the year. Third-quarter growth was largely driven by an improvement in the trade deficit, reversing its deterioration that resulted in negative headline numbers during the first half of the year. What has remained consistent all year long is consumer spending growth, albeit at a very slow rate. That’s what we want to see in a soft landing scenario.
Wages grew 5% during the third quarter, which was a modest cooling from the previous quarter, and the Fed’s preferred inflation gauge (core personal-consumption expenditures index) declined to an annualized 4.2% from 7.3%. This combination of softer but still positive economic growth with a decelerating rate of inflation is why bond yields declined last week, fueling the rise in stock prices. That trend looks like it will continue into October.
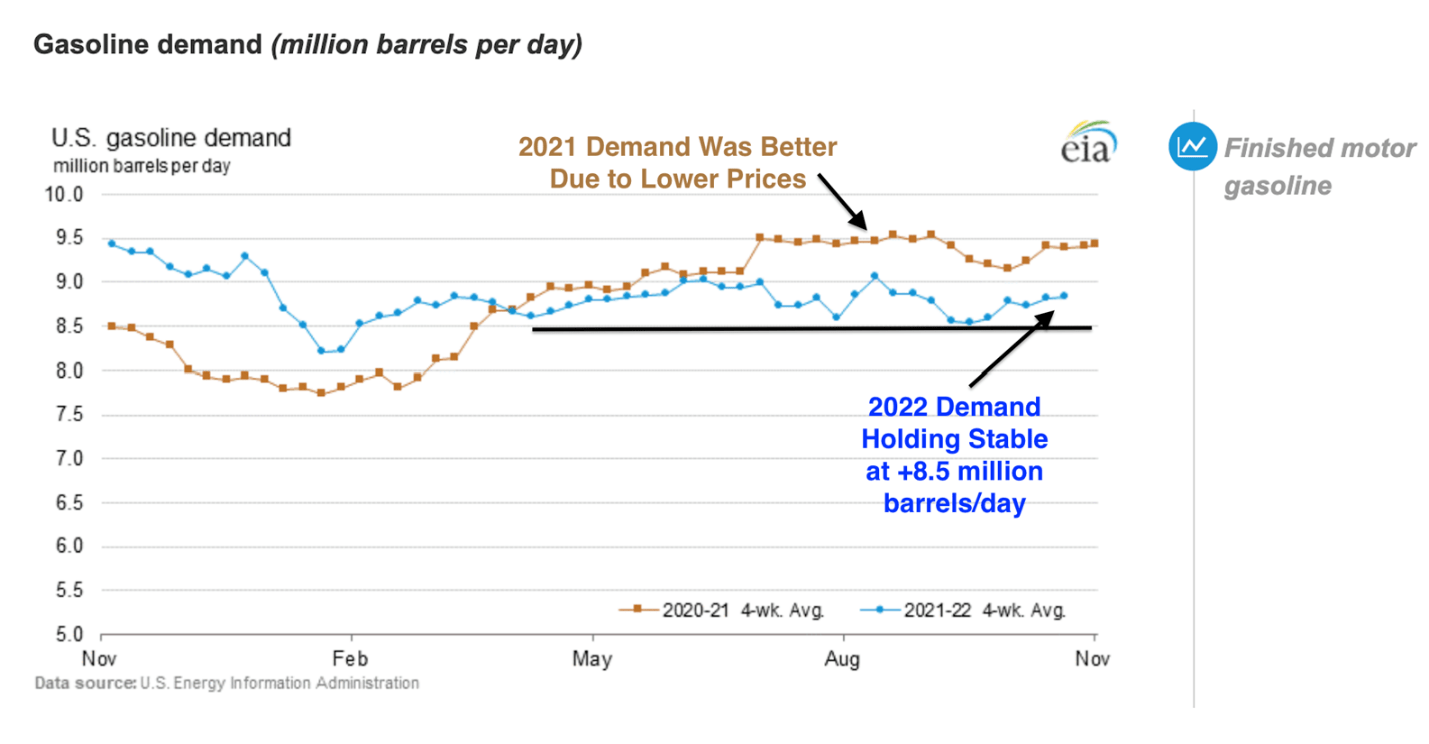
According to the latest gasoline demand statistics, which are an excellent real-time pulse on consumer spending, demand today is down 6.4% from last year’s level, but that is because prices are higher. The most important development is that demand is stable, which suggests the rate of growth is also stable.
DataTrek
I think that if we were going to see a sharp decline in consumer spending, which is our engine of growth, we would have seen it by now. What we have seen and will continue to see is shifts in preferences. The initial shift was from goods to services, but that may reverse in the months ahead as goods become more readily available and prices come down. While wage gains may slow, the rate of inflation should fall at a faster rate, reviving real wage growth during 2023, which would be a new tailwind for economic growth.
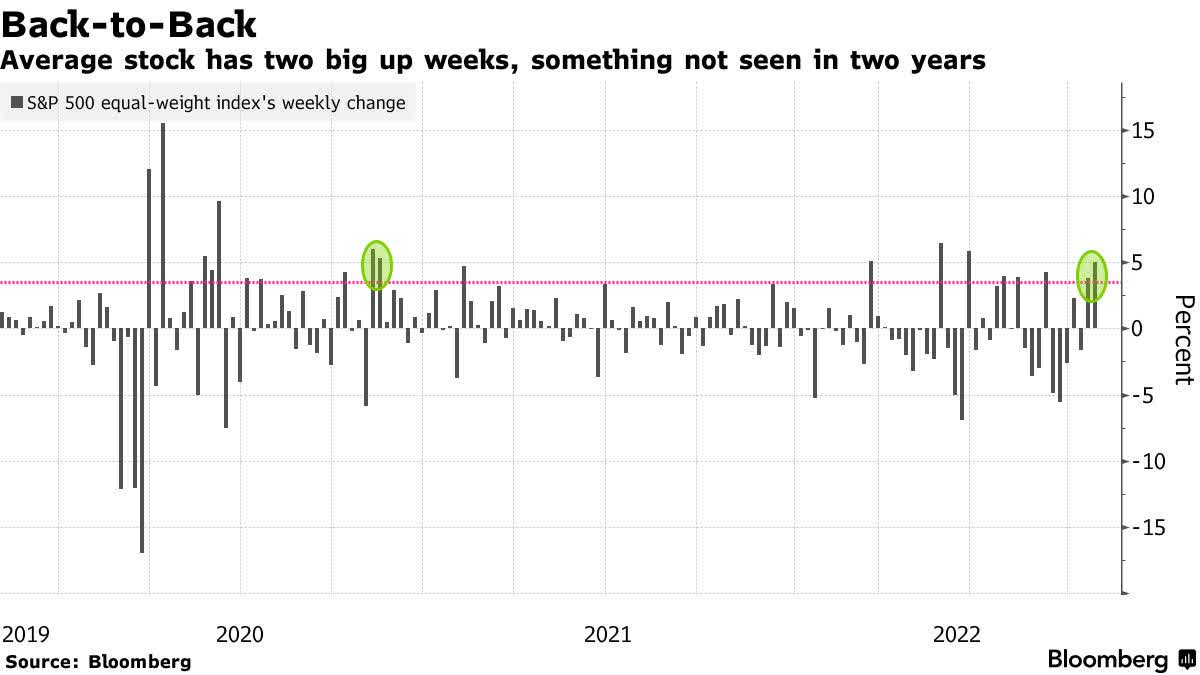
Positivity has not been popular over the past few months, but it is starting to surface in the market internals, which gives me a lot more confidence in my outlook. At the same time our market bellwethers are finally capitulating, the average stock, as measured by the equal-weighted S&P 500 has had its best two-week performance in two years. Again, this is not what you typically see on the cusp of another major downturn in the broad market.
Bloomberg
Another example of how this market is strengthening can been seen in the outperformance of the more domestically-focused Russell 2000 index. Unlike the S&P 500, this index bottomed in June and was followed by a higher low in October. The next test is the 200-day moving average less than 2% above Friday’s close . A breakout above this long-term moving average would be another bullish sign for the economy and the broad market.
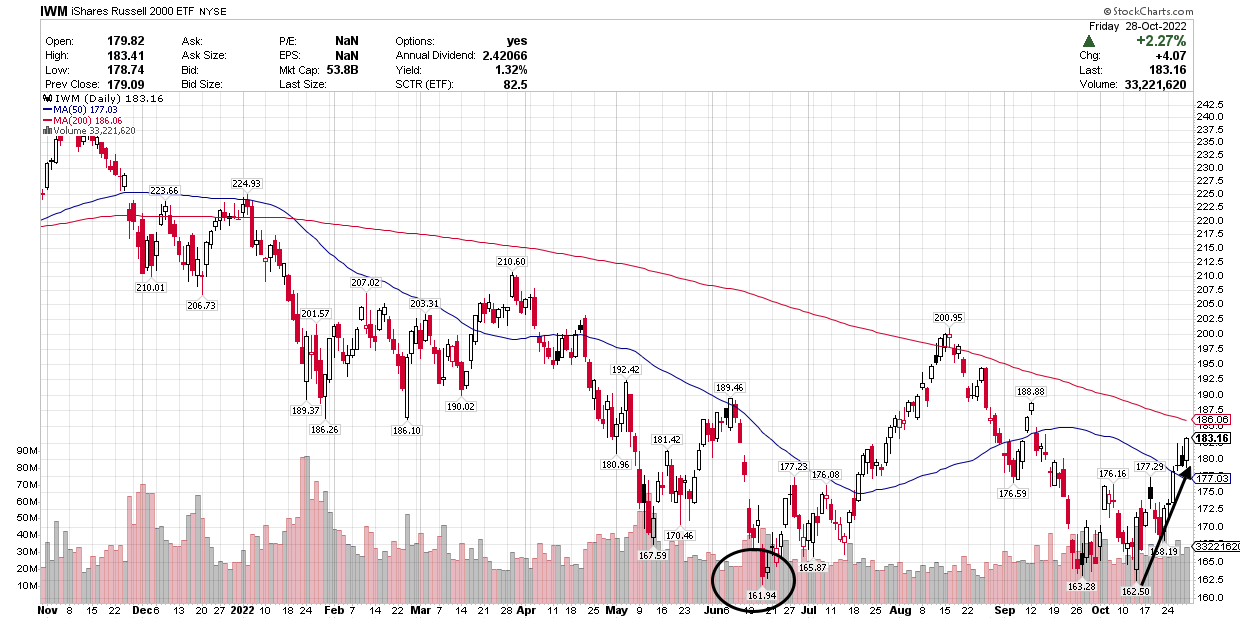
Stockcharts
Despite the perceived value in growth stocks after the more than 30% decline in the Nasdaq Composite, I still think it is time for value stocks to have their day in the sun. That day probably last several years, as value has been underperforming growth ever since the Great Financial Crisis some 15 years ago. That means a focus on low P/E stocks with attractive dividend yields that can churn out modest but consistent growth.
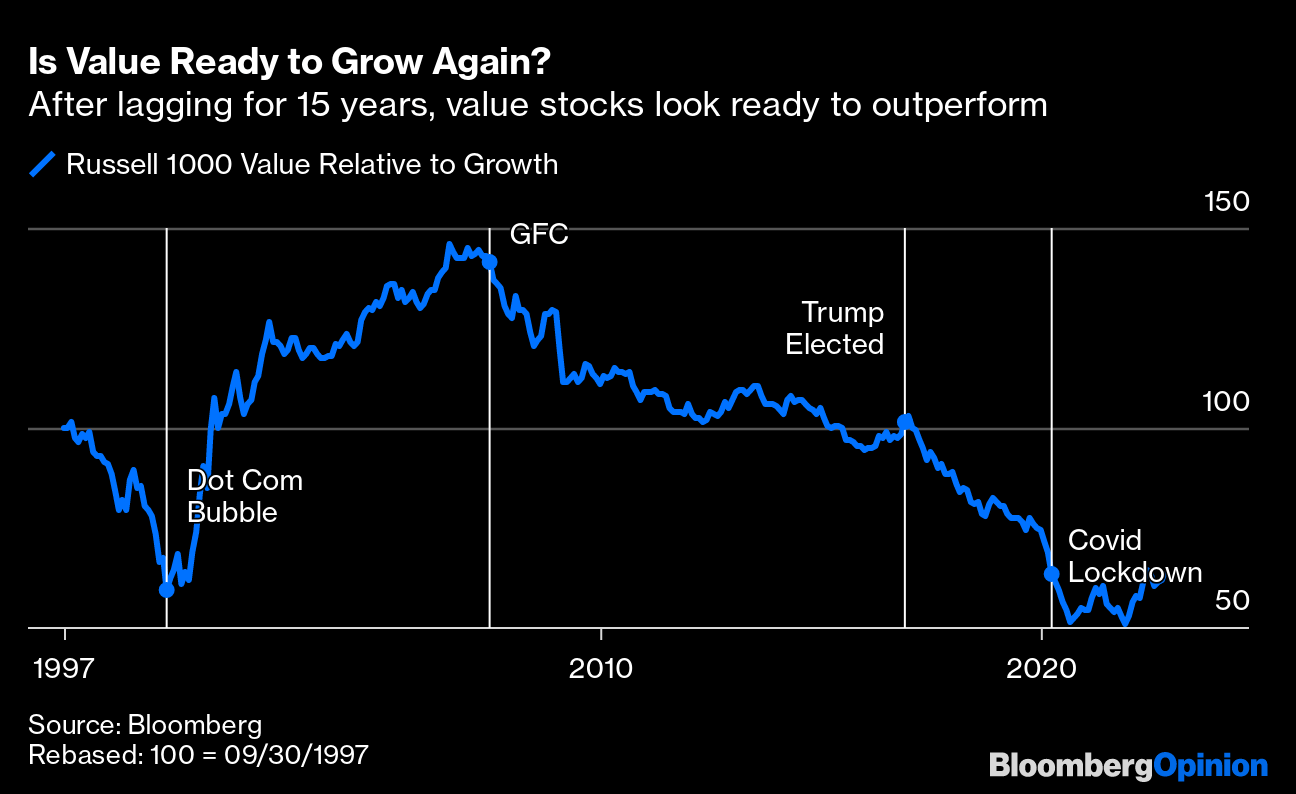
Bloomberg
Economic Data
This week all eyes will be focused on the Fed policy rate decision on Wednesday afternoon, followed by Chairman Powell’s press conference. The consensus expects a 75-basis-point rate increase to 3.75%. The unknown is how Powell frames policy moving forward in his commentary. Friday we have the jobs report for October.
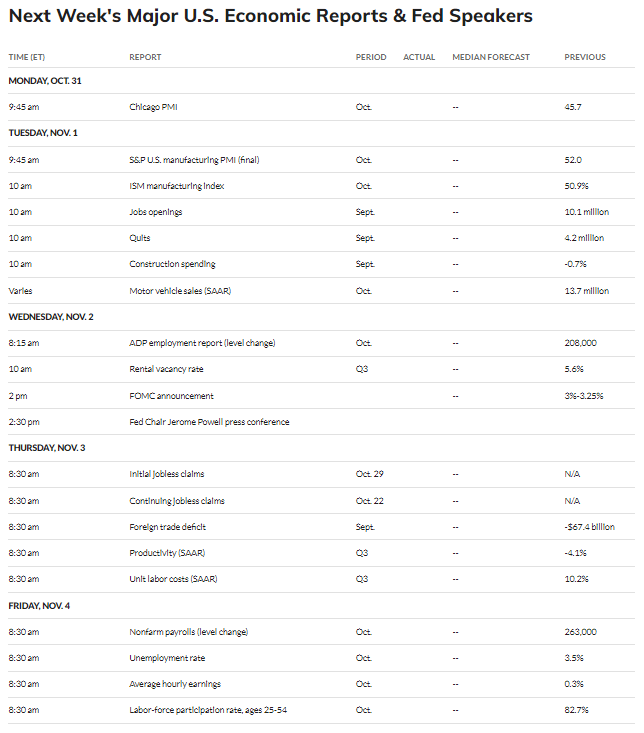
MarketWatch
Technical Picture
I can see the S&P 500 advancing to its 200-day moving average at approximately 4,150 in the near term, but that will likely be a battle line that takes more than one attempt to surpass. Look for some consolidation around that level, if reached, before we can challenge the August highs. The drag from the largest market caps that plunged the index to new lows should largely be over now after last week. That’s a plus moving forward.
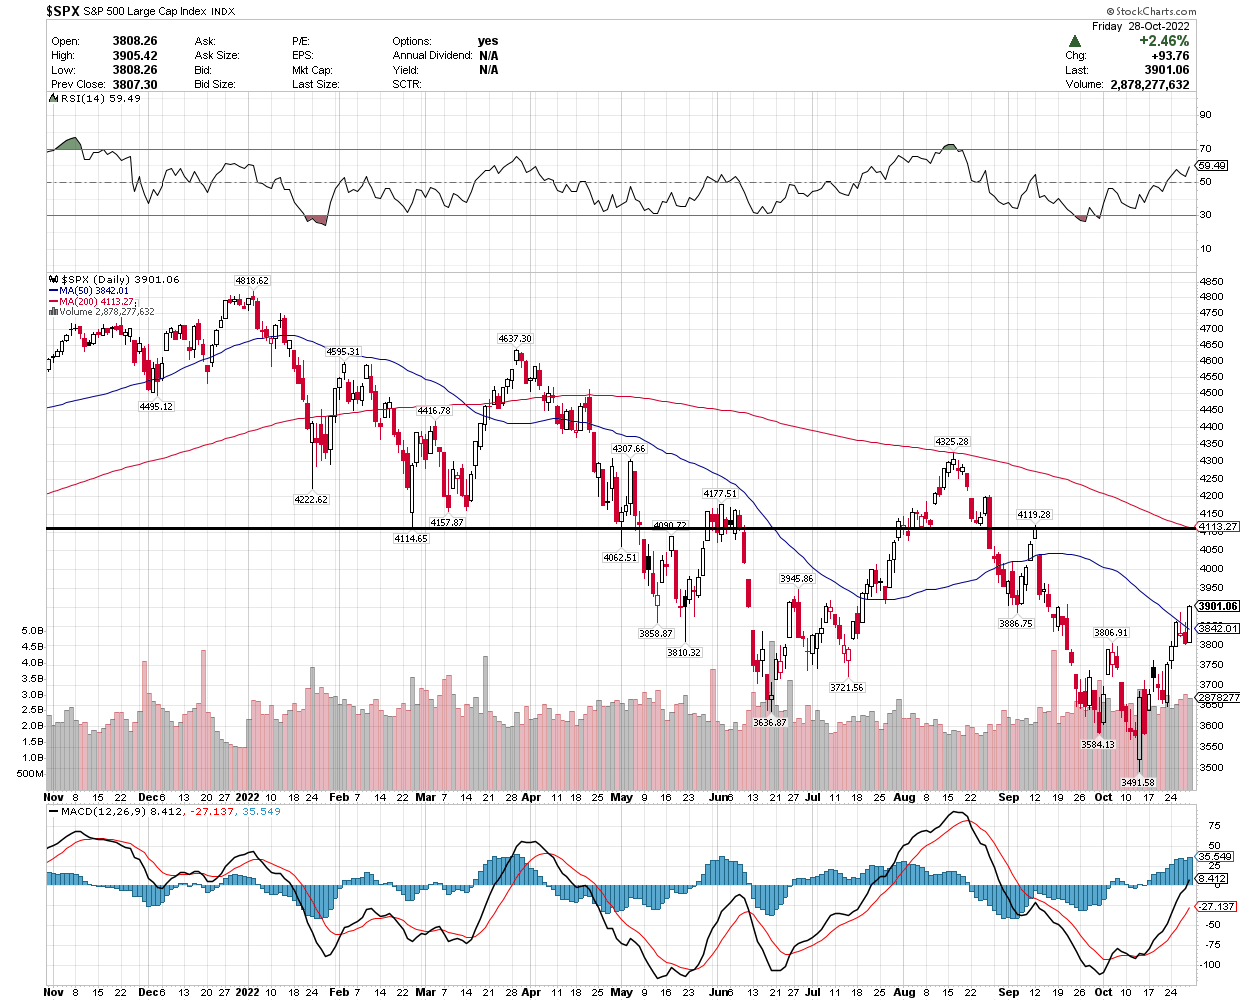
Stockcharts
Be the first to comment