

Hanging ON DNY59
“I’m a great believer in luck, and I find the harder I work the more I have of it.” – Thomas Jefferson
The Macro View
Since the August Jackson Hole Symposium, the Fed has cautioned that the tightening cycle was far from over and that “some pain” would be ahead for the economy. Plenty of investors, market analysts, and pundits seemed surprised. If that message hasn’t sunk in the latest Fed proceedings have made it crystal clear. The stock market has received the message and has reacted.
The message here has also been crystal clear, The Fed is in the picture for as long as it takes, and the thought of pivots and pauses were pipe dreams. This is a ‘higher for longer” backdrop as the Fed made it clear that the terminal rate (e.g., potential peak) forecasts for 2022 and 2023 moved from 3.4% and 3.8% to 4.4%and 4.6% respectively. These adjusted projections not only signaled that rates will move well into restrictive territory, but that the rate hike story will extend into 2023.
It is just now that the talk of a “mild” recession is being bandied about, but I’m well past that and believe the probabilities for a long-drawn-out recession are increasing daily.
Housing Market Headed For A Slowdown
In the aggregate, the tighter monetary policy typically acts on a lag. But for the more interest-rate-sensitive sectors of the economy such as the housing market, signs of a slowdown are already occurring. The days of bidding wars, all-cash offers, and purchases of homes sight unseen are fading as the 30-year fixed mortgage rate has soared above 6.5% for the first time since 2008. Housing affordability is stuck near all-time lows.
As interest rates climb, builder sentiment continues to decline. Building permits just experienced the largest decline since the pandemic, reaching the lowest levels since June 2020. From the Fed’s vantage point, some of this bad news is good news, as it shows that higher rates are cooling the once exceedingly hot housing market. Shelter costs, which have been a culprit of persistent inflation and traditionally lag home prices, should ease in the year ahead. But while this may all be welcomed news for the Fed, it is not a positive for GDP. Think about all the spending that accompanies the purchase of a home, or what is called the indirect effects generated by the housing market: realtor costs, repairs, enhancements, furniture, electronics, etc. While I do not foresee a housing correction the likes of the Great Recession due to the higher quality of outstanding mortgages, the contraction in housing activity will likely weigh on the economy.
A Drag From A Stronger Dollar
For Europe and the UK, this has exacerbated elevated energy costs as key commodities such as oil are priced in dollars. For Japan, its central bank was forced to intervene in the foreign exchange markets to prop up the yen for the first time since the Asian Financial Crisis. But while a stronger dollar complicates economic circumstances for these developed nations, it is not without consequences in the US. Yes, the strength of the dollar greatly reduces the cost of imports, which in turn helps abate inflation.
US Dollar (www.tradingeconomics.com/united-states/currency)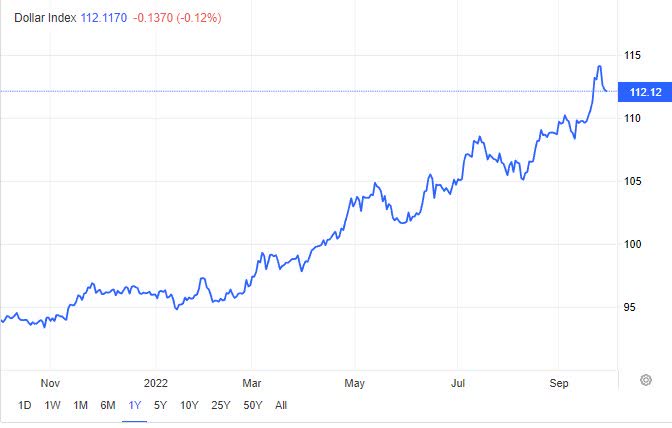
However, it hampers our export activity as our goods become more expensive overseas. It also poses a challenge to multinational corporations, especially those that derive a substantial portion of their revenues overseas. Already, many large tech firms have indicated that earnings would take a greater than previously expected hit due to exchange rates. Since the US economy remains stronger on a relative basis, the strength of the dollar should remain intact in the months ahead.
Suppressed Sentiment May Curtail Spending
No one seems to be talking much about consumer sentiment. Perhaps it’s viewed as a taboo subject with the mid-term election coming up. Consumer confidence and the slow destruction of the wealth effect will continue to weigh on consumers’ spending habits. The elevated risk of a recession will likely keep confidence depressed in the months ahead.
This is an inopportune time for sentiment to be challenged, as the critical holiday shopping season is just around the corner. There are already indications that the holiday season won’t be as impressive as years past, with sales volumes, not the dollar amount, expected to decline on a year-over-year basis and seasonal hiring weaker than the prior year.
Higher Heating Bills Hurt The Consumer
While some were trumpeting the fact that gasoline had dropped from record highs to under $4 a gallon, I warned that it wasn’t time to celebrate. Other energy costs were about to start to take their toll on households and industries. While the energy crisis is more acute in energy-dependent Europe, elevated electricity bills are also problematic in the US. Approximately 20 million Americans are currently behind on their energy bills, and as of June, the outstanding balance was ~$16 billion in aggregate.
That is before the worst of the heat (July and August) and the colder temperatures that will be here before we know it. While commodities fall outside of the Fed’s control, the inflationary impact does not and may force the Fed to continue tightening in an environment where consumers are already strapped.
Bottom Line– The Makings For A Recession
The last two recessions—the Great Financial Crisis and COVID-19—were severe, but caused by “Black Swan” events. However, this recessionary period has been “engineered” by poor policy decisions. There is no housing or dot.com bubble but we have the FED fighting inflation in an anti-business climate that is void of growth incentives and has already posted back-to-back negative GDP quarters this year that many don’t seem to remember or wish to recognize. The Leading economic indicators have dropped for five consecutive months indicating the economy isn’t improving after that first half of negative growth.
What I’ve presented above isn’t a confidence-building fundamental picture but it is the reality of the situation. In assessing risk/reward for the long-term investor, I believe a case can be made for the S&P 500 to drop much lower. (not saying this has to happen), which would be on par with the -33% average decline experienced in recessionary bear markets historically.
Recessionary bear markets also bottom 13 months from their peak on average, which would line up as early 2023. The index has already declined 24% over ~9 months, so the majority of this bear market’s weakness could be behind us but it won’t ease the pain if there are more declines ahead.
The depth and/or length of economic weakness and earnings decline will determine the depth and length of market struggles. Remember the 33% bear market statistic is an average. There are some facts in favor of the present-day market to avoid a replay of the Great Financial Crisis and the Dot.com meltdown. However, it’s much too early to dwell on these facts now.
The timing and degree of improvement in the economy remain unknown, and Investors need more clarity. Until then the equity market will struggle.
The Good News? – Maybe?
The second year of a presidency historically is the weakest of the four and this year fits that pattern, with the S&P down 24% year-to-date. The good news is that, since 1942, stocks have risen an average of 31% a year out from the midterm-year bottom and have not declined in the 12 months following midterm elections. However, there are always caveats to these historical patterns. Strategas Research shares the news that high-inflation midterm years in ’74 and ’78 cut rallies short. This market environment certainly falls into that same category.
While the gains may sound good, IF the S&P were to dip to the 3000- 3200 level a 30% rally would still leave it in a bear market configuration. Therefore, I’m not hanging my hat on the stats that tell us how rosy the situation will be after a severe bear market.
Investors have to survive the bear market first.
It’s a Global Bear Market
In the matrix below, we see the performance of ETFs that track the stock markets around the world. Globally, stocks have gotten crushed in the past year with an average decline of 30% from 52-week highs; we also see that developed markets have fared slightly worse than emerging markets. In fact, in the past few days, nearly every one of these countries has made a new 52-week low.
Global Markets (www.bespokepremium.com)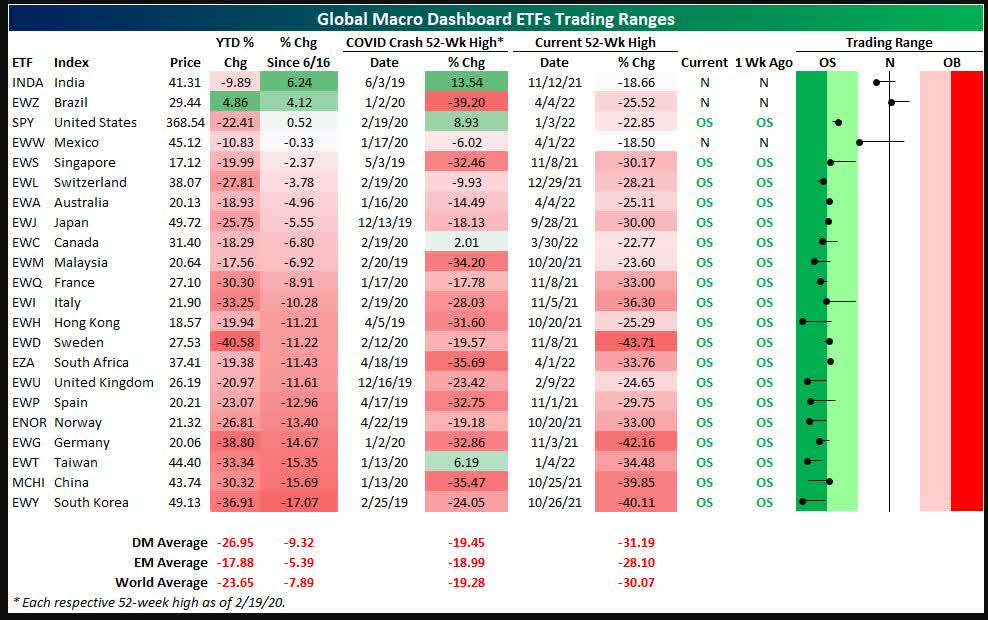
The Week On Wall Street
It’s a new quarter, and investors used the clean slate to set a more positive backdrop for equities. On Monday, oil prices moved up around 5% on the news of a potential million barrel per day production cut by OPEC+. Treasury yields were lower during the first trading day of the week as the 10-year yield dipped below 3.70%. It was risk-on as all of the indices and all eleven sectors posted gains.
The bulls weren’t finished as the gains on Tuesday in all of the indices made it the best two-day rally for the S&P 500 (+5.7%) since 2020. From there it was a nervous nellie type of market as the masses were poised to see what the next “jobs” report would reveal. We are in one of those times again where good economic news is bad and bad economic news is good. The computer algorithms are set to react that way under the notion that poor econ data means the Fed will pull back, and good econ data means the Fed will tighten the screws even more.
Friday rolled around and the bears wrestled control back with all of the indices losing 2+%. The weekly scorecard showed 2 up days and 3 down days for the S&P 500 resulting in a gain of 1.5% for the week. All of the other indices followed the same path and all posted gains for the week.
The Economy
A mixed bag in the Manufacturing sector.
US Manufacturing Purchasing Managers’ Index posted 52.0 in September, up from 51.5 in August and broadly in line with the earlier release ‘flash’ estimate of 51.8. The headline index was above the 50.0 neutral mark, as has been the case for the last 27 months, but continued to signal muted improvements in the health of the manufacturing sector.
The ISM Manufacturing index dropped 1.9 points to 50.9 in September, weaker than expected, after holding at 52.8 in July and August. This is the lowest since June 2020. But the index has remained above the 50 mark since June 2020. The components were mixed.
Construction spending dropped 0.7% in August, weaker than forecast, after falling -by 0.6% in July. The index posted gains from October 2021 through June of this year.
The same mixed picture in the Services sector
S&P Global US Services PMI Business Activity Index registered 49.3 in September, up from 43.7 in August. While improved, this was the 3rd month in a row that the index, was in contraction (sub 50) territory.
While the U.S. ISM-NMI Services index showed resiliency. The September report showed a modest drop to 56.7 from a 4-month high of 56.9 in August.
Employment Scene
JOLTS job openings fell 1.1 million to 10.05 million in August after July’s 130k bounce to 11.17 million. This is the first time under 11 M since November and the lowest since June 2021. This is the first sign that the employment backdrop is reverting to the mean. A positive for the FED watchers. They can make their case that we will see a slowing in the pace of rate increases.
Friday’s Jobs report slightly beat estimates with a 263k September payroll rise after 11k in upward revisions. Hourly earnings rose by 0.3%, leaving the y/y rise slipping to 5.0% from a third consecutive 5.2% y/y increase. The jobless rate rounded to a 3.5% figure that matched the cycle-low from July.
The Global Scene
MARKIT MANUFACTURING PMI RESULTS
A Different Story is being told for Manufacturing in the EU versus the APAC region.
UK Purchasing Managers’ Index – 48.4 in September, up from 47.3 in August.
Eurozone PMI at 48.4 (Aug: 49.6). 27-month low.
Eurozone Output Index at 46.3 (Aug: 46.5). 2-month low.
Canada Purchasing Managers’ Index at 49.8 in September, up from 48.7 in August.
India Purchasing Managers’ Index was in expansion territory for the fifteenth month in a row posting 55.1 in September. The headline figure slipped from 56.2 in August, though pointed to a solid rate of growth.
Jibun Bank Japan Purchasing Managers’ Index fell to 50.8 in September, from 51.5 in August.
The headline PMI for the ASEAN region rose from 52.3 in August to 53.5 in September.
Markit Services PMI reports from around the world were released this week as well. The results were broadly weaker than expected with most countries (especially those in Europe) reporting sequential declines. German services activity is especially weak amidst a dour energy outlook.
Eurozone Composite Output Index at 48.1 (Aug: 48.9). 20-month low.
Eurozone Services Business Activity Index at 48.8 (Aug: 49.8). 19-month low. This is the third successive month under 50.
EU Services PMI (www.pmi.spglobal.com/Public/Release/PressReleases)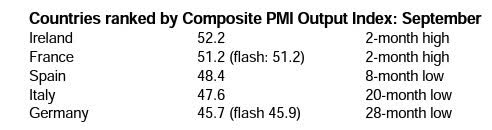
Japan
The au Jibun Bank Japan Services Business Activity Index was 52.2 in September, up from 49.5 in August. The quickest expansion in service sector output since June.
Earnings
The slowing economic backdrop and high inflation continue to weigh on corporate margins and earnings growth. S&P 500 earnings estimates for the Q3 and Q4 of this year, along with all four quarters of 2023, are getting revised lower again. Q3 earnings estimates now reflect negative q/q growth (-1.3%).
We can expect this trend to continue over the next year, as Fed tightening acts with a lag on the economy. Consensus estimates are pulling closer to the $220 earnings estimate for 2022, and I believe that might be too high. Primarily due to my views on a recession that some continue to say won’t start until 2023. In my opinion analyst estimates could move materially lower next year given my outlook that the recession is already here. Therefore, I am using $215 as a preliminary 2023 earnings number, and I’m ready to move that lower.
Food For Thought
It was reported recently that the UK was going to enhance the new Prime Minister’s growth plans by announcing another growth incentive. They proposed to abolish the HIGH tax rates on high earners.
Now a quick U-Turn of sorts as the Prime Minister and associates were attacked and are backtracking on that announcement. If the UK decides to scrap the other growth initiatives they recently proposed, they have insured their recession will be prolonged and much deeper than anyone wants to admit.
In my view, it’s imperative that Prime Minister Truss holds her ground. Her administration needs to push back hard on the ill-advised mindset that has the economy she inherited on the brink of recession. Whatever we wish to call this prevailing slow/no growth mindset (socialism or otherwise), it remains a driving force that has put the entire global economy in jeopardy. The longer it prevails the longer economies will languish at low growth levels.
Energy and the Global Economy
The transition to Green Energy remains a focal point for the economy and the markets. It’s been my stance that this will take time to play out and that is confirmed by recent facts regarding the transition. Last year Fossil fuels represented 81% of our energy needs. Ten years ago, that was 82%. In that ten-year period, the investment in renewables was 3.8 Trillion here in the US.
For sure there will be technological advances that will increase the “green” share, but with a 3+trillion dollar investment moving the needle 1% in 10 years I continue to maintain that fossil fuels will continue to be the dominant source of society’s energy needs for quite some time.
The recent announcement that OPEC+ will cut production drew criticism from the administration. Instead of looking for ways to become energy independent again, the response was;
“Consult with Congress on additional tools and authorities to reduce OPEC’s control over energy prices, more SPR releases, and suing OPEC.”
Another example of how the “green” mindset has taken over, and how it has created a dangerous playing field for the economy. So today it’s pro wind, go solar, go battery, and forget Fossil fuels here in the US. At one point the US realized that being dependent and “working” with the Saudis was always a “one-way” street. The US took the ball and ran with it, and US energy independence followed. That ball was nicely gift-wrapped and handed to the Saudis and they are running with it now.
Today we are back acting like children talking about suing for market manipulation in a market that the US recently controlled. All for the sake of rushing to go green. Everyone should now realize why I haven’t changed my stance on investing in the energy space since February 2021.
Ironically, the administration will get their demand destruction and lower energy prices by staying with the green agenda and ushering in a global recession. That is the potential threat to the strong trend in Energy that I will be on the lookout for.
The Saudi’s actions indicate they are worried. They are concerned about what many here in the US are in complete denial of. Recession, a long and deep global recession. The facts are the US is in recession or about to enter one, the Eurozone is facing a long recessionary period and China is tamping down growth by locking down cities when 2 people test positive for Covid.
A reversal of Covid policy in China and the now resilient Asia pacific region can prevent a very long and deep global recession. However, I wouldn’t be surprised if the US and the EU struggles get so bad they drag them into a slow/no growth backdrop as well.
Social Media
Elon Musk is now officially buying Twitter (TWTR). Despite what anyone thinks of the platform, it’s apparent Mr. Musk will be bringing Free Speech back to social media circles. In a country that prides itself on allowing Free Speech that would seem to be a refreshing change.
The Daily chart of the S&P 500 (NYSEARCA:SPY)
A strong rally that sputtered right at resistance levels. I’ll add that retreat at resistance is no coincidence.
S&P 500 Oct 7th (www.FreeStockCharts.com)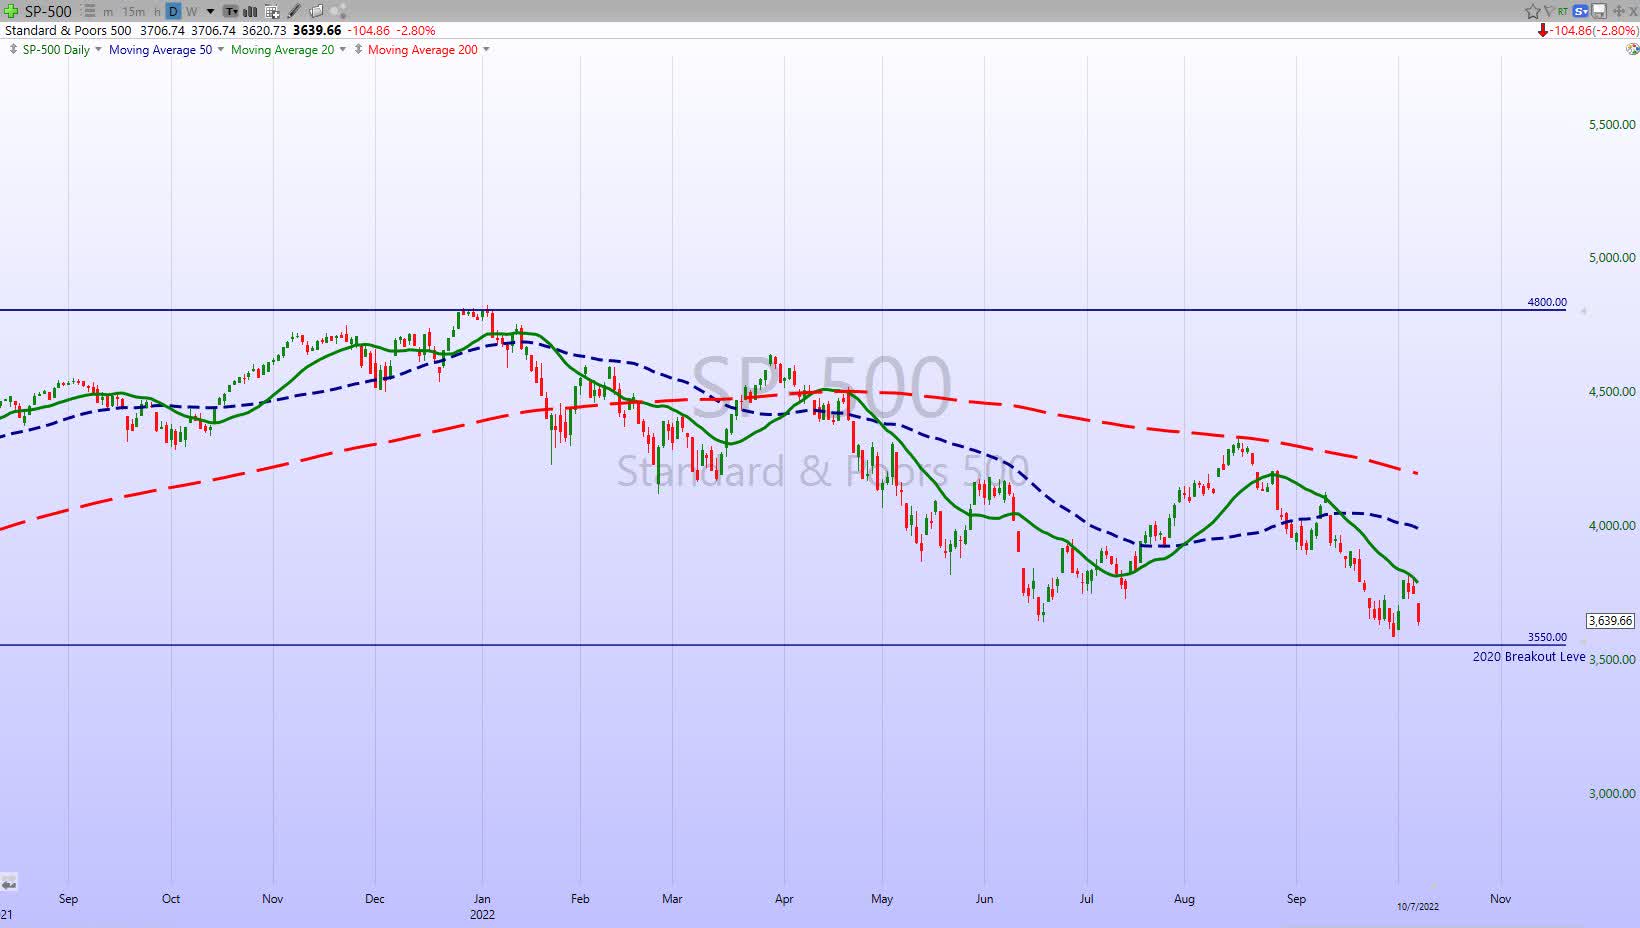
We have witnessed this same action time after time at different levels during this bear market. That action is quite typical. The 3550 breakout level looks to be the chance for a “save” before the index takes another leg lower.
In a recent alert to members of my service this week, I added two important demarcation lines that will provide evidence for the next move for the S&P 500. As the opening quote states, if an investor is going to make His/Her own luck it requires work. I provide daily updates to members of my service seven days a week.
Investment Backdrop
There was no place to hide in September. For that matter other than Energy stocks there has been no place to hide all year. Investors witnessed the worst month for the equity market since 2008. The equity and fixed-income markets simultaneously notched three consecutive negative quarters for the first time in over four decades. It’s bad enough that equities are down over 20% this year, but the seemingly consistent death-by-a-thousand-cuts pace of declines makes it even harder to navigate.
For the S&P 500, 56+% of all trading days have been down this year, and 26% of all trading days have seen declines of at least 1%. With regards to negative days, the current pace would rank as the fifth most down days in a given year on record, trailing only 1931, 1932, 1941, and 1974. In terms of 1% daily declines, there have been several more years with a higher frequency, but the current pace still ranks as the ninth most on record. Unfortunately, we are navigating these historical markets.
While the Nasdaq is typically considered more volatile, the frequency of negative days this year has been slightly lower at 54%, but that is still enough to rank 2022 as the third most ever trailing only 1974 and 1984. In terms of 1% declines, the only years that had a higher percentage were the three years of the dotcom bust from 2000 to 2002.
The charts tell us the path of least resistance is lower. We also know that nothing goes in one direction (up or down) forever. On September 29th and 30th, the S&P lost 134 points or 3.4%, and investors believed the investment world was about to crumble with more lows ahead. In the following two trading days, the S&P added 205 points or 5.7% (the best two-day rally since 2020), and the same investors believed stocks might rally to new all-time highs. Of course, neither is true and the real truth lies somewhere in the middle.
With that being the case market participants have witnessed oversold rebound rallies, some of which were powerful enough to coerce the “novices” to believe the selling was over. A bottoming process takes time and with the S&P making new low after new low recently, it would be foolish to start declaring the bottom is near.
Thank you for reading this analysis. If you enjoyed this article so far, this next section provides a quick taste of what members of my marketplace service receive in daily updates. If you find these weekly articles useful, you may want to join a community of SAVVY Investors that have discovered “how the market works”.
The 2022 Playbook is now “Lean and Mean”
If a stock isn’t in the Energy sector (XLE), then it is in a bear market trend. The “Utilities” (XLU) have completely broken down and have now entered a bear trend. That leaves investors looking for near-term “long” opportunities with a very limited playing field.
Savvy investors have expanded the playing field. In a bear market backdrop, market participants have to also acknowledge and position themselves to reap the rewards of the primary trend. I’ve benefited from the use of the Index and select sector Inverse ETFs during the recent declines.
Small Caps
The Russell small caps index (IWM) was the first to complete the journey back to pre-covid levels. During the big selloff where all the indices set new lows, interestingly, IWM did NOT set a new low. That is a divergence worth noting, but I’ll remind the bulls that the index is barely holding on to support just above the old lows.
Sectors
The market leaders continue to perform, and they are few and far between.
Energy
In Europe, extreme natural gas prices have bolstered oil demand by incentivizing large users to switch from gas to oil where possible. That doesn’t necessarily mean that oil prices will return to their peak; demand can still be suppressed enough due to recessionary conditions outside the oil market going forward, especially in China.
The counter to recessionary pressures is the OPEC+ announcement to cut production and what will be the end of the SPR releases. Clearly, there has been a shift in tone that shifted the price of WTI from holding support in the upper 70s to a close today at $86. Brent crude has tacked on $10 per barrel to trade back to over $91.
Here is another example of why it’s better to be energy independent than to rely on others to control the narrative. The EU has seen the ill effects of poor energy policy, and its economic situation is about to get worse. The “green” agenda will continue to pile up the damage as long as the current mindset on fossil fuels remains in place.
From an investment perspective, Energy (XLE) remains the only sector in a bull trend, and if anyone is contemplating adding money to the market that should be their first choice.
Natural Gas
Natural Gas (UNG) has held the 200-day MA since early in the year and appears to have weathered another selling event. The ETF tested that key support area and finished the week with a slight loss.
Financials
Since the Financial sector (XLF) is following the trend of the indices, I have a difficult time dabbling in the group. Reviewing the daily chart pattern shows there is plenty of room for more downside if the ETF is destined to revisit the pre-covid levels. A high probability.
Commodities
Select Lithium stocks that I own or follow remain in a bull trend, but I’ve noticed some weakness setting in. This group will be one to watch. With the midterm elections looming there could be a change in mindset on the horizon that could neuter the New Green Deal mindset. These stocks might be sniffing out a change in the fundamentals.
Healthcare
Healthcare (XLV) has carved out a trading range, as the group struggles to remain in a bull trend. I still like selective areas of the sector, especially those that offer a yield. The group has always been considered one of the areas of the market that can handle a slow/no-growth economy better than most.
Biotech
Despite the market turbulence, the bear to bull reversal pattern in the Biotech ETF (XBI) remains in place. The ETF didn’t follow other areas of the market when they set new lows recently. The pattern of higher lows since the May/June period is a bright spot in this area of the market. However, it is difficult to recommend getting long unless an investor has a longer-term mindset.
Technology
Semiconductors Sub-Sector
The relative strength of semiconductors has been a leading indicator of the broader market for the last several years, and at this point, they aren’t showing much in the way of signals for a turnaround or considerable weakness ahead.
Just like the S&P 500, the Philadelphia Semiconductor Index (SOXX) took out its June lows recently, but on a relative strength basis it got close, but the June lows haven’t quite been taken out yet. The SOXX saw its drawdown from the record high in December reach ~ 42%.
The current drawdown in the SOXX is now deeper than the 35% drawdown from the COVID crash and ranks as the fourth largest decline from a record closing high in the index’s history. The only three that were deeper were two 50%+ declines in the mid to late 1990s, and then the 80%+ drawdown from the dot-com peak.
For those investors that have a longer-term time horizon that wishes to buy and hang on, then there are some opportunities. In my book, for everyone else, this group is a no-touch, unless you are interested in a quick trade.
ARK Innovation ETF (ARKK)
An interesting development. While the very speculative Ark Innovation ETF (ARKK) suffered damage to its reversal pattern during the selling event, it has yet to establish a lower low. However, it’s getting close.
This ETF is tracing out a basing pattern that started in May. As long as the ETF does not set another low, that basing pattern is still operable. At some point, we will need to see all of the indices trace out a similar setup. First, they have to stop making lower lows.
Cryptocurrency
While equities fell to new lows recently, crypto prices were mixed. Some of the largest like Bitcoin, and Ethereum, have moved higher, and then pulled back later in the past week.
Bitcoin (www.bespokepremium.com)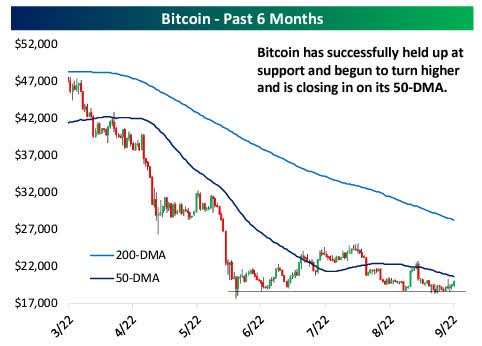
Final Thoughts
I continue to watch market participants possessing the “buy the dip” mentality, a mindset that I said had to be discarded in 2022. The downside has been more extreme than most expected this year and fear has certainly picked up, but it hasn’t felt to me like panic or capitulation on this latest down move. Instead, the crowd appears to expect a bottom to form soon and is just waiting for the all-clear to again return to their risk-taking ways. That is a dangerous mindset. It’s based on hope. That is not a strategy to be relying on in a bear market scene. When the tide does eventually turn we can change back to that “buy the dip” strategy but for today, there is no reason to step up and be a hero.
I changed my strategy in February of this year. I was well ahead of the crowd by saying that investors need to treat this market environment differently for a host of reasons that are now in plain sight.
An investor shouldn’t dismiss the truth and the facts of the situation and I’ve seen investors do that all year. Perhaps they have loaded up on the Kool-Aid being passed around at the “all is well” parties and can’t see the oncoming train. Anyone continuing on that path is in for a very rude awakening.
Postscript
Please allow me to take a moment and remind all of the readers of an important issue. I provide investment advice to clients and members of my marketplace service. Each week I strive to provide an investment backdrop that helps investors make their own decisions. In these types of forums, readers bring a host of situations and variables to the table when visiting these articles. Therefore, it is impossible to pinpoint what may be right for each situation.
In different circumstances, I can determine each client’s personal situation/requirements and discuss issues with them when needed. That is impossible for readers of these articles. Therefore, I will attempt to help form an opinion without crossing the line into specific advice. Please keep that in mind when forming your investment strategy.
Thanks to all of the readers that contribute to this forum to make these articles a better experience for everyone.
Best of Luck to Everyone!
Be the first to comment