

Sezeryadigar/iStock via Getty Images
Today I would like to take a close look at the Invesco S&P 500 Equal Weight Health Care ETF (NYSEARCA:RYH) to assess whether its factor mix looks promising for the current environment dominated by inflation, slower growth, and higher interest rates narratives. Special attention will be paid to valuation and profitability parameters, which are of principal importance during periods of elevated uncertainty.
Investment strategy
In a nutshell, RYH is an around $844 million passively managed smart-beta fund offering exposure to a portfolio of U.S. healthcare stocks. The equal weight schema is supposed to avoid becoming overreliant on a just handful of names and thus reduce downside risks and volatility somewhat. Unfortunately, this is not necessarily the case in practice, as the performance analysis will illustrate.
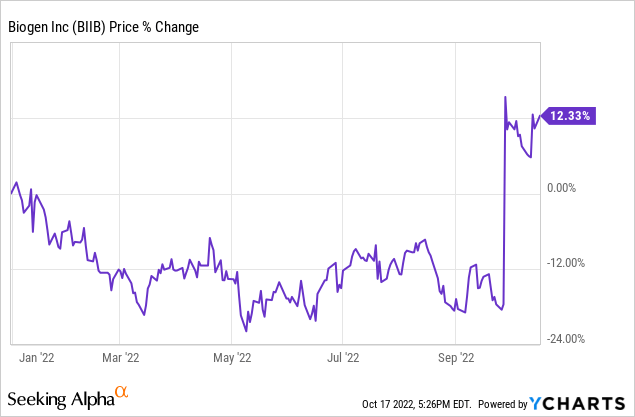
RYH’s investment mandate is to track the S&P 500 Equal Weight Health Care Index, which is rebalanced quarterly. The result of this strategy is a portfolio of 64 stocks, with the major ten accounting for slightly less than 18% and Biogen (BIIB) being the primary investment (~2.1%). As a brief digression, BIIB’s major position in the RYH portfolio is mostly the consequence of its late-September rally spurred by the encouraging phase 3 data for its Alzheimer’s disease candidate lecanemab.
As of my calculations, the weighted-average market capitalization stands at ~$77.7 billion vs. ~$200.3 billion in the case of the Health Care Select Sector SPDR Fund (XLV), RYH’s closest peer leveraging modified market cap-driven methodology.
Delving deeper, just ~23% of RYH’s net assets are allocated to companies with market values above $100 billion. In the case of XLV, that figure is close to 66%. So investors who prefer large-cap-heavy portfolios with moderate exposure to the mega-cap echelon and all issues inherent to it (e.g., slower growth compared to smaller counterparts), while not compromising on profitability like in the case of portfolios tilted towards mid-caps, would likely find this ETF alluring.
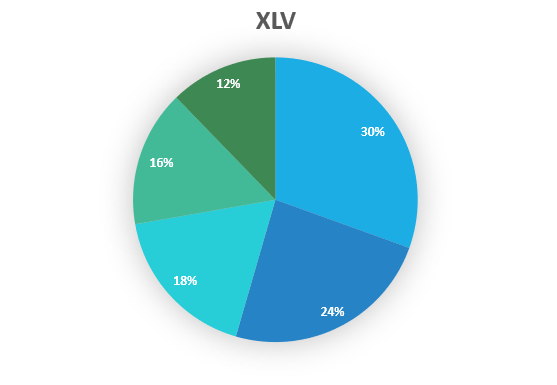
As the charts below illustrate, unlike XLV, the ETF is tilted towards the healthcare equipment & supplies industry, with ~28.4% allocated, followed by healthcare providers & services. More specifically, owing to XLV’s market-cap weighting, just nine pharmaceuticals companies including heavyweights like Johnson & Johnson (JNJ), Eli Lilly and Company (LLY), and Pfizer (PFE) sport a combined weight of 30% vs. only 14% in RYH.
Created by the author using data from RYH Created by the author using data from XLV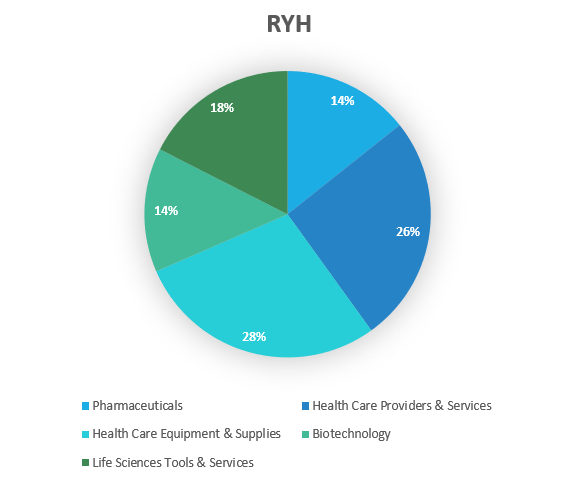
Dissecting factor exposure: Most holdings are valued terribly
I am of the opinion that one of the best equity strategies to weather the raging storm is to combine value with quality. A proper allocation to the former is required to ensure a portfolio is not too sensitive to the interest rate issues with most of the holdings being self-sufficient and not dependent on debt financing, while the latter mitigates the risk of the increasing cost of capital triggering the compression of multiples. Does RYH have an adequate balance?
Let us begin with quality. First, none of the ETF’s holdings have a B Quant Profitability rating, let alone C or worse. Meanwhile, stocks sporting an A+ grade account for ~57%, which is a phenomenally strong result.
Delving deeper, none of the holdings is EBITDA-negative, with margins ranging from McKesson’s (MCK) 1.3% to Moderna’s (MRNA) 69.3%, and the median standing at 27.8%, a solid achievement. Besides, all the companies in the portfolio are cash flow-positive, a fact of paramount importance for the higher interest rates era, and only one was incapable of covering capex with net operating cash flows in the last twelve months.
Catalent (CTLT) generated just $439 million in the net OCF while capital investments consumed $660 million. It does have a greater impact on RYH’s performance than on XLV’s returns owing to over 2% weight vs. just 0.28%, yet I would not say that it poses a major threat as FCF is its only weakness while other metrics from gross profit to return on total capital are fairly robust; moreover, analysts are anticipating an around 35% increase in the Forward net OCF which hints FCF should turn positive.
Yet when it comes to valuation, we are not short of reasons to remain skeptical. First, the sector is itself barely cheap and investors in pure healthcare plays should be cognizant of the fact they likely own an equity mix that comes with a premium to the S&P 500. To corroborate, the median TTM P/E for the sector is 23.7x, while IVV’s P/E is 17.87x. Second, even despite the equal-weight methodology, RYH has just ~7.7% allocated to stocks with at least B- Valuation rating, while those with a D+ rating or worse account for almost 67%. This is only marginally better compared to XLV’s 6.9% and 70.4%. Another issue pointing to comparative overvaluation is the weighted-average EV/EBITDA multiple of ~16.7x, as of my estimates, while the sector median is just 14.4x.
Remarks on performance
The arrival of an era of capital scarcity manifested in central banks across the globe increasing interest rates hurriedly has taken its toll not only on the high-growth tech echelon. Despite an aura of defensiveness and smart-beta strategy, RYH has not been immune to the bear attack. Certainly, not all its holdings are down YTD, with 15 sporting gains ranging from ~1.6% in the case of Elevance Health (ELV) to MCK’s staggering 42%. Yet names that have a year to forget are also aplenty. For example, 22 are down by 30% or more, with Align Technology (ALGN) having the worst return of close to (70)%.
Created by the author using data from Seeking Alpha. Returns as of October 17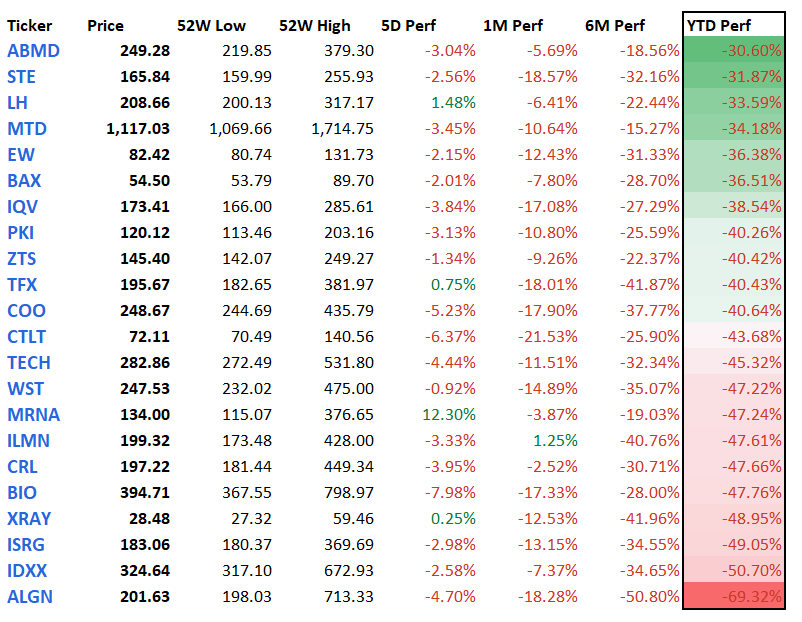
And oddly enough, even though it did outperform the tech-heavy iShares Core S&P 500 ETF (IVV), the ETF fared much worse than its peers that stick to conventional market-cap-driven strategies, namely XLV and iShares U.S. Healthcare ETF (IYH).
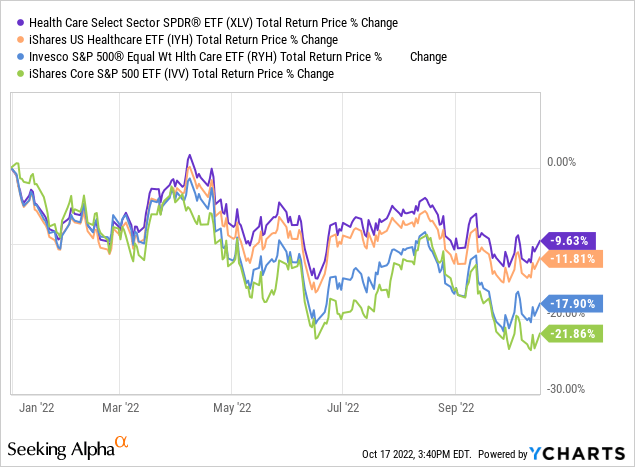
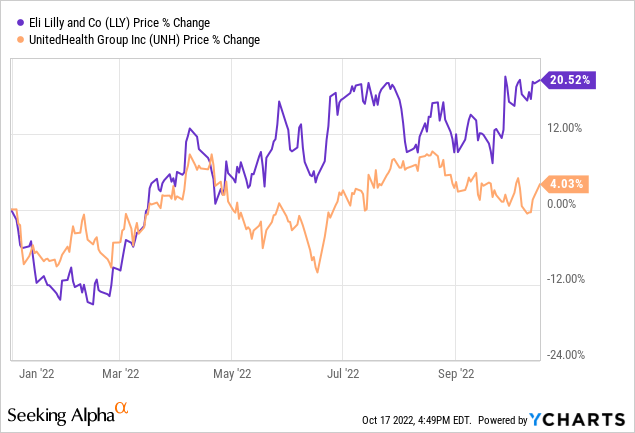
How could that happen? More likely, this was because UnitedHealth Group (UNH) and LLY, the two healthcare names that have defied bearish forces this year, have much smaller weight in RYH than in XLV, ~3.45% vs. close to 16%.
For a broader context, the table below contains a few select metrics for the period from October 2012 to September 2022.
Created by the author using data from Portfolio Visualizer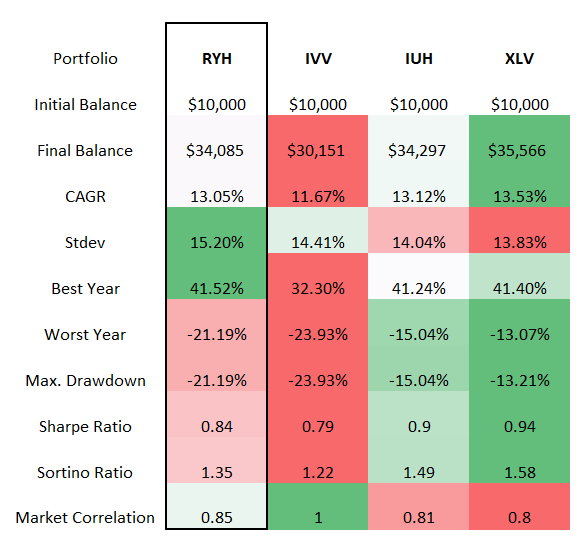
Though the data illustrate healthcare plays were superior to IVV, with smaller drawdowns and higher CAGRS, yet another issue comes to light: equal-weight methodology is not necessarily supportive of lower volatility (i.e., the standard deviation of RYH is the highest in the group) and better risk-adjusted returns (its Sharpe, Sortino ratios trail healthcare peers’ metrics).
Final thoughts
There is no denying that RYH is a high-quality fund with the potential to generate robust long-term returns thanks to secular trends bolstering the sector, the aging global population included.
Yet tactically, I remain skeptical of paying a premium for quality, even when it comes to healthcare that does possess defensive characteristics. I would opt for a more cautious view here, assigning a Hold rating to this ETF.
Besides, it should be noted that RYH’s fees of 40 bps are on the expensive side, especially considering XLV’s ER of 11 bps. Another downside is that the fund is barely apt for an income-centered portfolio owing to the healthcare sector’s traditionally rich valuation (at times exceeding IT levels) and thus mediocre yields.
Be the first to comment