

Duncan_Andison/iStock via Getty Images
“Your success in investing will depend in part on your character and guts and in part on your ability to realize, at the height of ebullience and the depth of despair alike, that this too, shall pass.” – Jack Bogle
The Macro View
I introduced a changing investment landscape earlier this year and it is worth reviewing as the year comes to a close. Investors have witnessed a shift in the winds and tides over the past year that necessitates a new approach to the markets. Critically, the forty-year bull market in bonds is likely over and there is a very good chance we have not only entered a new interest rate regime, but we will also remain in this new backdrop for a while.
There is an army of analysts and market participants who have only ever known a time when interest rates are depressed and falling, while bond prices are generally rising. If that is now over (HIGH probability), an investor has to make changes to their outlook and strategy. Deciding to use a strategy and build portfolios on the premise that bonds will continue to insulate them from declines in the stock market like they have over the past forty years is dangerous. The carnage we’ve seen this year in the traditional 60/40 or 50/50 stock/bond portfolio may not be the anomaly many believe it to be. We at least have to consider the possibility that it’s the new normal.
Until proven otherwise, I am also proceeding as if the broad stock market has made a significant top. No longer can anyone assume that new market highs are just around the corner like we did for the last 10 years. As I have told clients and members of my investment service over the last few months, I think many individual stocks have topped for good or at least for a long while. There is always the possibility that the major indices can string together enough of a rally to get investors excited again (low probability), but even if they can, I still believe we’re likely to see more difficult markets ahead. In my vow that isn’t a question of “if” that will occur. It’s a question of how long the difficult times stay with us.
The Poor Backdrop Remains
Part of the problem is that I don’t really foresee a way out of this from a market perspective without either a Fed capitulation and pivot back to cutting rates or some sort of new fiscal stimulus program. Neither option is likely without more pain in the economy happening first. In summary, we’ve had multiple years of outsized stock and bond gains, and the trend to normal and perhaps below-normal returns is on the horizon.
Leading Indicators
The Bespoke Economic Indicator Diffusion Index measures the net number of better-than-expected reports over a rolling 50-trading day basis. For the first half of 2022, there was a consistent trend of weaker-than-expected data. By the time the second half of the year started, though, consensus forecasts began to adequately account for the weakness.
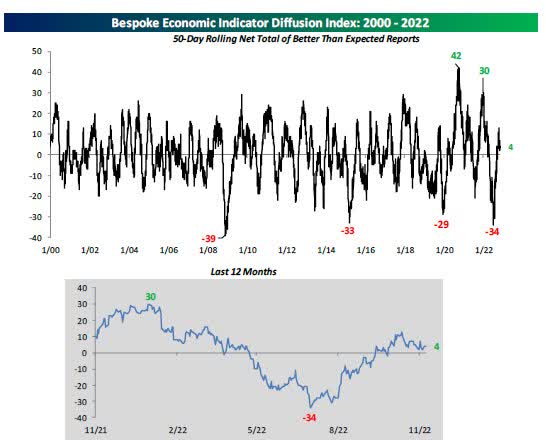
Economic Index (www.bespokepremium.com)
Inflation
Analysts have relied on many internal data points to form their opinions that inflation will moderate. Many spoke of “Peak Inflation” back in July and August which led to a rally in stocks. Recent data does now indicate that we have seen the “Peak”.
One report does not make a trend. October’s report was significantly lower than expected, but back in August, we had a similar situation where the headline and core CPI both came in 0 2 percentage points ( below forecasts and the S&P 500 rallied over 2% in response. That was then followed by two straight months where both the headline and core prints exceeded forecasts by at least 0.2 %. In other words, monthly reports tend to be volatile.
We’re almost certain to get more upside inflation surprises, but there are reasons to be optimistic that the trend is moving in the right direction. While slower than a few months ago, neither inflation measure is even remotely close to the desired 2.0% pace. The Fed has a long way to go. Obsessing, and worse yet, positioning for whether the Fed is going to increase the rate by 50 basis points or 75 basis points, and when they will lower that to 25 basis points is an exercise in futility.
Is it possible that the October outcome signals the beginning of a rapid decline in the inflation rate? Probably not. We saw a 0.3% increase in the core rate in July. It was then followed by disquieting gains of 0.6% in both August and September. We suspect a similar pattern of a slowdown in October followed by more normal-looking gains in November and December.
When PPI was reported, it was also good news. Stabilization leads me to believe we have finally seen the “Peak” inflation everyone was looking for months ago. Now that the “Peak” is here, we will need to see this trend take hold before any assumptions that inflation has been conquered, and the Fed is no longer in the picture.
The Struggles Will Continue
Without a Fed or fiscal stimulus to save the day, the economy is on its own to pull itself out of the approaching malaise. I just don’t have much confidence in that happening based on the softening of economic and fundamental evidence lately. If that should start to turn around, I’ll change my outlook. But with high energy costs keeping inflation above normal, it will continue to be a drag and the probabilities of a quick and complete turnaround are LOW. When I look around for growth initiatives, I continue to come up empty, and that adds to my concerns.
Then I start to look at the earnings picture. For example, while some have considered the third quarter earnings season to be a “win” since earnings growth for the S&P 500 is still a positive 2%, that number would drop to a 5.4% loss if we remove the gains from the Energy sector (source: FactSet Earnings Insight). In aggregate the corporate world is starting to show signs of stress as outside of Energy the rest of the market’s earnings are actually contracting. That tells me to be more specific in stock/ETF selection.
Current expectations for the fourth quarter are for an across-the-board decline in S&P 500 earnings even including Energy. In many ways the “real” economy is only now catching up to what the financial markets have known all year — that trouble likely lies ahead. We are starting to see high-profile layoffs in the Tech sector and that will likely spread to other parts of the economy as the contraction accelerates.
In summary, the “issues” remain. We have a very active Fed that has no alternatives, a government left impotent by the high inflation it created, an economy that is seeing its growth slow at best and already contracting at worst, and a stock market that may start to see further earnings erosion. That does not sound like a recipe for throwing caution to the wind.
Now, it is true that market bottoms occur amid such a poor economic and fundamental backdrop (markets bottom before the economy), but it is not true that they occur immediately. The stock market will go through a bottoming process. I continue to maintain that a “V” recovery in either the stock market or the economy is an extremely LOW probability.
Opportunities Still Exist
However, even if the equity market remains in this BEAR trend under the weight of all the problems, there will still be opportunities. Similar to what has been the case all year we will just have to look harder for them. There will be tradeable rallies to provide chances for profits, and the Inverse ETFs allow an investor to take advantage of market weakness. In general, MY “New Era” strategy isn’t going to change. The name of the game will be the ability to be tactical and play these periodic rallies but to take what the market is giving investors both on the upside and the downside.
I’m not buying into the post-mid-term election pattern that suggests double-digit returns for the S&P in the year ahead. My reasoning is simple, we haven’t seen a fundamental backdrop with this combination of issues before. We’re not just “fighting the Fed” now; the data says we are fighting arguably the most aggressive Fed in history. This is occurring at a time when stock valuations remain closer to expensive than cheap, and an economy that is weakening with corporate profitability eroding.
Yet, I also want to stress that part of being flexible and tactical is recognizing when that framework needs to be torn down and formed anew. I did that back in February when I believed we entered into a New Era when it came to an investment strategy.
So if the balance of evidence changes again, my goal is to change with it. For now, though, I think the best approach in terms of risk versus reward is to use the framework outlined above. It’s the only way I know of to still take advantage of any upside while protecting against downside moves that are likely to be more severe than what we grew used to in the easy-money days. I stated that in February and will repeat it today – those days are gone.
The Week On Wall Street
As the Holiday week started, the situation could well be described as a market in search of direction. Not only was the S&P 500 flat coming into this week, but the index also opened on Monday at the same level it was on April 2022. That also happens to be where it was on April 2021!
A slow uninspiring day on Monday changed into an across-the-board rally on Tuesday and Wednesday where all of the indices and sectors posted gains over the two days. The positive catalysts I’ve mentioned recently, namely the U S Dollar and the 10-year Treasury, both weakened setting the stage for more of a risk-on mindset.
The holiday-shortened session on Friday ended a week where all of the major indices posted modest gains.
The Economy
Manufacturing
US PMI Composite Output Index at 46.3 (October: 48.2). 3-month low.
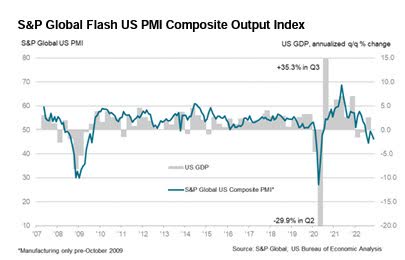
US PMI (www.pmi.spglobal.com)
Services Business Activity Index at 46.1 (October: 47.8). 3-month low.
Manufacturing Output Index at 47.2 (October: 50.7). 30-month low.
Manufacturing PMI(3) at 47.6 (October: 50.4). 30-month low.
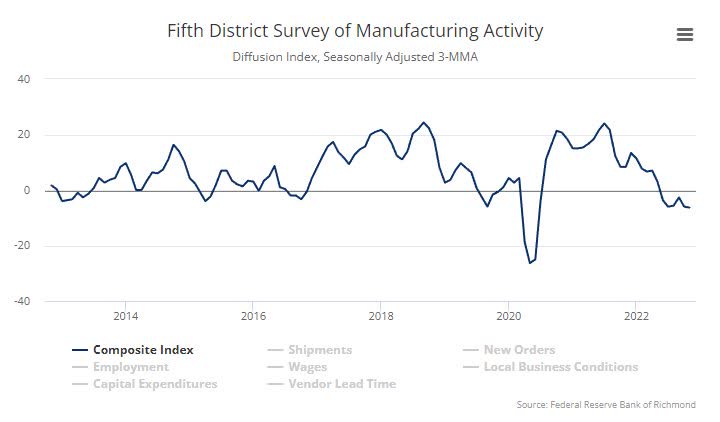
The Richmond Fed Manufacturing Index rose marginally to -9 in November following the 10-point drop to -10 in October, weaker than expected. That was the lowest since the -27 in May 2020. The index has been in negative territory in five of the eleven months this year, and positive in four.
Housing
New home sales sharply beat estimates with a 7.5% October bounce to a solid 632k pace, alongside a new all-time high for the median price and a new 13-year high for home inventories. The firm’s October new home sales pace is well below the 9-month high of 839k in December of 2021 thanks to surging mortgage rates and high prices that have disqualified many buyers.
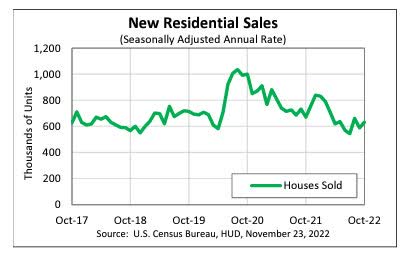
New Home Sales (www.census.gov)
Consumer Sentiment remains at lows
The final Michigan sentiment report revealed a headline drop to an upwardly-revised 4-month low of 56.8 from a 6-month high of 59.9 in October. Michigan sentiment is oscillating above the all-time low of 50.0 in June, but well below the early pandemic bottom of 71.8 in April of 2020.
Today’s Michigan sentiment drop joins a November IBD/TIPP index decline to 40.4 from 41.6, versus an 11-year low of 38.1 in August.
Employment
The latest readings on jobless claims are something to be concerned about. Both initial and continuing claims rose more than expected. For initial claims, last week’s level was revised up by 1K to 222K, and this week’s reading rose by 18K to 240 K. That is the highest level of claims since the week of August 18th, and the sequential increase was the largest since the end of September.
Readings on initial jobless claims have been healthy in the sense that they have remained within the range of low readings from the few years before the pandemic, this new high would have been at the high end of the 2008 to 2019 pre-pandemic range.
Continuing claims continue to be the more interesting story as the week of November 11th showed an increase for the sixth week in a row. Such a streak of consistent increases in continuing claims has been rare, especially in the years following the Global Financial Crisis.
Bespoke Investment group;
The rise during the onset of the pandemic in 2020—which lasted for 10 consecutive weeks—was the only other notably lengthy streak post-2009.”
I mentioned that the jobs scene will be the last to roll over. It appears this could be the start. If so, the recession will be cemented in place.
The Global Scene
Recession pressures ease in November, but PMIs remain in Contraction.
UK PMI Composite Output Index at 48.3 (Oct: 48.2). 2-month high.
Services PMI Business Activity Index at 48.8 (Oct: 48.8). Unchanged.
UK Manufacturing Output Index at 45.4 (Oct: 45.0). 4-month high.
UK Manufacturing PMI(4) at 46.2 (Oct: 46.2). Unchanged.
Eurozone PMI Composite Output Index at 47.8 (Oct: 47.3). 2-month high.
Eurozone Services PMI Activity Index(2) at 48.6 (Oct: 48.6). Rate of decline unchanged.
Eurozone Manufacturing Output Index at 45.7 (Oct: 43.8). 2-month high.
Flash Eurozone Manufacturing PMI(3) at 47.3 (Oct: 46.4). 2-month high.
The Yield Curve
The 10-year dipped again this week closing at 3.69% and giving the BULLS a little extra to be thankful for. The “2-10 spread” is inverted and that inversion is now the steepest U.S. yield curve inversion in decades. US 2-year yields are now 83 basis points above rates on 10-year notes.
In the meantime, the Fed’s preferred method to measure recession risk is the 3M/10Yr spread. This inversion is also steepening week after week, and with the 3-month at 4.40% it is now 69 points above the ten-year.
EVERY series on the scale is now inverted. From the 1-month and above, every rate is higher than the 10- year Treasury.
These are all considered recessionary signs that have a good track record of forecasting economic downturns. Some can argue that we aren’t in a recession today, but this data is overwhelmingly stating the US will be in a recession soon.
Finally, the spread between the yield on the 10-year Treasury and the 12-month Treasury is inverted by 104 basis points. We have only seen 100 basis points or more in the summer of ’73 and ’74 and again in late ’79/early ’80. Both were recessionary periods.
The Economy is Good?
The Administration says the economy as being in good shape. Despite pushback, President Biden extended the moratorium on making payments on student loan debt to June 2023. An attempt to soften the blow of higher prices due to inflation in a weak economy. Another example of two plus two doesn’t equal four.
According to recent court rulings canceling student loan debt is unconstitutional. Congress hold the country’s purse strings and they weren’t allowed to weigh in. This isn’t about an opinion on what is right or wrong with pardoning student loans. The Supreme court will eventually decide.
It is about economics. Inflation remains at high levels and allowing this money to slosh around the economy is more fuel for the inflation bonfire. Is the Economy GOOD or is it BAD? That depends on whether one is listening to the “spin” or looking at the data.
The data doesn’t lie.
The Daily chart of the S&P 500 (NYSEARCA:SPY)
The slow “melt-up” took the S&P 500 right to near-term resistance. A trend line that has capped the index since March.
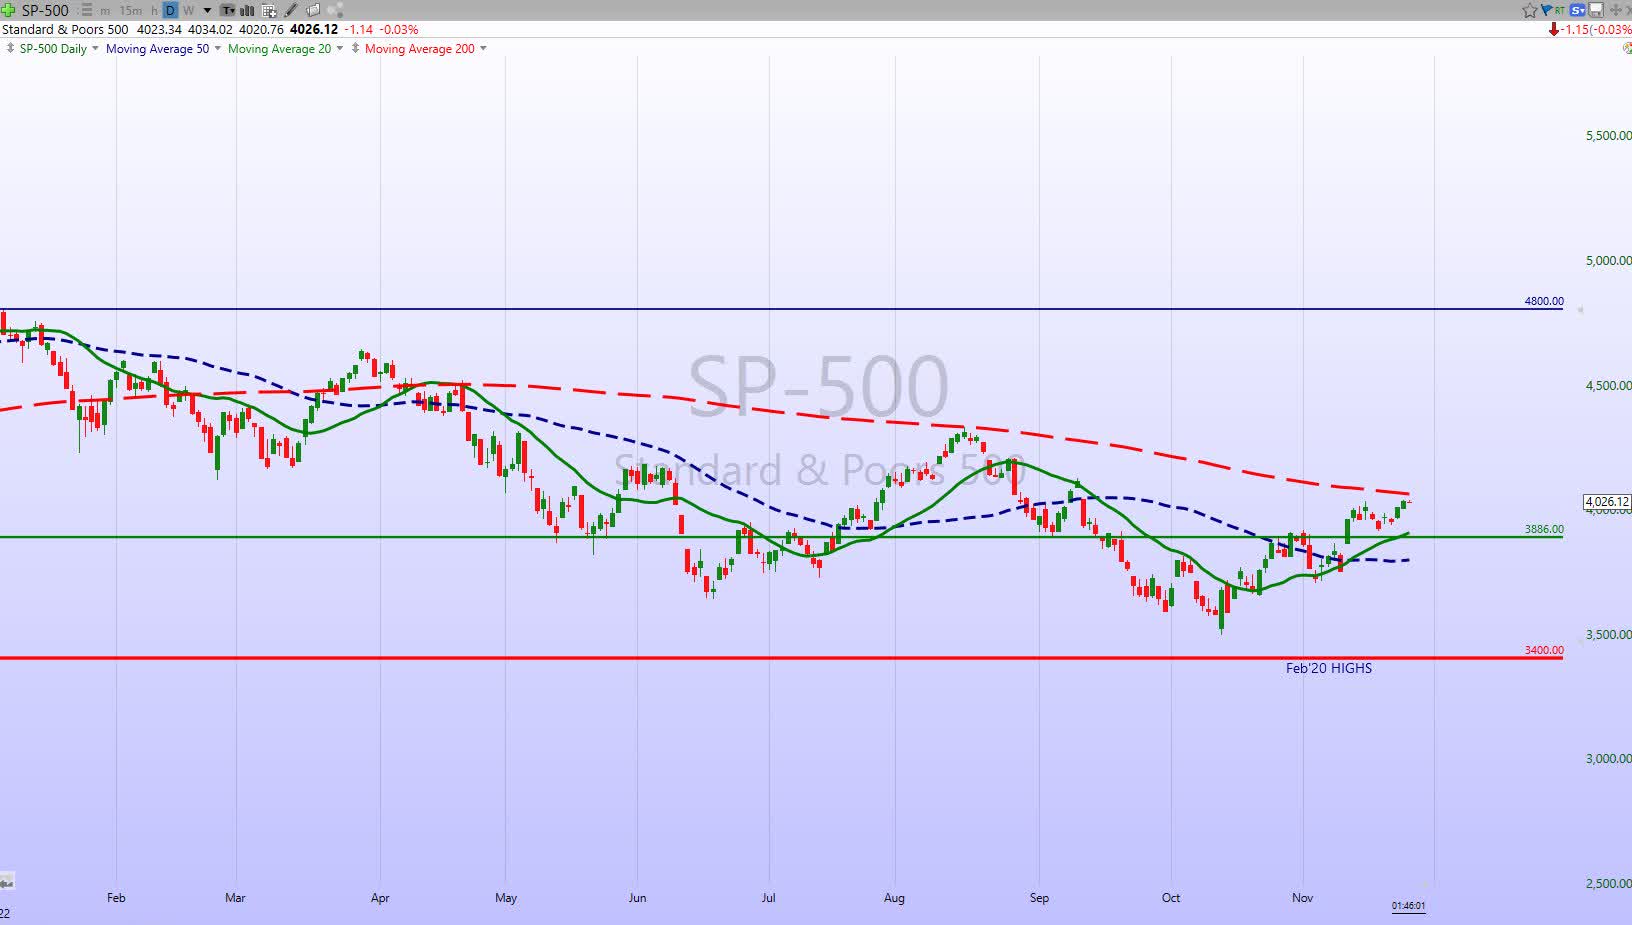
S&P 500 Nov 25th (www.FreeStockCharts.com)
The BULLS are positioning for the momentum to take the index up to the August highs around 4300. The BEARS are patiently waiting for their turn to potentially spring the trap and take the S&P back down to new lows.
Investment Backdrop
There has been some catalyst-driven strength lately, yet that strength has occurred within the context of a broader downtrend in the major indices. There have been improvements in supporting indicators such as the Advance/Decline lines and the New Highs vs New Lows list. That leads me to believe that the equity market is still in a “show me” situation. It has to prove that this hasn’t just been another bear market rally such as the one we saw from June to August.
The indices have drifted into overbought readings that leave them at the top of the short and intermediate-term trading ranges. They can still push higher, but now that they are getting extended it comes at a time when overhead resistance looms. Until we see what kind of pullback we ultimately get (depth/time) and how quickly buyers step back in, it’s tough to decide what to make of this recent bounce.
Nothing has changed in the bigger picture for me, but the BEARS have not yet managed to seize back control in the short term. With the lack of catalysts, (no Fed meeting, no CPI/PPI report, no earnings) the BULLS will need to see their two keys continue in their favor. Both the US Dollar and the 10-year Treasury will have to soften.
The main takeaway here, though, is that there is limited upside space before the S&P 500 is going to face plenty of resistance. It is certainly possible it can better it all, but there is a lot to think about before pushing more chips in. The situation is further complicated by the positive divergence seen in the DJIA relative to the other indices.
Sectors
Energy
We’ve discussed the technical issues that appear in the chart of the XLE for two weeks and why it wasn’t a great time to be aggressive. Resistance was looming and it does look like a double top has formed. The XLE rallied 34% since it tested support in September. A pause here is certainly not out of the norm. After posting its first losing week in the last 5, the Energy ETF (XLE) is showing resiliency by posting a slight gain for the week.
Energy stocks have had a nice rally (34%), while crude oil has stayed in a tighter range rallying 12 % in the same period. Therefore on a percentage basis, energy stocks offer a better opportunity to hedge now.
Then again sometimes we ALL tend to overthink the situation, XLE is due for a pullback, BUT the BULL trend is firmly in place. Many energy stocks are paying above-average dividends. That combo can’t be found elsewhere. “Hedging” in a BULL trend can often be detrimental if the timing isn’t accurate, and should be left to active investors that are more aggressive.
I’ve pounded home the energy trade this year and there have been times when I compared the Energy sector’s performance to their “Clean” Energy counterparts. This article, “Big Oil vs. Clean Energy ESG ETFs” does a masterful job of comparing the results. There remains a contingent of money managers that continue to avoid the Energy sector while plowing money into ESG investments. That plays to the narrative of the current administration.
I’m not really interested in what others are doing, but I manage portfolios to increase wealth. At some point in time, the choir boys and girls will either wake up to reality or fold under the pressure of clients.
Natural Gas
The Nat Gas ETF (UNG) ($23.50) was strong in May. Weaker in June, strong again in July and August, but weaker in September and October. If an investor can’t handle volatility they shouldn’t be investing in UNG.
Last week I thought it was “do or die” time for the ETF, as the long-term support was being tested. November started out as a base-building pattern and the BULLS seized the baton as the ETF bounced off support and posted a 10.3% gain in this short week.
If “past is prologue” this could be the start of another run to take the ETF back to the $35 range. UNG remains an “overweight” position but is not suitable for investors with a low tolerance for risk.
Financials
While the major indices have not surpassed their August highs the Financial ETF (XLF) has. After 5 straight days of gains, the group is on the cusp of overtaking the longer-term trend line. That would be the first step in signaling a break in the BEAR trend. So, are Financials telling us they are about to take over market leadership and lead the indices higher OR are they the outlier and will eventually fail at the long-term resistance trendlines? We should have an answer real soon.
Commodities
I continue to preach that we should see many Commodity prices go higher in the future, particularly in areas like Crude Oil, Natural Gas, Uranium, and some Agricultural Commodities.
Right now any “long” position on Commodities is a “short” bet on the U.S. Dollar, in which Commodities are priced. Since June, Commodities, as a group, have generally trended opposite to the dollar. The dollar has softened recently and many commodities have done better. The Commodity sector ETF (BCI) remains in a trading range in the short term.
Healthcare
Another positive divergence has appeared. The Healthcare ETF (XLV) has resumed its BULLISH long-term trend as the group has been strong lately. XLV is back at the upper end of its trading range and it also has taken out its August highs.
Biotech
More sideways action for the Biotech ETF (XBI) ($81). If I didn’t mention it before this ETF is a great candidate to BUY and then SELL upside calls against the position for income. A narrow trading range is established and at some point, the ETF will break one way or the other. With the “base” established, the probability that another move back to the August levels around $94-$95 is pretty high.
Semiconductors Sub-Sector
When we speak about a downtrend in place, the Semiconductors (SOXX) are a perfect example of that. This could also be another instance where the rally fizzles at resistance. The group inched higher this week, but we’ll need to see another push higher to break the short-term downtrend in place. The longer-term view is less encouraging as the downtrend has the SOXX ~12% from its longer-term trendline that defines a BULL market and that trendline that has now rolled over.
ARK Innovation ETF (ARKK)
The ETF that has nine lives, the ARK Innovation ETF continues to hold a support area that has been in place since May. I can’t make a case for a rally and I can’t make a case for a pullback. However, the picture shows that a case can be made for more sideways action. If this range can hold as support the elongated base will bode well for any future rally that emerges.
The longer the base, the higher in space.
Cryptocurrency
Crypto assets have continued to trade “soft” as the fallout of the FTX collapse continues to unfold. This week’s headlines were clogged with several of follow-up reports including the new FTX CEO providing a laundry list of corporate shortcomings and talk of contagion within the space.
Despite the slew of negative headlines, prices of most major cryptos have not cascaded to fresh lows. Instead, the past week has generally seen some consolidation.
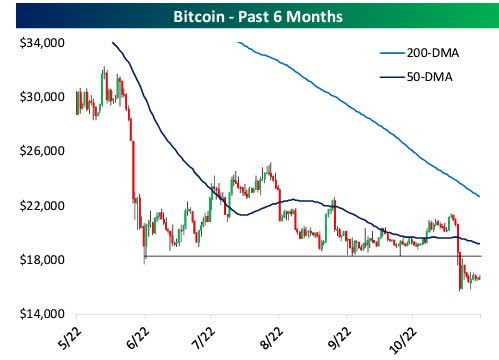
Bitcoin (www.bespokepremium.com)
While there were no new lows this week, it is evident that Bitcoin has broken down. The believers (retail investors) will remain entrenched in their notions about this asset and will look to keep cryptos propped up. In the interim, I doubt institutions will be tripping over themselves to add exposure. There are research studies that now have determined that 75% of crypto owners are in the RED. That should stifle any prolonged rallies as there are plenty of folks that will be looking to get out and keep selling pressure elevated.
Anyone interested in shorting Bitcoin can do so by adding a position in the Bitcoin “Short” ETF (BITI). It is not leveraged and will follow the price of BTC. Full disclosure: I am short Bitcoin with a position in BITI.
Final Thoughts
I’ve made my views about the stock market as clear as I can possibly make in a situation that is always going to involve some inherent uncertainty. Those views haven’t changed all that much.
I continue to tell everyone that wants to listen, that the ONLY way to build wealth over time is by using OPTIMISM as a default setting. That is because over a long period the stock market goes up, and defaulting to a negative mindset is counterproductive to that MACRO trend. That leaves plenty of investors with a fine line to walk now. For those that do not have TIME on their side, they need to review their strategy at what is yet another CRITICAL point in this BEAR market. I’ve always viewed technical chart analysis to aid in walking that line. Price action never lies.
The stock market itself will tell us when things are changing for the better. We just have to listen and follow the messages. In the interim I don’t assume anything, nor do I speculate on what could happen.
Postscript
Please allow me to take a moment and remind all of the readers of an important issue. I provide investment advice to clients and members of my marketplace service. Each week I strive to provide an investment backdrop that helps investors make their own decisions. In these types of forums, readers bring a host of situations and variables to the table when visiting these articles. Therefore it is impossible to pinpoint what may be right for each situation.
In different circumstances, I can determine each client’s situation/requirements and discuss issues with them when needed. That is impossible for readers of these articles. Therefore I will attempt to help form an opinion without crossing the line into specific advice. Please keep that in mind when forming your investment strategy.
THANKS to all of the readers that contribute to this forum to make these articles a better experience for everyone.
Best of Luck to Everyone!
Be the first to comment