

imaginima
The EIA’s Short-Term Energy Outlook gives the USA data as C+C as well as total liquids, OPEC as crude only, but the rest of the world is Total Liquids only. All data in the charts below are million barrels per day.
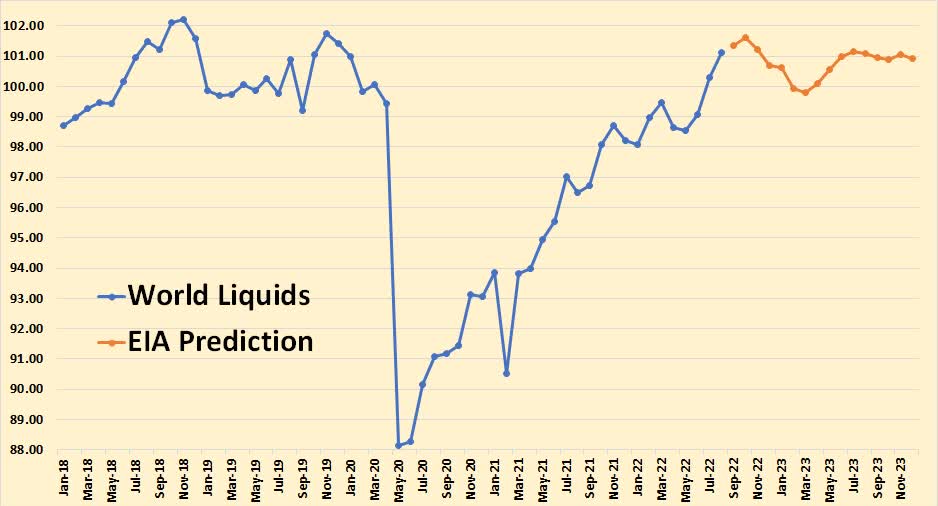
The known data is through August 2022, the rest, in red, in million bp/d, is the EIA’s estimate. However, this is Total Liquids, not C+C. And Total Liquids is not a good indicator of oil production as the below table shows.
This is the number that the EIA quotes for July 2022
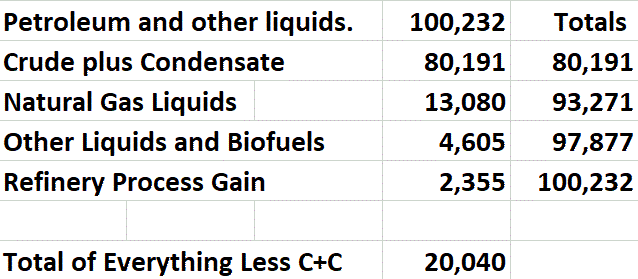
July is the last world data we have for C+C, so the data in the table above is for July 2022. The data is thousands of barrels per day. As you can see, the Natural Gas Liquids were over 13 million barrels per day. Other Liquids, which included Biofuels were 4.6 million bp/d. Refinery process gain was 2.355 million barrels per day.
Though the World Liquids chart above shows July 2022 production at just 1.915 million bp/d below the November 2018 peak, the World C+C chart shows July 2022 production at 4.394 million barrels per day below the November 2022 peak. That is almost a 2.5 million bp/d difference. Again, July is the last world data we have.
Does anyone really believe that bottled gas, cane and corn ethanol, or refinery process gain tell us anything about world crude oil production? Of course, the EIA gives us the C+C data but the STEO does not. Also, when the news media quotes the world oil production numbers, it is always total liquids.
The known data is through August.
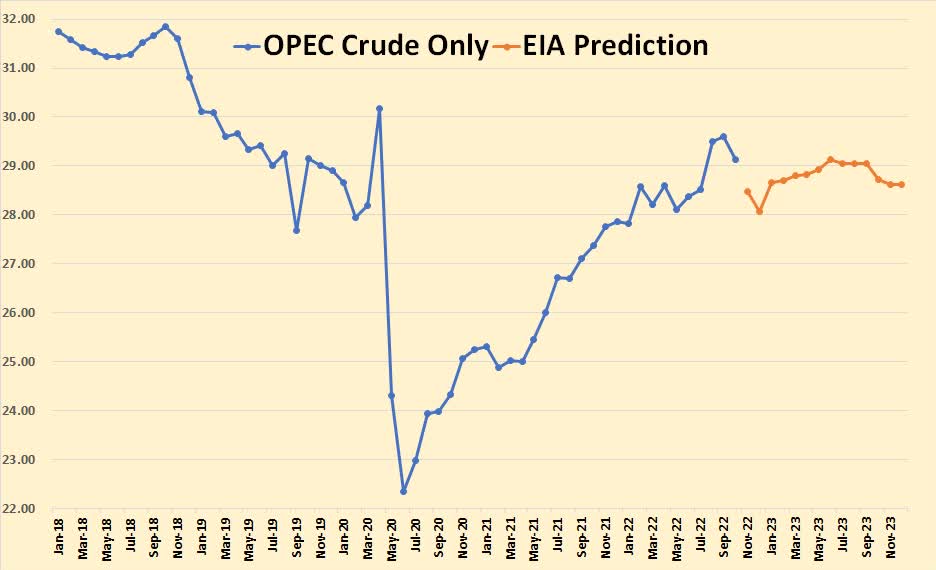
The known data for OPEC crude only is through October. The EIA expects OPEC crude to drop to almost 28 million bp/d by December but then rise to over 29 million bp/d by June 2023. I believe this is a bit overly optimistic.
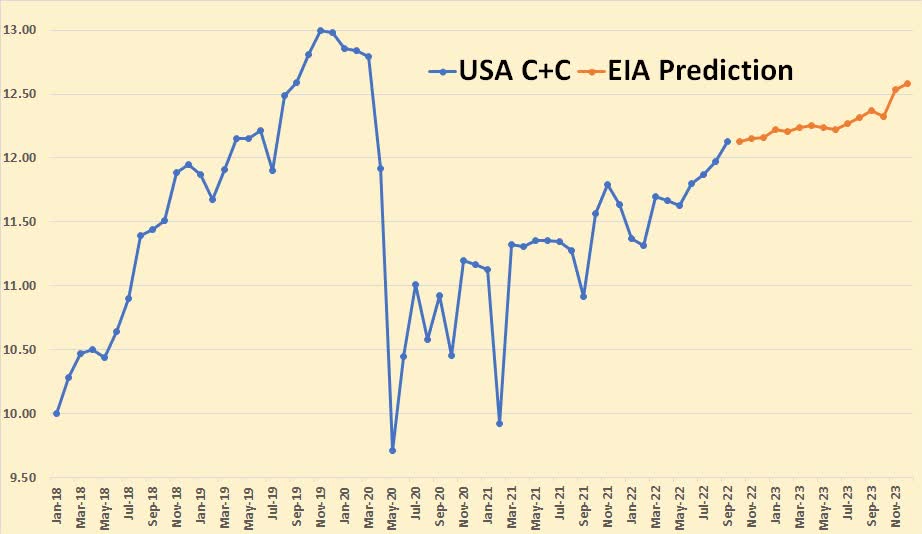
The known data for USA C+C is through September.
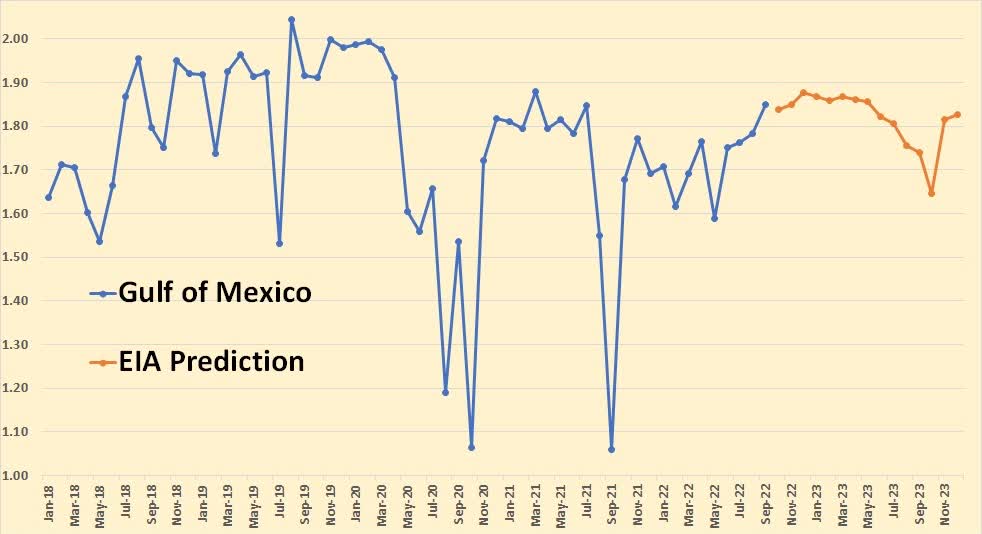
The known data for the Gulf of Mexico is through September. The EIA seems to think that the GOM has peaked, at least through 2023. The data here, as well as all data in the chart below, is Total Liquids.
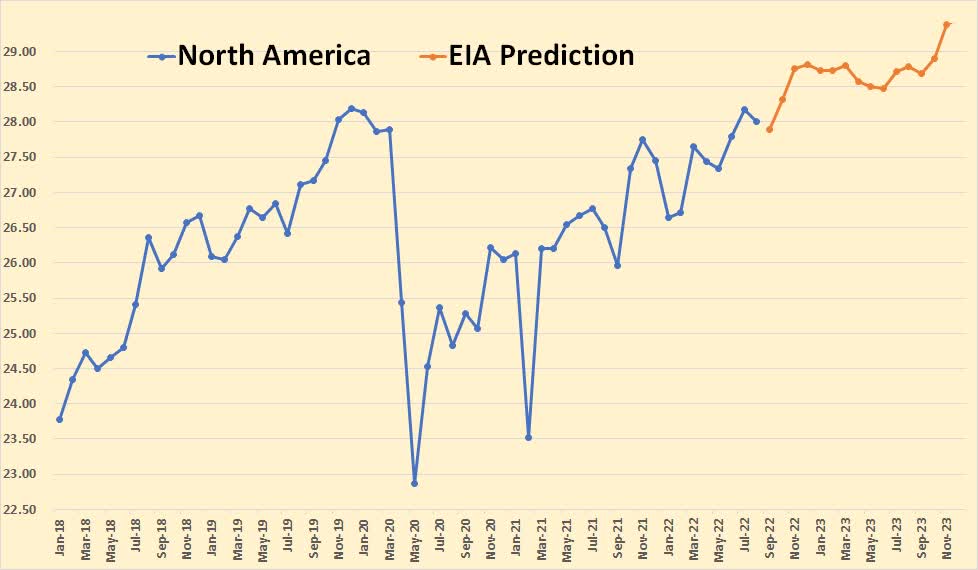
The North America Liquids known data is through August. The data includes the USA, Canada and Mexico. The EIA obviously thinks North America’s best days are ahead of her despite Mexico’s declining production.
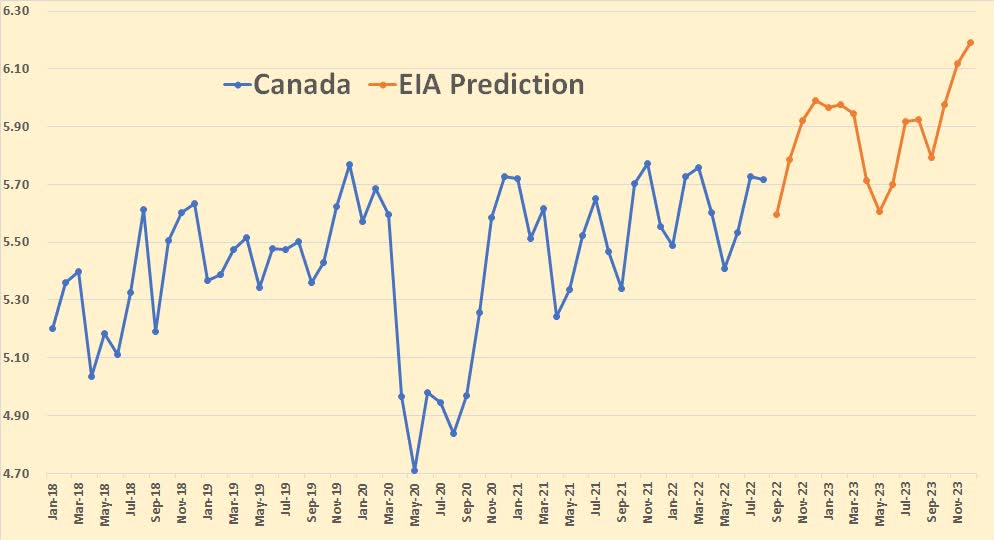
The known data for Canada Liquids is through August. The EIA is expecting Canadian Liquids to rise by almost half a million bp/d by December 2023.
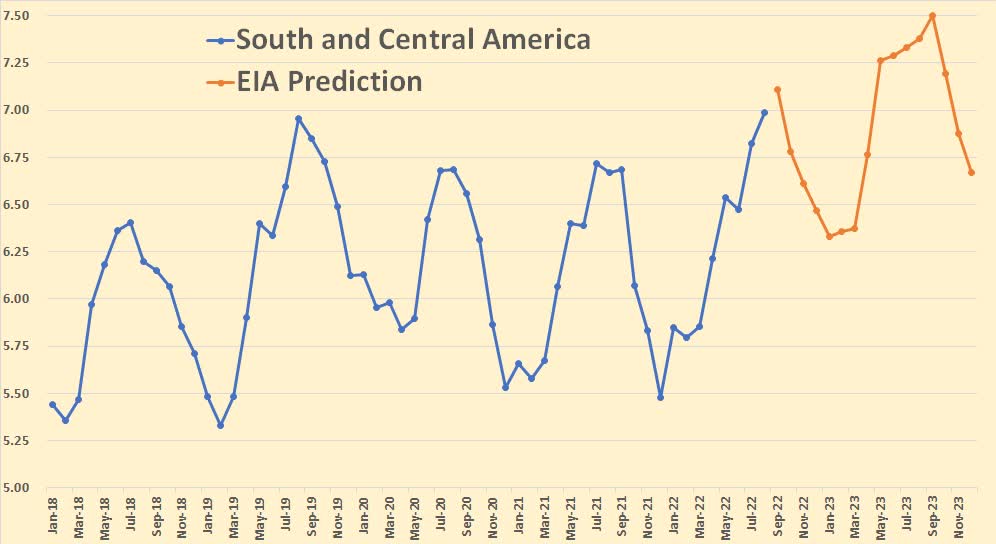
South and Central America include Argentina, Brazil, Colombia, and Ecuador. The huge seasonal swings are due to the seasonal production of ethanol in brazil. Known data in this chart and all charts below is through August 2022.
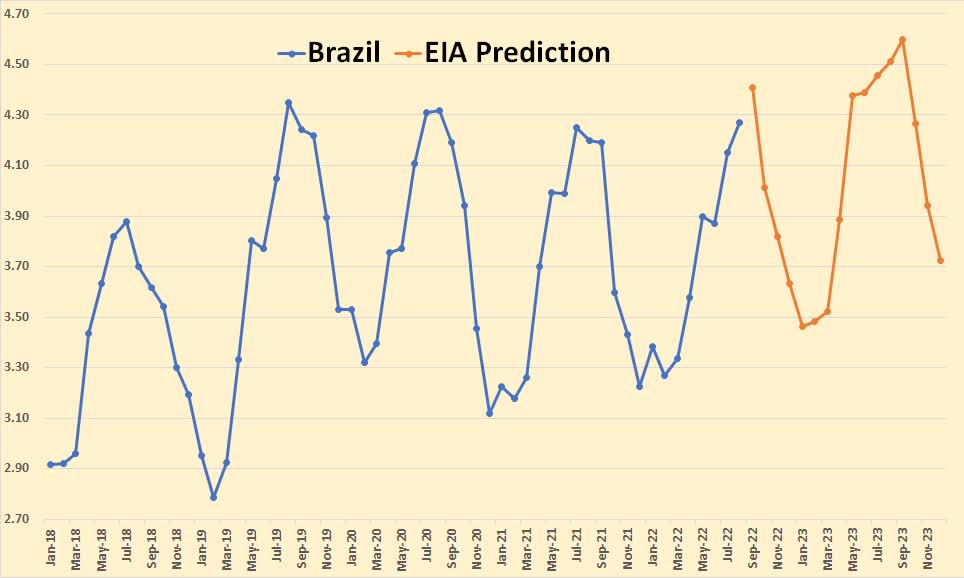
By including ethanol production in these charts, the EIA makes some of them useless.
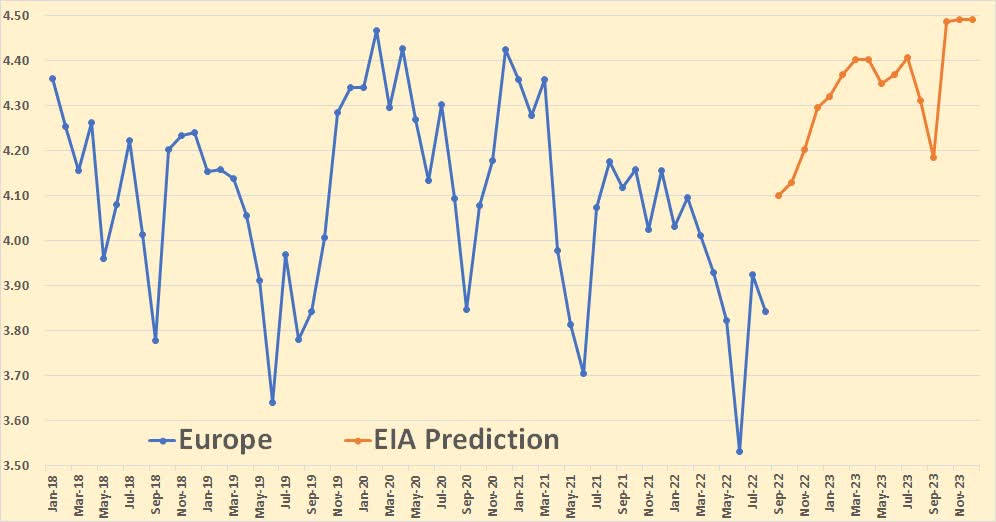
Europe consists primarily of Norway and the UK. Denmark and a few other countries contribute a small amount.
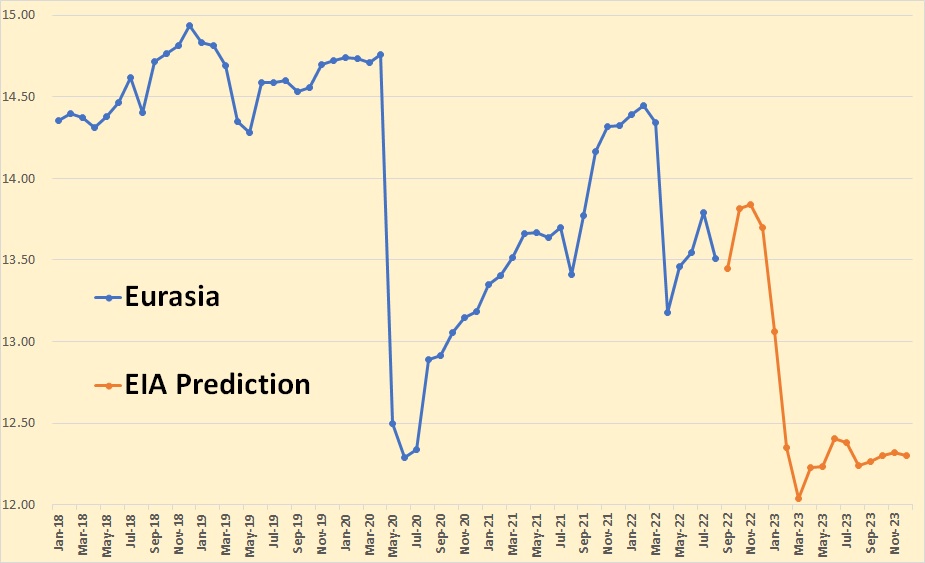
Eurasia consists of Azerbaijan, Kazakhstan, Russia, Turkmenistan, and a few smaller producers. The increase in expected October 2022 production is Kazakhstan getting their pipeline problems fixed, and the later huge decline is due to sanctions on Russia.
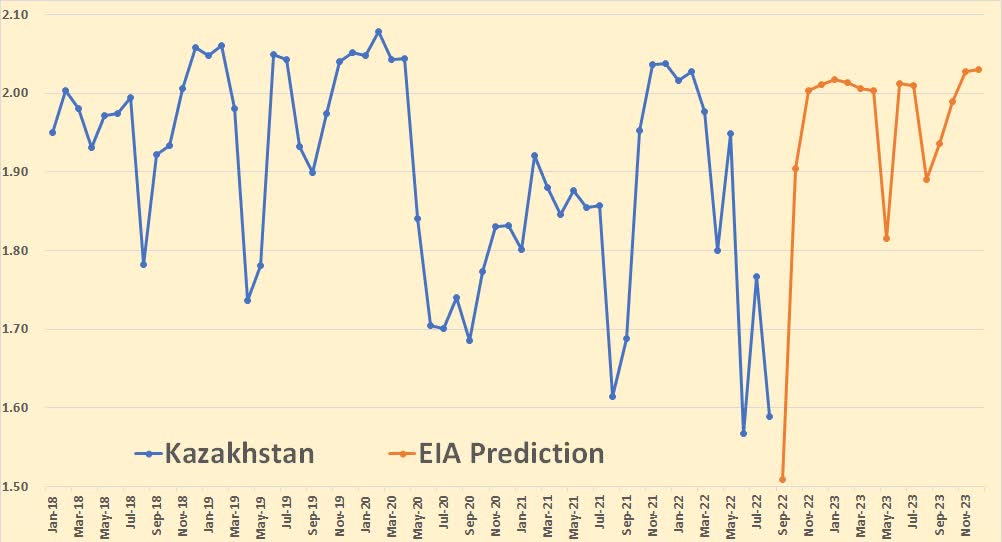
That’s a 390,000 production they are expecting from Kazakhstan in October.
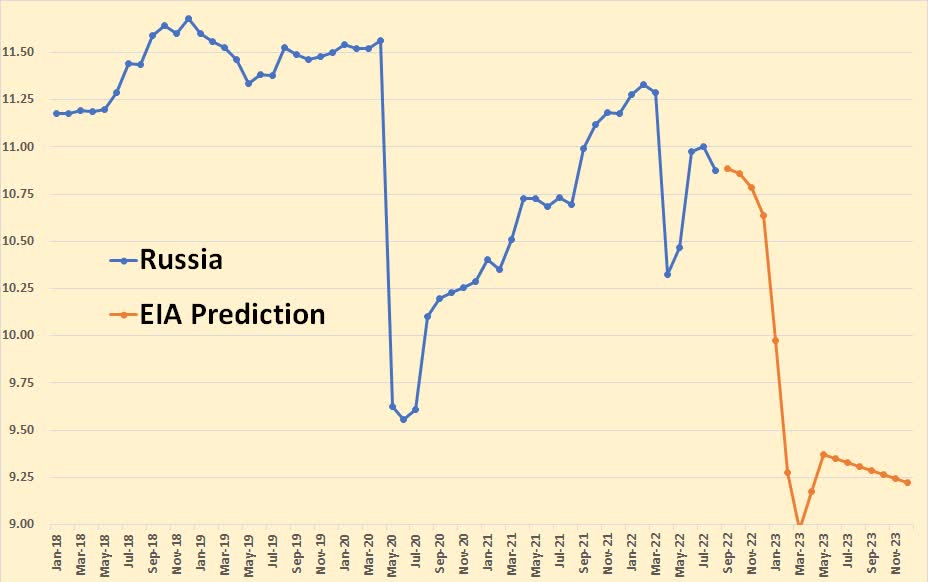
The EIA expects Russian production to drop by about 1.9 million barrels per day by March 2023 before recovering slightly.
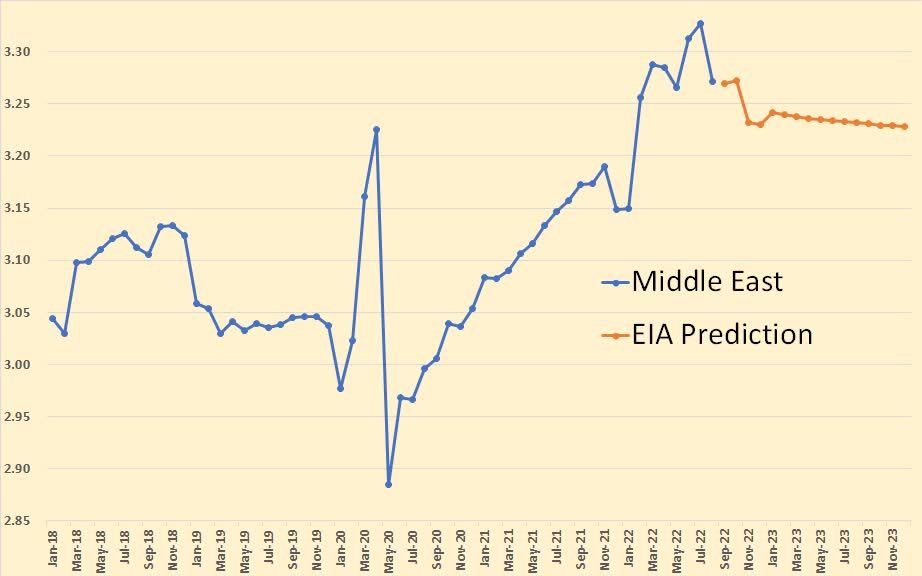
The Middle East is mostly OPEC, but all OPEC nations are bundled together in the EIA’s STEO reporting. This chart includes only Oman and Qatar.
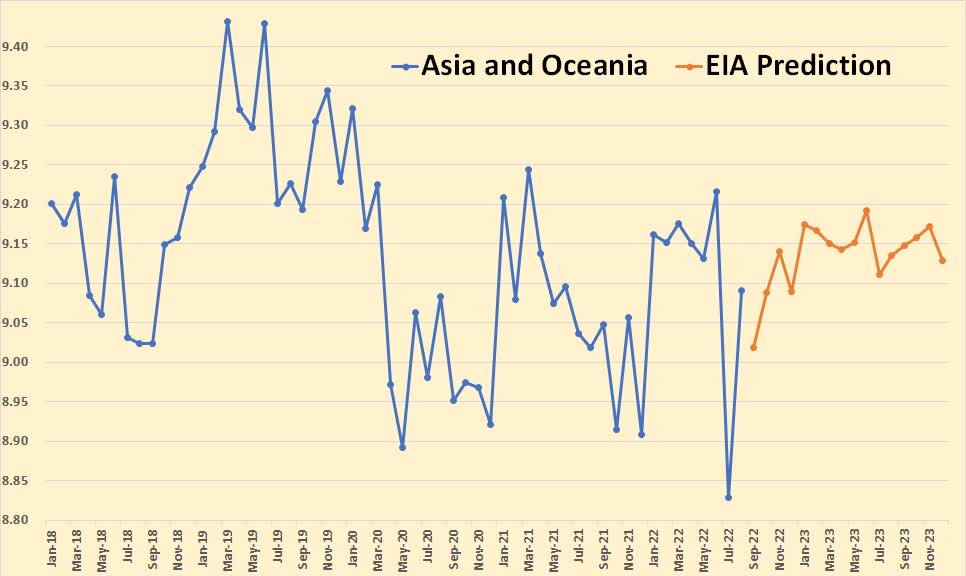
Asia and Oceania consist of Australia, China, India, Indonesia, Malaysia, and Vietnam.
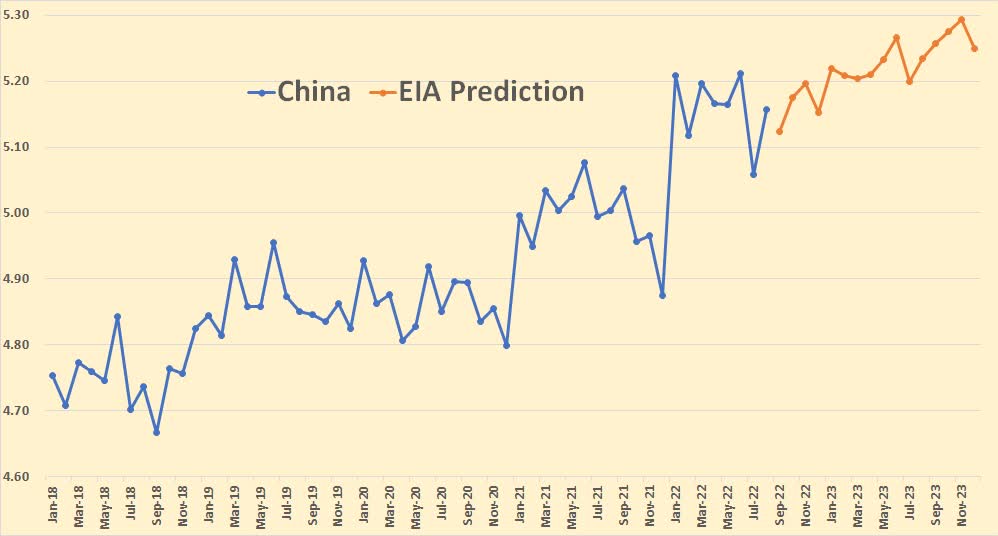
The EIA expects China to increase by about 100,000 barrels per day by the end of 2023.
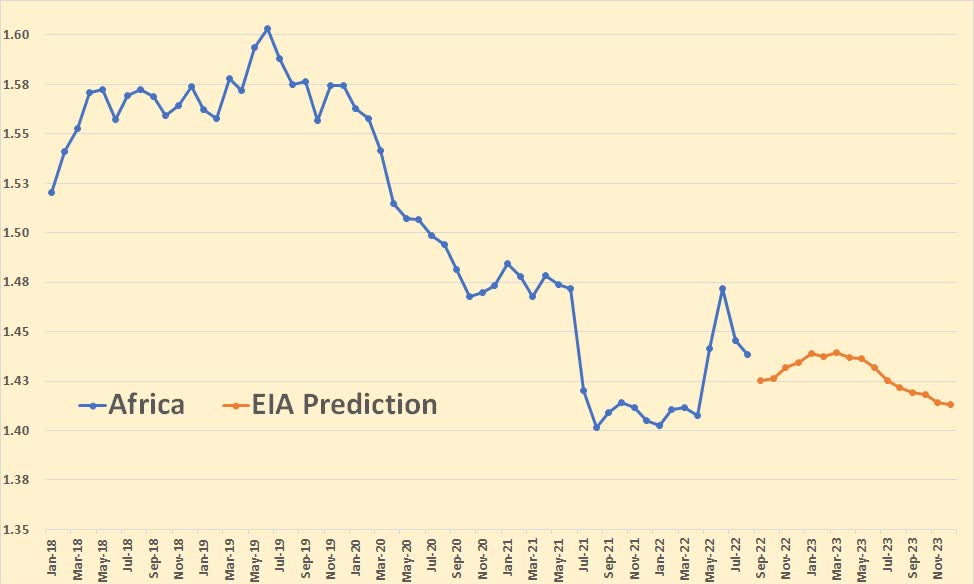
The African non-OPEC nations consist only of Egypt and South Sudan.
Editor’s Note: The summary bullets for this article were chosen by Seeking Alpha editors.
Be the first to comment