

abdoudz
“Flexibility requires an open mind and a welcoming of new alternatives.” – Deborah Day
“You can choose between having an open mind and being a skeptic. There is no in-between.” – Brownell Landrum
The Macro View
I rely on different components that make up what I refer to as a near-term “Risk Gauge”.
- Sentiment
- Seasonals
- internals
- Valuations
- Economy
- Technicals
- Market Cycle
- Financial conditions.
I listed them in that order for a reason. The first 3 are Bullish. The 4th is Neutral and the last 4 are BEARISH.
The most bullish short-term environment would be one where a majority (or all) of the indicators are BULLISH, and the opposite is true when all or most of the items are BEARISH.
When I review the battle between the Tailwinds and Headwinds, they appear to be closely matched.
Tailwinds
- Strong Seasonal period
- Investors overly pessimistic
- Internals looking better
Headwinds
- Hawkish Fed
- Bear Downtrend entrenched
- Inflation remains “sticky”
- Housing is in trouble
Upon further examination, we can see that the Tailwinds are all SHORT term oriented, while the Headwinds are all MACRO issues. Hence, it’s easy to see why so many are favoring a positive near-term market backdrop in what is still viewed as a long-term Bearish scene.
Inflation Impact
There is little doubt as to what will remain in focus and what will rule the stock market in the next few months, and it does get tiring talking about the same topic; Inflation. That of course brings us to the second topic that investors are tiring of; The FED
If an investor reviews the facts surrounding those two items it leads them to the notion that this bear market has not fully run its course (at least in terms of time). If you believe in the “sticky” part of the inflation story, it will be difficult for equities to show any durable upside with inflation well above normal. So we can expect choppiness with Fed hikes hitting economic and earnings growth ahead, and tighter policy still needed. Inflation will moderate over the next 12 months allowing the Fed to back off and that will support the upside for stocks. The most important and biggest question is when inflation begins to moderate and by how much.
So while we watch the “When” and “How Much” story evolve we can expect an impact on market volatility and price levels in the coming months. We’ve already seen some answers provided on the “When” part. Recent CPI and PPI data indicate that inflation has finally peaked and has leveled off. The “How Much” is still to be determined, and there are factors at work that suggests this scene has the chance of lasting well into 2023. However, I can make a decent case that equities have priced in a large portion of the poor economic backdrop. Investors will just have to sit back and play the waiting game.
Investors got their first glimpse of what slowing inflation looks like with the recent CPI/PPI reports. While that is certainly a BIG positive, please remember one month is not a trend, and inflation is still running at a 7.7% year-over-year pace. That is well above the Fed’s target zone. We’ll have to see more evidence before this issue is finally put to bed.
Recession Watch
For those that are “forecasting” a recession next year, the countdown to the recession started after the recent inversion in the 3-month to 10-year curve. On average, a recession starts about 11 months after this segment of the curve inverts. However, there is wide variability around that average with the shortest time to a recession being five months and the longest nearly 17 months. Regardless of when it “officially” begins, we should expect economic growth to be lackluster well into the latter part of next year and possibly beyond.
The counterargument comes from those that are still citing the possibility of no recession and a “soft landing”.
I don’t see a need to debate this issue. The stock market has told every investor about the economic backdrop that ushered in this BEAR market. The S&P is down 20%, the NASDAQ is off 40% and there are plenty of stocks that have been cut in half. That’s all any market participant needs to know about how good or bad the economy is.
The Week On Wall Street
After a CPI-fueled monster rally last week, where US stocks had one of their best weeks of the year, the tone in equities to kick off the new week was muted. The S&P 500 moved between gains and losses all day before late-day selling dropped the index 0.87%. All of the other indices followed along with losses as well.
The BULLS were re-energized by another better-than-anticipated PPI report, but that became a distant memory by Friday afternoon. Back-and-forth trading was the scene this week with every major index basically going nowhere. When the bell rang to close out the week, the recent leading DJIA was the only index to post a modest gain. All of the others posted minimal losses.
Global Markets
After rallying more than 14% off its October lows, Europe’s benchmark STOXX 600 index is now trading above its 200-day moving average. That’s something we haven’t been able to say since early January. Perhaps even more impressive than the 14% rally in local currency is the fact that in dollar-adjusted terms, the STOXX’s performance off the October lows has been a gain of just over 20%.
STOXX 600 (www.bespokepremium.com)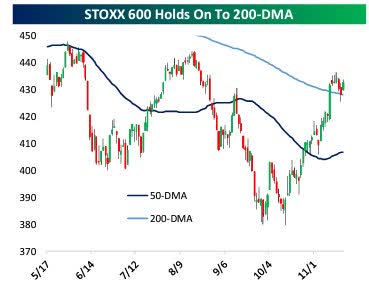
Similar to the charts of the US indices, the next level to watch for European stocks is the high from August. Despite their short-term outperformance, European stocks remain in a deep hole relative to the US. Over the last five years, the STOXX 600 is up 32% in dollar-adjusted terms while the S&P 500 has rallied 69%.
If I make any move in this area it will be to short the Eurozone using (EUO).
The Economy
Inflation
This week’s PPI report was just what stock and bond bulls ordered. PPI October gains were a lean 0.2% for the headline and a flat figure for the core Today’s PPI core price weakness accompanies last week’s welcome CPI core undershoot of a 0.3% gain. The reports suggest that the “transitory” component of price gains related to supply chain disruptions over the past two years has finally started to reverse course.
Both the headline and core y/y PPI metrics have now posted a 7-month pull-back from all-time highs in March. The headline gain fell to 8.0% from 8.5%, versus the 11.7% record in March, while the core gain fell to 6.7% from 7.2%, versus a 9.7% record in March.
The short-term trends have turned down but it will take some time to get the longer-term trend lines to get back to anywhere near “normal”.
CORE CPI (www.bespokepremium.com)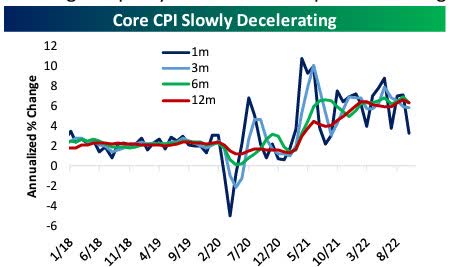
RENTS (www.bespokepremium.com)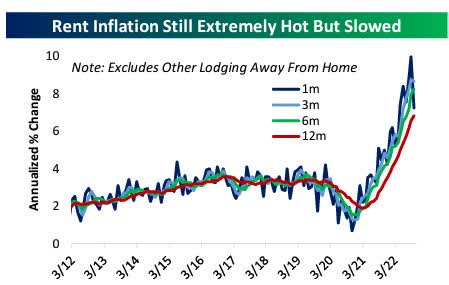
SERVICES (www.bespokepremium.com)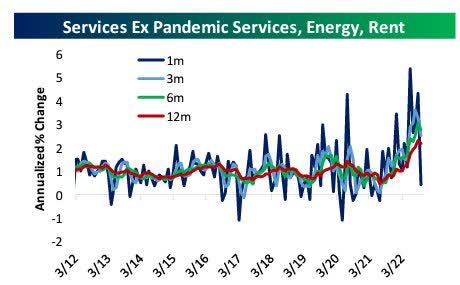
Despite the robust forecasts for Q4 GDP growth, the data being reported shows a completely different picture.
The U.S. leading index plunged 0.8% in October to 114.9, much weaker than expected, following the 0.5% September decline to 115.8.
Leading Index (www.investing.com)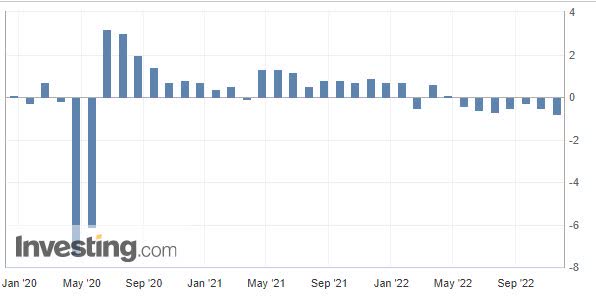
There has not been an increase in the monthly index since February, a pattern not seen since the 2008 recession. The components were mixed but a big 0.25% drop in consumer expectations was the big culprit pulling down the index.
Employment
The recent announcement by Amazon (AMZN) planning to lay off 10,000+ and Federal Express (FDX) furloughing drivers is a sign of the times as the economy slows. Both of these companies want to get leaner now BUT the timing of these announcements could be an ominous sign for the holiday shopping season.
If we add in Disney’s (DIS) plans to cut employees, the notion that I floated a while ago about the jobs picture being the last shoe to drop in this economy looks like it could be taking shape now.
Consumers and their DEBT
Retail Sales beat analysts’ estimates, with 1.3% October gains both with and without autos after big upward revisions. Retail sales gains and upward revisions were widespread, alongside a lift from the climb in gasoline prices.
Total household debt rose by $351 billion, or 2.2 percent, to reach $16.51 Trillion in the third quarter of 2022. Mortgage balances-the largest component of household debt-climbed by $282 billion and stood at $11.67 trillion at the end of September. The 15% year-over-year increase in credit card balances marked the largest in more than twenty years. The share of current debt transitioning into delinquency increased for nearly all debt types, following two years of historically low delinquency transitions.
Consumer balance sheets are still in GOOD shape and are nowhere near the levels seen before the financial crisis recession. However, there are signs creeping in indicating that at least a segment of the consumer population is struggling to keep up with inflation.
Housing
The NAHB housing market index dropped another 5 points to 33 in November after diving 8 points to 38 in October. This is the 11th consecutive monthly decline and is the weakest since June 2020. The present single-family sales index fell 6 points to 39 after slumping 9 ticks to 45 previously. The future sales index dipped 4 points to 31 following the 11-point plunge to 35, a 10-year low. The index of prospective buyer traffic was down another 5 points to 20 after sliding 6 points to 25, also the weakest since April 2020. Homebuilders continue to face a number of headwinds, including higher mortgage rates, higher building costs, and recession fears.
Housing data on “starts” and “permits” aligned with estimates. “Starts” dropped 4.2% to 1.42 million in October after they slid 1.3% to 1.48 million in September. Single-family starts took the brunt of the weakness, falling 6.1% to 0.85 million after declining 1.3% to 0.91 million in September. Building permits tumbled 2.4% to 1.52 million.
Existing home sales dropped 5.9% in October to a 2-year low pace of 4.4 million. The drop marks a ninth consecutive decline, as soaring mortgage rates, fears of recession, price cutting after years of outsized gains, and an unwillingness of owners to relinquish properties have sharply depressed activity. Inventories of homes on the market remain quite lean, at 1.22 M, with a 3.3 month supply, and prices a falling more slowly than expected, with a $379,100 median price in October that is below the all-time high of $413,800 in June.
Analysts expect a 5.12 M sales total for 2022. This translates to a -16.4% drop in 2022, after increases of 8.5% in 2021 and 5.6% in 2020.
Housing is in a deep recession and that eventually starts to affect other areas of the economy that are dependent on a strong housing market.
Manufacturing
Industrial production dipped 0.1% in October after rising 0.1% in September and falling 0.1% in August. This is weaker than expected. Capacity utilization fell to 79.9% from 80.1%. It is the weakest since June. History shows that recessions have not occurred while capacity utilization was still rising. Today’s report showed Utilization fell to 79.9% in Oct & was revised down for Sept to 80.1%. It is no longer rising.
The Philly Fed index slumped another 10.7 points to -19.4 in November, much weaker than expected, after rising 1.2 ticks to 8.7 in October. This sustains the saw-toothed pattern seen this year and leaves the index at its lowest since May 2020 and the pandemic.
Philly Fed (www.philadelphiafed.org/surveys-and-data/regional-economic-analysis/mbos-2022-11)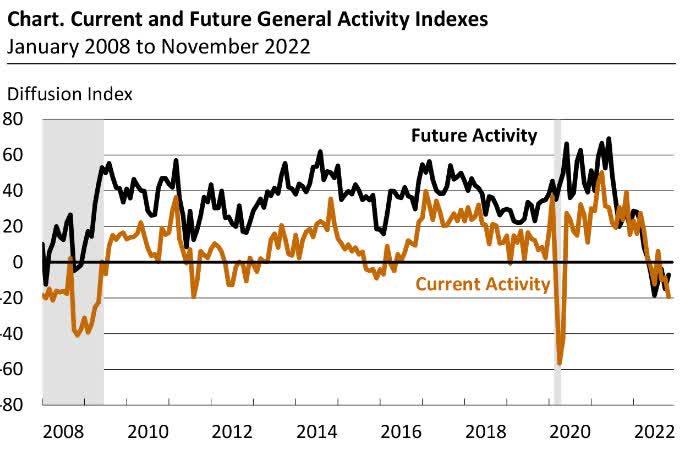
Manufacturing in this region is already in a recession.
While there are some pockets of stability, there is no growth in manufacturing with most districts in contractionary territory. The rhetoric on a “manufacturing renaissance” isn’t aligned with the data. I’ll remind everyone that the data is REAL, and that leaves the rhetoric “questionable” at best.
The Global Scene
Singapore Trade Activity: Trade volumes at the busiest transshipment port in the world continued to fall as total containers handled dropped 1.5% in October. Container throughput is down 8% in three months from record levels as trade volumes across a range of national economies have sagged. Reexports from Singapore have also started to fall precipitously, down 8.3% Month over Month in dollar terms and off over 9% from their record high this summer. Domestic exports are also collapsing too, falling over 3% in October to the lowest levels since March.
Singapore Trade (www.bespokepremium.com)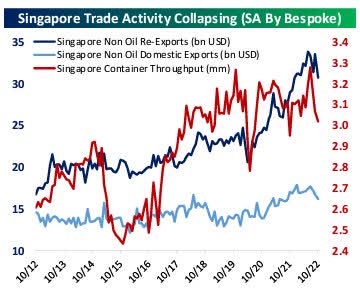
The totality of the data is clear: global trade is slowing
China
Investors received updated major monthly data sets this week from China covering consumption, production, and investment. Retail sales fell at a near-8% annualized pace, dropping in nominal terms for the third month out of four and the fifth month out of the past seven.
Industrial production also slowed, rising at a 4% annualized pace in October. Other than the sharp declines from April driven by COVID-Zero lockdowns, that’s the slowest pace since January. Investment also slowed, with total nominal fixed asset investment up just 1.4% annualized.
Despite the weak economic data the Chinese market continues to rally with the rest of the world. The notion that China is finally going to “open up” the economy is driving this trade. The Hang Seng is up ~21% in the last 16 trading days. The China 25 ETF (FXI) is up 25% in the same time frame. The Chinese CSI 300 (ASHR) lags, it’s only up 13% in the last 15 days.
The U.K.
Inflation in the UK is now running north of 11%, a 41-year high. Soaring inflation was mostly thanks to energy prices, with natural gas prices up 36.9% MoM and electricity up 16.9% Month over Month. Consumers are somewhat insulated from those surges via fiscal policy but the moves are nonetheless dramatic. At some point that short-term “insulation” that the government is providing in the form of subsidies today will eventually be passed on to the consumer in the form of additional taxes.
In the meantime, the newly elected prime minister reinstated a fracking ban that had been lifted ensuring energy costs will remain high. Today the UK announced they will INCREASE the 25% windfall tax on energy companies to 35% and keep that in place until 2028.
Policy errors have consequences, and the repetitive nature of these mistakes is alarming. I commented recently that the election of Rishi Sunak as prime minister and his policies would cement a recession in place for quite some time. The slow-motion train wreck I predicted is starting to unfold.
Geopolitical Scene
During the week, there were concerns that the geopolitical scene was about to go off the rails when a missile from the Russia/Ukraine war hit NATO country, Poland. There were immediate calls for Article 5 and stern rebukes by leaders from around the globe condemning Russia.
As it turns out it was a Ukrainian defense missile that landed in Poland. In a typical knee-jerk reaction, stocks sold off on the headline. Let me be perfectly clear. There are many reasons to sell equities from inflation to rising rates, dollar strength, poor growth, a recession, and a host of other reasons. But the Russian /Ukraine war has not been and is not a reason to lighten up on stocks. This war is not affecting the US economy one iota, except for adding more spending to aid Ukraine’s defense. That should not be taken that I am against providing aid to Ukraine, it is simply the FACT of the matter.
Finally, are we really going to believe Russia wants to expand the war and bring in NATO when they are struggling, if not losing the war in Ukraine?
Common sense states an emphatic, NO. The war is horrific, and it needs to end, but it has been nothing more than a political scapegoat talking point to distract from inflation and a poor economy.
Political scene
Although some Republican strategists were forecasting better results in the midterm elections, the outcome was much more muted. The Senate will remain in Democratic control while Republicans have control of the House.
That type of shift from full Democratic control to Republican control of the House has only happened one other time since WWII. So here we are again, another data point that leaves us in basically uncharted territory.
It appears a 50-50 country produced a 50-50 election result, and nothing has changed.
The Yield Curve
Last week the near-term headwind of a rising 10-year Treasury turned into a near-term tailwind as the 10-year rate pulled back. The 10-year leveled off this week closing at 3.80% and leaving investors wondering if the modest pullback is over.
The “2-10 spread” is inverted and that inversion is now the steepest U.S. yield curve inversion since 1982: US 2-year yields are now 69 basis points above rates on 10-year notes. In the meantime, the Fed’s preferred method to measure recession risk is the 3M/10Yr spread. After narrowing dramatically week after week, the 3M/10Yr curve has now inverted with the 3-month closing above the 10-year at 4.34%.
Upon further inspection of the entire yield curve, every series on the chart is now inverted. From the 1-month (3.93%) and above, every rate is higher than the 10- year Treasury.
These are all considered recessionary signs that have a good track record of forecasting economic downturns. Some can argue that we aren’t in a recession today, but this data is overwhelmingly stating that US will be in a recession soon.
Food For Thought
Capitalism works, and it helps EVERYONE. A concept that is seemingly forgotten in society today. The often maligned founder of Amazon, Jeff Bezos has decided he will give away the bulk of his fortune to charity.
Political leaders find it more to their liking when they bash corporations and are proposing more taxes. Individual corporate leaders have been singled out and brought in front of congressional hearings to get their turn in the hot seat.
It is part of the anti-business mindset that prevails today and it’s contributing to the decline in the economy. Whether or not the economy can grow again is dependent on corporate America and the people that run it.
There can be no economic growth without pro-growth business policies in place. Shackle economic growth with taxes and regulations and it will result in no/slow equity market growth.
Prosperity in America doesn’t exist without Corporate prosperity. Until there is a material change in business policies LOW probability) the economy will muddle along the bottom.
Climate Obsession and a POOR Economy are NO Coincidence
The graphic presented below is from a research report published by the American Enterprise Institute.
CO2 Emissions (www.aei.org/)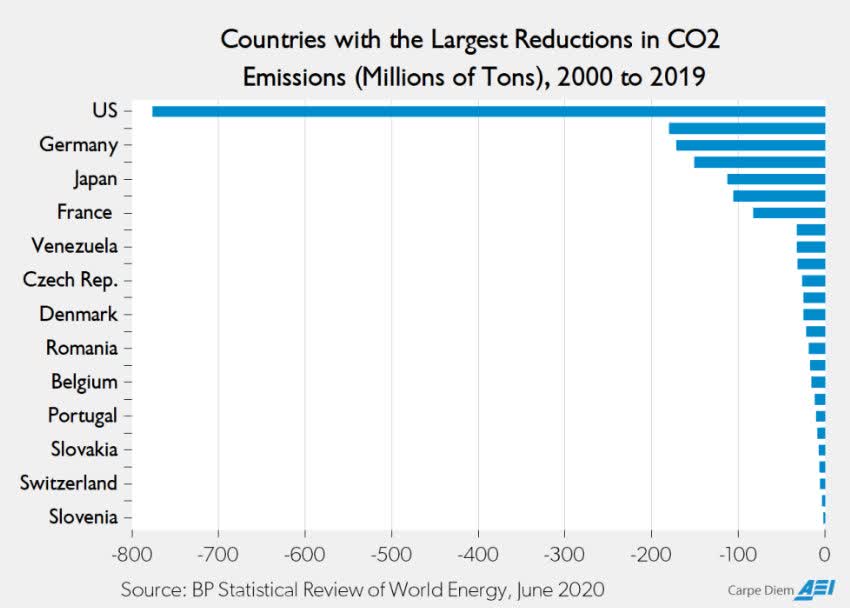
As the chart above shows, the US led the world in reducing CO2 emissions this century by almost 800 million tons between 2000 and 2019. Of the countries that have reduced C02 emissions this century, the reduction in the US was roughly the same as the reduction in the next ten countries combined. Over that same period, CO2 emissions increased in China by nearly 6.5 billion tons and in India by 1.5 billion tons.
The report goes on to say;
For that “greening” of America this century and for the US being the world leader in reducing CO2 emissions we can thank hydraulic fracturing for its major contribution in replacing high-carbon coal with low-carbon natural gas.”
That’s correct the same fracking that was recently banned in the UK and is under attack here in the US. It’s not enough to reduce dramatically it has to be zero. From an economic standpoint, any country taking that approach will suffer dearly.
While the US progress in Emissions is admirable it means little if the rest of the world isn’t on board at the same level. It’s obvious that the rest of the world isn’t on board at the same level as they fear the devastation to their economies by becoming climate obsessed. Notice that China and India do NOT even make this list.
Here in the U.S, if common sense arguments continue to be pushed aside, the economy will continue to suffer.
When it comes to the prevailing anti-business mindset, nothing has changed. More importantly, nothing is about to change anytime soon.
Sentiment
Based on the recent survey from AAII it looks like there are a lot of people that have bought into the end-of-year rally thesis. The latest AAII survey has shown a surge in bullish sentiment. The percentage of respondents reporting as optimistic jumped from 25.1% last week up to 33.5% this week. That is not only the largest one-week increase since the first week of June (when bulls rose by 12.2 percentage points) but is now the highest reading on bulls since the last week of 2021.
While 33% is not a wild reading indicating extreme bullishness it might be an indication that more investors are playing for the end-of-year rally.
The Daily chart of the S&P 500 (SPY)
After a big week of gains in the prior week, consolidation was the name of the game. The S&P was basically flat and it finished the week at the same level it closed at in March.
S&P 500 (www.FreeStockCharts.com)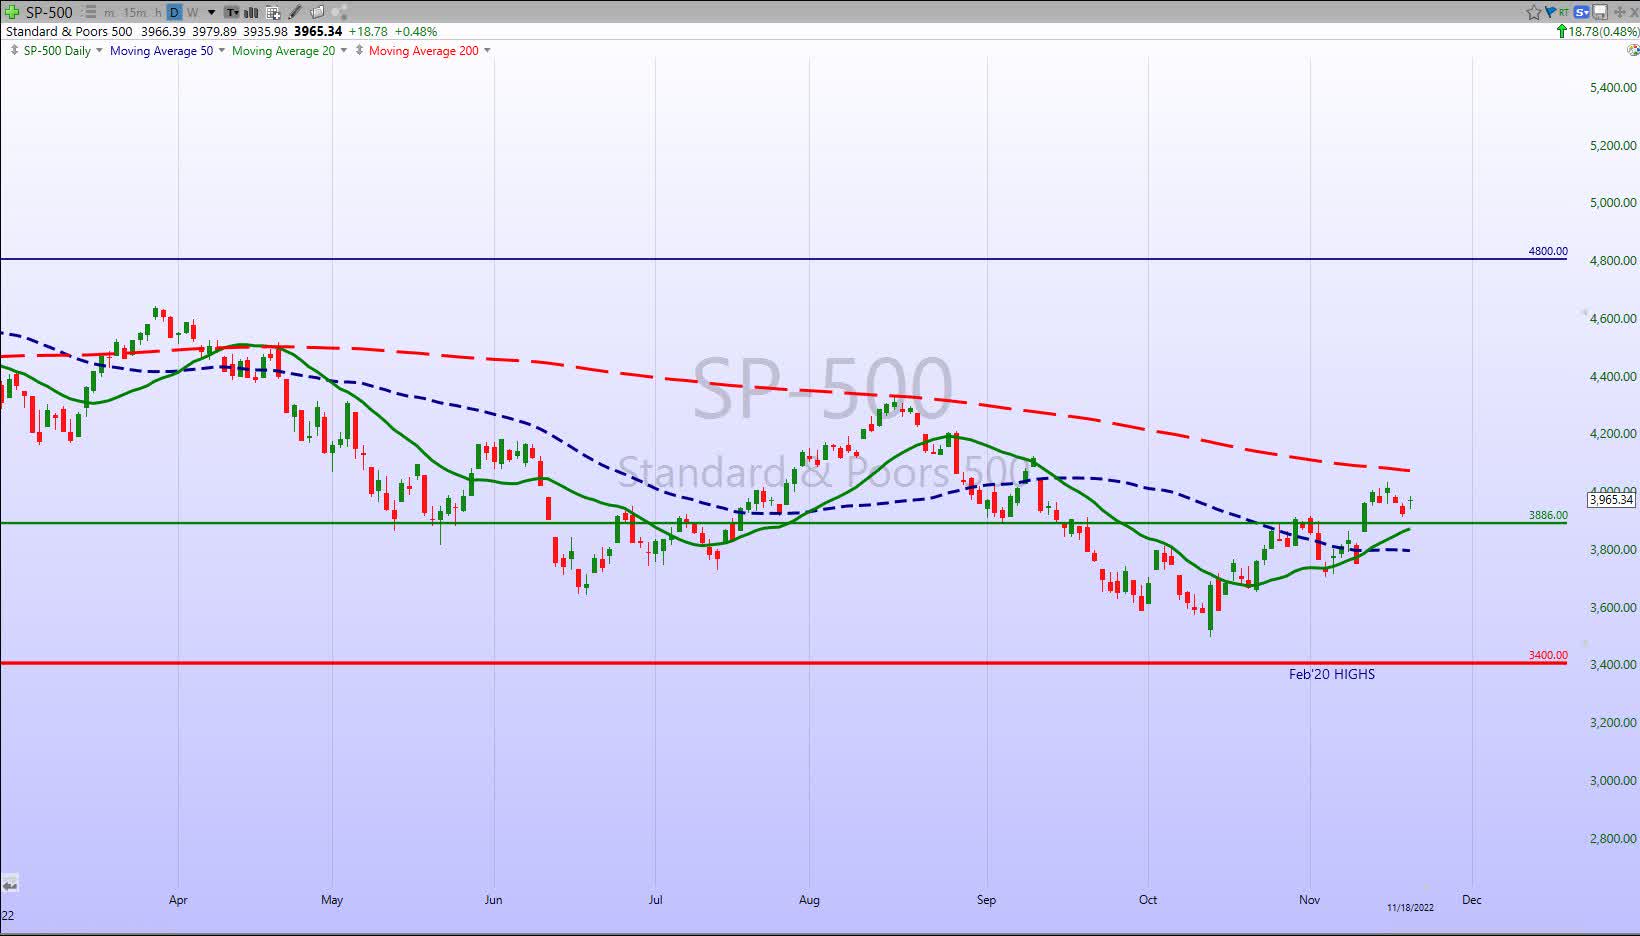
There was plenty of indecision this week and investors are still pondering what direction the next move will take. Support and resistance are in a tight range now, and it shouldn’t be too long before market participants get an answer.
Since I avoid guessing at the next move in the S&P 500, I’m doing more watching than acting.
Investment Backdrop
Maybe the inflation fever broke, perhaps China started to believe it can actually open its economy, a red wave that never occurred, and to top it off the crypto-currency ecosystem appears to have experienced its Lehman moment. Softer-than-expected October CPI and PPI prints have kept the BULL interested in buying. So many are on board with the notion that a year-end rally is in the cards. Maybe so but it’s still an unpredictable backdrop. I’m not going to list all of the issues. For one there are too many and unless you have been stranded on a remote island you already know them.
The DJIA is the leading index that might be signaling this expected rally. I am left pondering if the DJIA will lead the other indices out of the downtrends OR if will we see what has occurred in the past. The divergence of the other indices eventually led to more new lows for the S&P and NASDAQ.
The NASDAQ continues to lag behind, which is really nothing new but can open the door for across-the-board selling. While the BEARS are rooting for that, the BULLS look for the DJIA and/or the S&P 500 to continue a melt up to prevent the short-term bearish pattern of the Nasdaq from spiraling downwards. Which pattern wins?
It’s way too early to tell. While this rally has been impressive in terms of strength, there is still plenty of things that have to fall into place before we even entertain a change in trend. The potential scenarios are many and it isn’t necessary to go over them at this time. That would not only be confusing, but it will also lead to “speculating” on the potential outcome.
While analysts can cite a bunch of reasons for the rally, the primary headwinds that have held stocks back have reversed sharply. We just witnessed, the 10-year US Treasury yield producing the 17th most extreme downside move since 1980, and the US Dollar Index had its 9th largest daily decline over that same span. I don’t need to look any further than those two factors, and if they can become tailwinds for stocks, the rally continues.
If not, I have to wonder what catalyst will bring everyone to the market in a buying mood.
Thank you for reading this analysis. If you enjoyed this article so far, this next section provides a quick taste of what members of my marketplace service receive in DAILY updates. If you find these weekly articles useful, you may want to join a community of SAVVY Investors that have discovered “how the market works”.
The 2022 Playbook is now “Lean and Mean”
If a stock isn’t in the Energy, Healthcare, or Utility sector, then it is in a BEAR market trend. That leaves investors looking for near-term “long” opportunities with a very limited playing field.
Bifurcated Market
We talked about this last week. The indices are not following the same path. While the Dow Jones Industrial Average has made a higher high relative to its late October/early November high, the S&P 500 and NASDAQ 100 have not. It’s not the first time such a “non-confirmation” has occurred so far this year. Just eyeballing the charts, there were three other times in 2022 when the SPX and NDX failed to follow the Dow by making higher highs. In each case, it led to lower levels in all three indices.
Given all of the technical signs we are looking at now, the next few days and weeks will be critical. It will tell us what we can expect as we enter 2023.
Small Caps
The Small caps (IWM) had one more hurdle to get past, the 200-day moving average trendline ($186). It failed at that level this week and now searches for support. This rejection at resistance could indicate the rally in the small caps might have ended. That could also toss more cold water on the hopes for a further rally. The BULLS need this index to reverse and move higher.
Growth vs. Value
The market can’t rally without Tech. How many times have you heard this phrase uttered over the last 25 years? Technology is easily the largest sector in the market and has been the dominant sector for much of the last 25 years, so basic math would suggest that weakness in the Tech sector would make it more difficult for the market to make any headway. Over time, though, we have found that any time the market rallies and Tech isn’t at the front of the pack, it leads to doubts over the sustainability of the rally.
The same analysts that say the market can’t rally without Tech will also say that rallies are too narrow when Tech is leading the way. The S&P 500 was up 10.4% in the 21 trading days ending November 14th. The sectors that led the way might surprise you. Materials posted a 19% gain. Industrials are up ~16.5% and Energy has tacked on 15.4%. While Technology has outperformed the S&P 500 during this period, it has hardly been a leader and has underperformed all three of these ‘rusty’ old economy sectors.
Sector Performance (www.bespokepremium.com)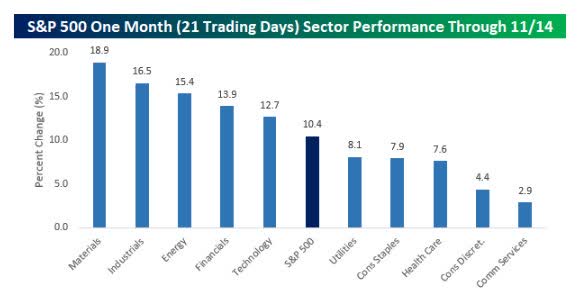
If you were on a desert island for a month and someone told you the S&P was up 10%, I doubt you would have named the leaders on that chart. I also doubt you would have guessed they outperformed technology. This is a rare occurrence but the overall stock market can rally with or without ANY sector as long as there are other areas to pick up the slack.
Fixed Income
The 40-year bond bull market is over. The 30-Year bond provided a huge warning earlier this year by breaking down through a trendline that had largely held going back to 1987, but my work shows that it’s even broken down further.
By pretty much any definition now, the uptrend has been violated and bond investors have to be concerned about the bigger picture. Obviously, even if the new primary trend continues in the next several years, it’s not going to be a straight path down. Individual bonds can still be used for income purposes with the intention of holding them to maturity. However, I don’t think investors should count on appreciating bond prices down the road and this area of investment needs to be looked at VERY carefully.
If you find what is presented here every week to be useful, the analysis and presentation to members of my service are complete with charts that zoom in on the critical pivot points for each group. A picture is worth a thousand words.
Sectors
Energy
My comments from last week;
The XLE can take one of two paths now. Consolidate this recent rally just below the old highs, then breakout to new highs, OR pull back to support. Either way, I wouldn’t be too aggressive by indiscriminately adding energy names now.”
The price action this past week doesn’t change that analysis. In fact, the Energy ETF (XLE has broken the first support level. While I see no issues with the long-term view, in the near term, it’s “wait and see” for the group. Any pullback is an opportunity to add to positions and I still recommend the group should be an overweight positioning in a portfolio.
For more active investors, this past week I recommended using “hedges” (inverse ETFs) to protect some of the massive gains in the group.
Natural Gas
The NAT GAS ETF (UNG) remains volatile in an attempt to build a base in the $18-$20 range. UNG was rejected at resistance this past Monday and a breakout of the upper or lower end of this range will determine the next big move.
I have not changed my Bullish outlook
Financials
If we are going to use Financials (XLF) as a “key” as to what comes next, and some analysts are, then here is another indicator that looks more positive lately.
All trend lines have been recaptured and the ETF has surpassed the June and August highs effectively breaking the near-term downtrend. The XLF is within 3% of breaking above the Longer-term 20-MONTH moving average. Similar to the DJIA it is a level that has capped the index since June. However if the ETF starts to weaken and is rejected at this important pivot point, it increases the probability that this BEAR market will be re-energized.
Commodities
Last week I Highlighted the Silver ETF (SLV);
It wasn’t too long ago that I mentioned what I believed was a positive setup for the Silver ETF. My entry into a position in early October turned out to be premature. The ETF dipped back for another test of support right after I bought SLV. There appears to be a decent base formed in the $16.50-$17 range, and now SLV has to contend with overhead resistance at $20. It is an intermediate /long-term hold for me now and if the ETF can get past resistance, the $23-$24 range is possible. SLV closed at $20 on Friday.
The breakout I was playing for (above $20) materialized and then quickly fell apart as commodities across the board were sold off on Thursday. It has been said that interest in cryptocurrencies took plenty of investment dollars that would have gone into gold and silver. BTC and other cryptos were being called a store of value. Now that the store of value has been tarnished some of that money could be heading back to both precious metal ETFs SLV and GLD.
I’m not a huge fan of the precious metals – I’m not sure what drives them just as I wasn’t sure what drives Bitcoin. They are all fueled by emotion. Price action will dictate my next move, and this trade is on a short leash.
Healthcare
A move above near-term resistance has the Healthcare ETF (XLV) looking like it might be ready for a move higher. (XLV) has also surpassed its August Highs and that leaves the group in a possible setup to challenge the YTD highs. The sector stays in a longer-term BULL mode.
Biotech
The Biotech ETF (XBI) has been highly volatile in the past two weeks, rallying from $77 to $86 (11+%) in five trading days. Some of these gains were given back as the ETF closed at $81 on Friday.
That minor breakout above all resistance may have been a false move, or it’s just another step in consolidating the rally off the June lows. The group once again sets up for a trade that has a good risk/reward setup. Long-termers can continue to nibble at this sector that has the look of a BEAR to BULL reversal. Serial underperformers can become serial outperformers and given time I believe that is what we will see with this group. Patience is required. I remain Long.
Technology
The 10-year treasury and the US dollar both reversed their uptrends, and the headwinds became near-term tailwinds for the market, especially Tech stocks. That pushed the Technology ETF (XLK) into a quick rally that stalled out this week.
Semiconductors Sub-Sector
The semiconductor ETF (SOXX) was under severe selling pressure during the move to new market lows in October. What usually occurs during any rebound, the groups that have been beaten down are the same ones that post the largest rebounds. When the rubber is stretched to extremes the snapback is usually significant.
Some of the gains we have seen in semiconductor stocks recently are unbelievable. As of the middle of this week, the Semiconductor ETF (SOXX) rallied 23% in eight trading days. The 15 largest stocks in the index based on the market cap have all experienced double-digit moves, and four were up over 20%.
While the short-term gains have been amazing, coming back to reality, all 15 of those stocks are still down YTD, and most are down sharply. Texas Instruments (TXN) and Analog Devices (ADI) have managed to get by with declines of less than 10% but more than half of the 15 stocks listed are still down over 30% YTD, including AMD which has declined over 50%. NVIDIA (NVDA) and Taiwan Semiconductor (TSM) are both down over 40%.
Unfortunately, it is hard to gauge what this all means. When we see these types of gains in such a short period of time it can lead to more strength and outperformance OR lead to a quick and vicious pullback that keeps the BEAR trend in place.
In my view, a period of consolidation would be the preferred path now. The more parabolic the move the higher the probability that it dissolves quickly. We started to see some of that recently, but a shallow 1% pullback this week indicates the group still has some buyers.
Savvy investors were treated to a swing trade that was initiated in the semiconductor group that has produced solid returns. Profits have been taken along the way and the remaining stake was closed out with a 20+% gain. Not all short-term moves can be this profitable and no one is claiming that, but one of these large upside trades (documented) makes up for a lot of little mistakes that we all make.
ARK Innovation ETF (ARKK)
From the brink of disaster to renewed strength. What appears to be a false breakdown on the 9th, turned into a 23% two-day rally, that isn’t a typo. Since then the ETF has given back ~11%. In the short term, the only thing I can predict with the ARKK is that it is unpredictable. It does appear that the Base Building, BEAR to BULL reversal that started in June isn’t dead yet.
Cryptocurrency
The fallout from the FTX debacle continues to ripple through the crypto world. While negative headlines seem to be never-ending, Bitcoin and Ethereum have stabilized. The believers (retail investors) will remain entrenched in their notions about this asset and will look to keep cryptos propped up. In the interim, I doubt institutions will be tripping over themselves to add exposure. Given these circumstances, I have decided to take the other side and use the Bitcoin “Short” ETF (BITI) to play this space.
Final Thoughts
If this rally is to continue it will be due to the direction of the 10-year Treasury yield and the US dollar. In both cases, the BULLS need to see them at least stabilize or go lower. It’s a fairly simple relationship now. In the short term, the lower the 10-year Treasury goes the higher the S&P and more so the NASDAQ can go.
The FED and the HOPE trade.
There are many analysts, investors, and market pundits that are citing the rhetoric from the Fed officials as being irresponsible and the cause of pullbacks and market weakness. I’m not here to defend the Fed, but I am here to tell everyone yet again to start dealing with reality.
Investors need to get accustomed to the reality of the situation. Given the present economic backdrop with inflation, the FED is simply being transparent. They are simply telling investors what the backdrop for interest rates looks like going into 2023. This constant chatter from the investment community about pausing, and pivots, all based on sheer speculation is what is misleading and irresponsible. This is what I have referred to as the “hope” trade. Many are hoping inflation is going to recede quickly, hoping the Fed is going to slow down. Hoping that it turns the stock market back into BULL mode.
At the moment there is NOTHING to suggest the Fed funds rate won’t continue to increase because there is nothing that suggests inflation is going to drop off a cliff in the next couple of months. This will remain a fluid situation that is dependent on the data. That data-dependent condition has been conveyed to investors since the START of the hiking cycle. Market participants can continue to complain about the Fed’s comments and actions, but it is a situation that they can’t control.
Investors shouldn’t be positioned for the situation they WANT, they should be positioned for the situation they HAVE.
Postscript
Please allow me to take a moment and remind all of the readers of an important issue. I provide investment advice to clients and members of my marketplace service. Each week I strive to provide an investment backdrop that helps investors make their own decisions. In these types of forums, readers bring a host of situations and variables to the table when visiting these articles. Therefore it is impossible to pinpoint what may be right for each situation.
In different circumstances, I can determine each client’s personal situation/requirements and discuss issues with them when needed. That is impossible for readers of these articles. Therefore I will attempt to help form an opinion without crossing the line into specific advice. Please keep that in mind when forming your investment strategy.
THANKS to all of the readers that contribute to this forum to make these articles a better experience for everyone.
Best of Luck to Everyone!
Be the first to comment