

Oat_Phawat
By David Brady
Despite all the bullish signals, precious metals and miners continued lower this week. I have repeatedly stated that no one should try to catch a falling knife, but instead wait for a break of resistance. This week, I will go through the technical levels I am watching to signal that the bottom is in, and we’re likely off to new record highs. But first, a few comments on the sentiment and positioning.
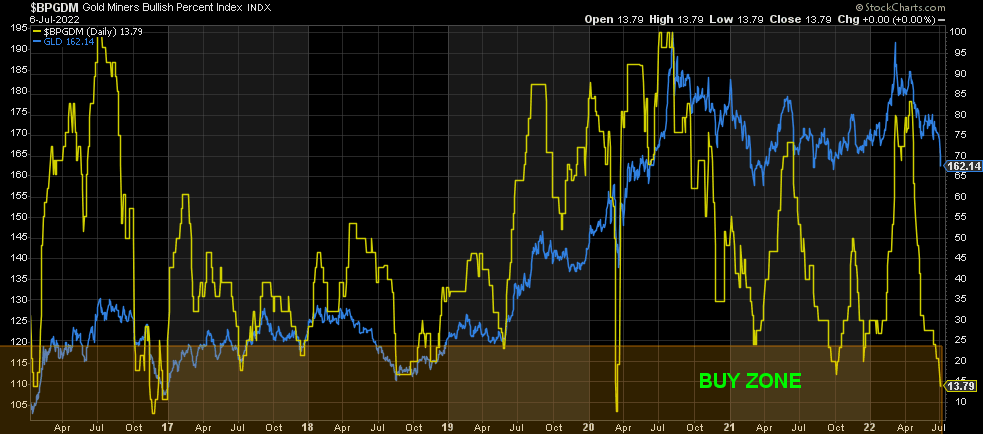
Silver is way more bearish than gold right now, so silver is likely closer to its bottom and will blow past gold once the rally begins. Gold miners, like silver, are extremely bearish and—based on this alone—close to a bottom.
Sentiment is a contrarian indicator, so this is bullish going forward. Price could fall a little lower, but we’re approaching levels of bearishness consistent with March 2020 and December 2016 when gold was at 1124.
COT positioning is also bullish for both gold and silver.
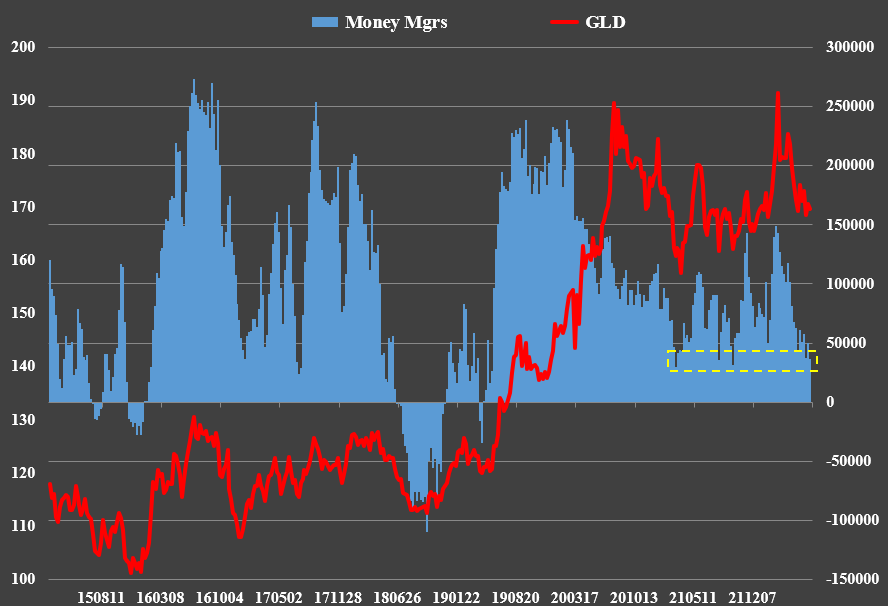
Funds still have a net long position consistent with those at 1675 in gold.
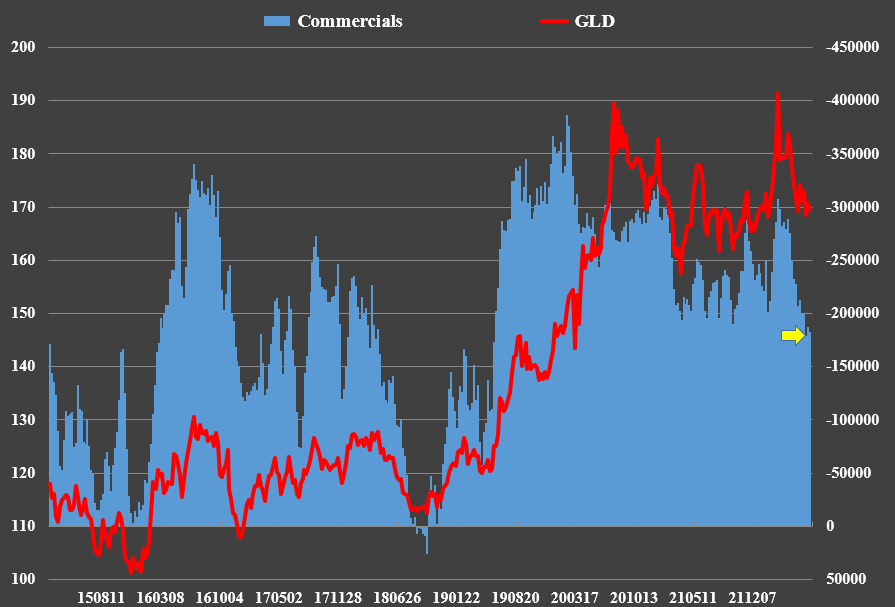
Commercials continue to have their lowest short position since June 2019 when gold was still below 1377 resistance.
This doesn’t mean that the banks can cut their shorts further or funds can go short, but it is bullish as it stands.
Silver is even more bullish, consistent with its bearish sentiment. Remember, bearish sentiment is bullish.
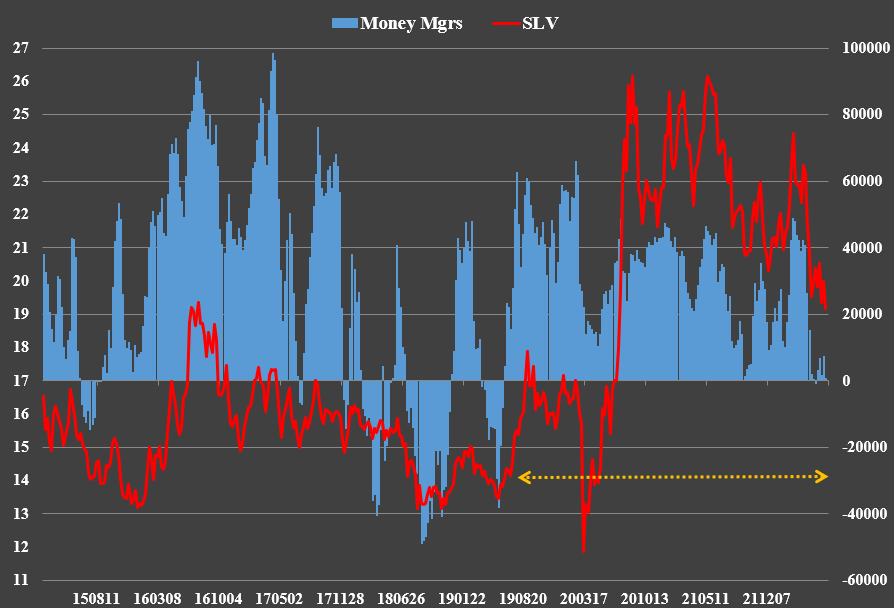
Funds are near neutral. The last time they were neutral was when silver was at 14 in June 2019.
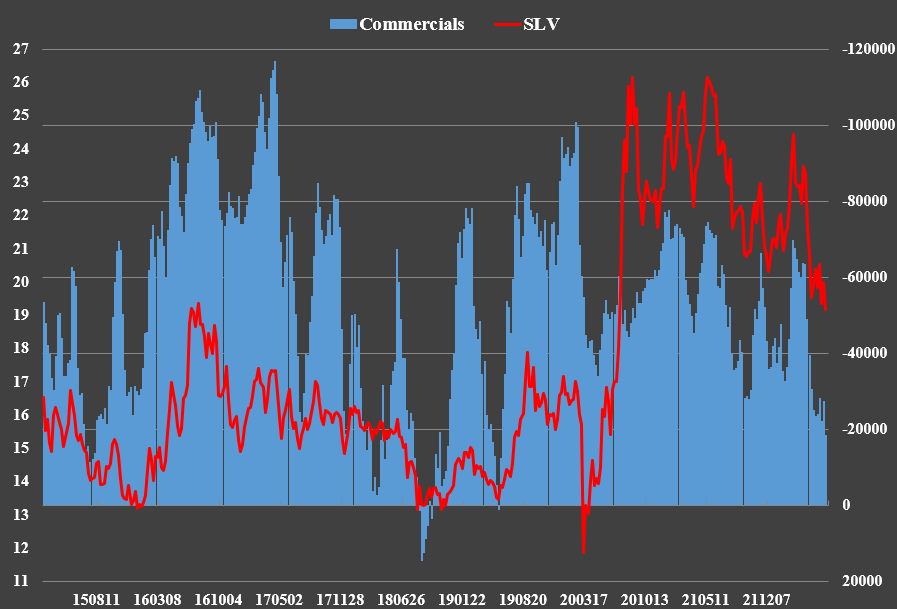
Commercials have their lowest short positioning since June 2019 also.
Again, funds could go short and commercials long before we’re done, but this is very bullish on the face of it.
Technicals
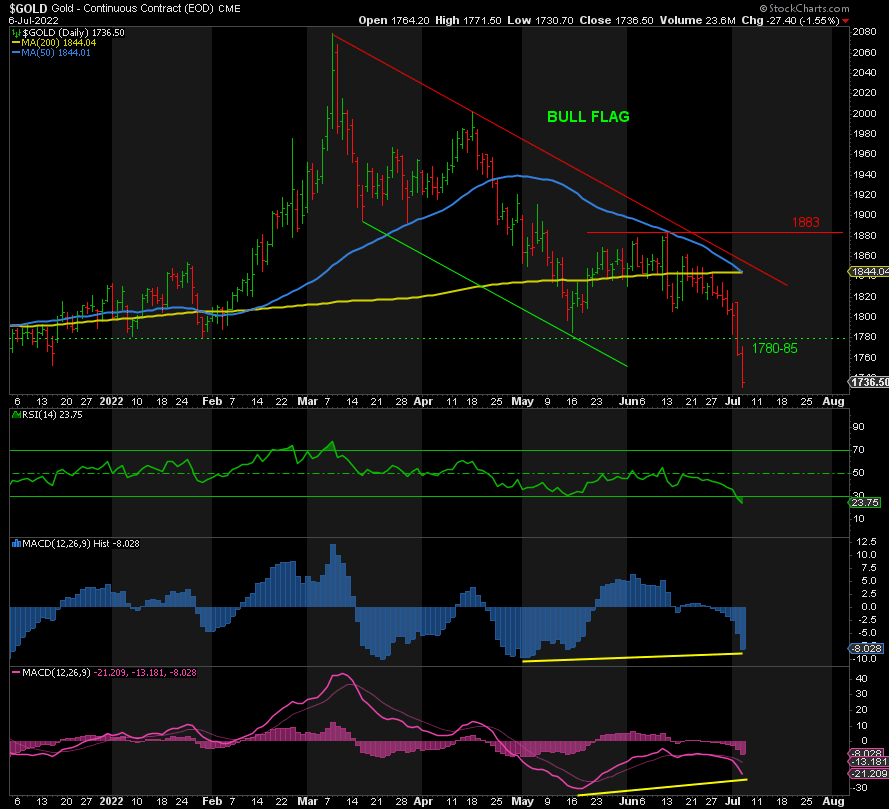
Gold accelerated to the downside over the past two days, and it’s now at its most oversold since August 2018 when gold was at 1167. While it’s not a positively divergent lower low per the RSI, it is according to both MACDs. This is bullish.
But rather than trying to catch a falling knife, ideally I would want to see a move back to 1785 followed by a higher low and then a break of 1785 to signal that the trend has changed to the upside. A break of 1883 would confirm the low is in, in my opinion.
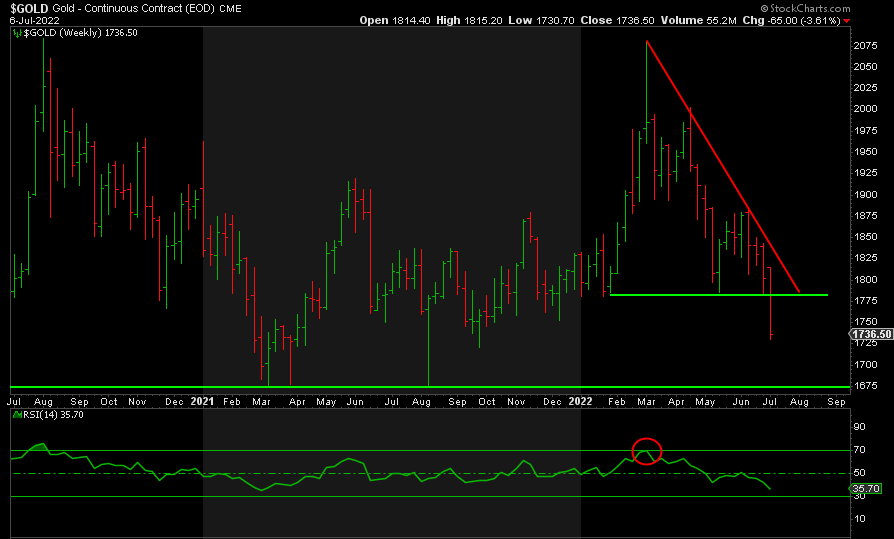
The weekly chart has broken prior support, but the weekly RSI is closing in on 30. It doesn’t need to get there, as we saw at 1675, but it would be another powerful signal that the low is in or close.
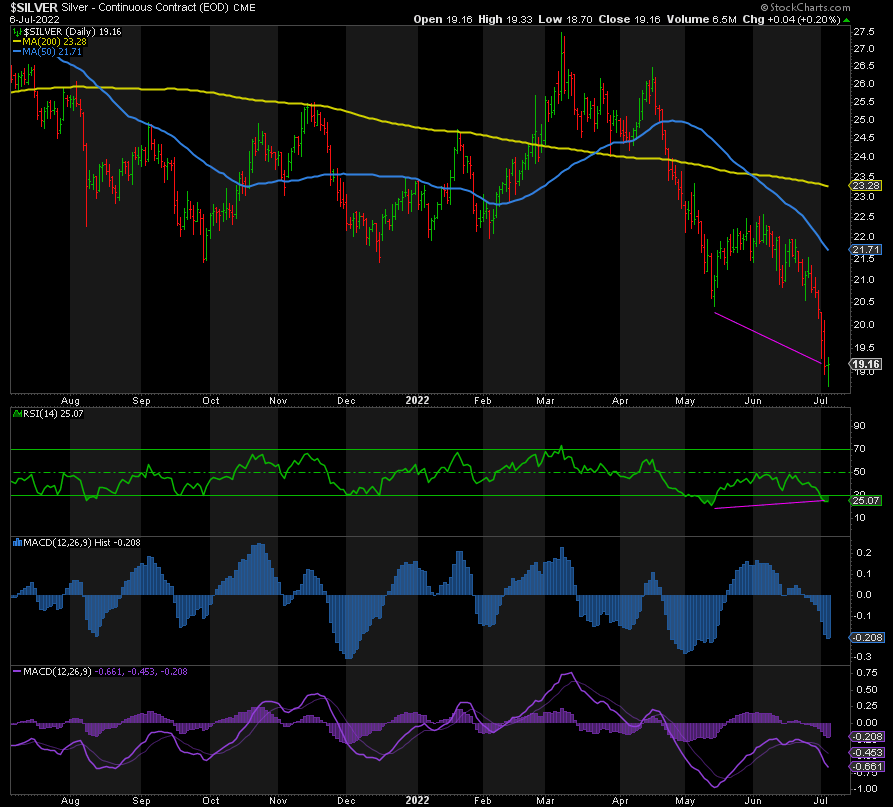
While silver had a positively divergent lower low on Tuesday across all indicators, and it rebounded nicely off its lows on Wednesday, we need to see how far this gets to the upside. Once we get there, we need a higher low followed by a higher high to consider the rally to new highs has begun. Only a close above 22 and a break of 22.57, the prior high, would signal that the low is in. Until then, lower lows are still possible. But there isn’t much further to go on the downside in silver based on the data in hand.
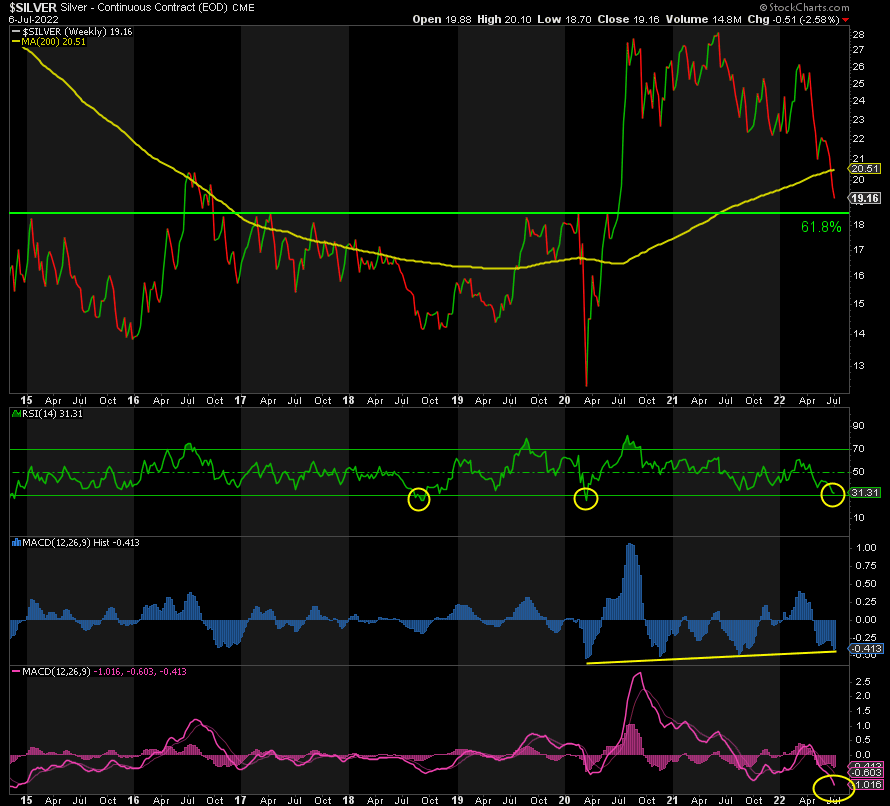
The Weekly Close chart above shows silver approaching key support around 18.50. It was key resistance on the way up, tested six times since 2015. It is also the 61.8% Fib of the entire rally from March 2020 to June 2021. The RSI is near 30. The last time it went down just below 30 was when it hit 11 in March 2020. That’s how oversold it is. In addition, the MACD Histogram is positively divergent down here and the MACD Line is at its lowest level since December 2015. As I have been saying, all the conditions are in place for a spectacular rally to come—all but the fundamentals. We’re still waiting on the Fed’s 180.
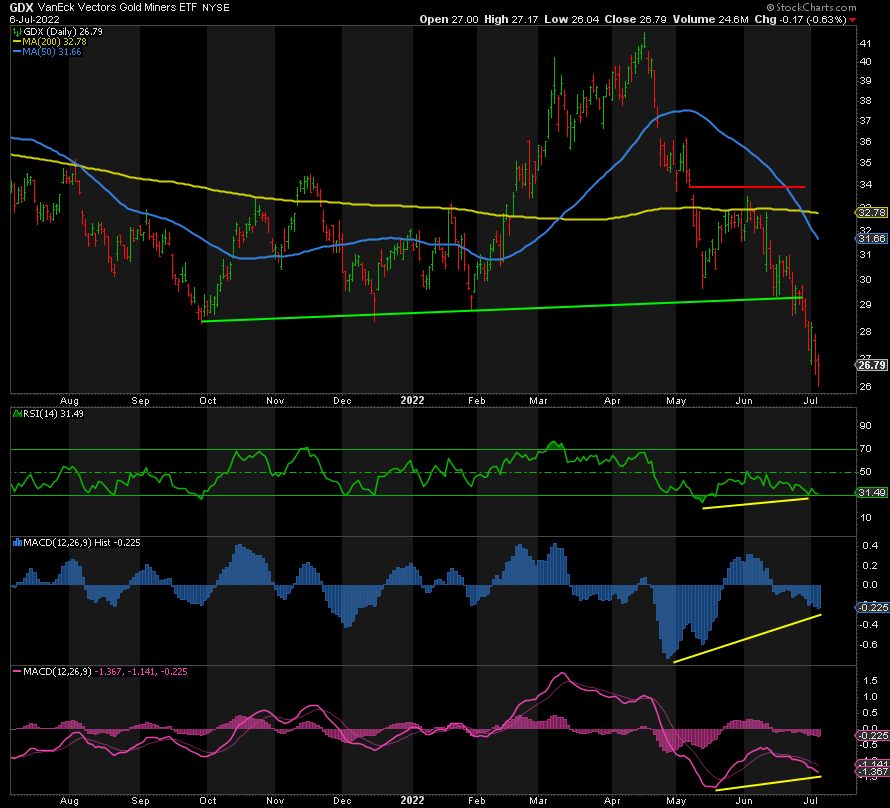
GDX has been hammered since it broke support, but it is extreme oversold and positively divergent across all indicators. It could go a little lower yet and remain positively divergent, but the low is close based on the data. As before, we need to get a bounce and then a higher low followed by a higher high to consider the low is in. A break of 33.50 would confirm it, in my opinion.
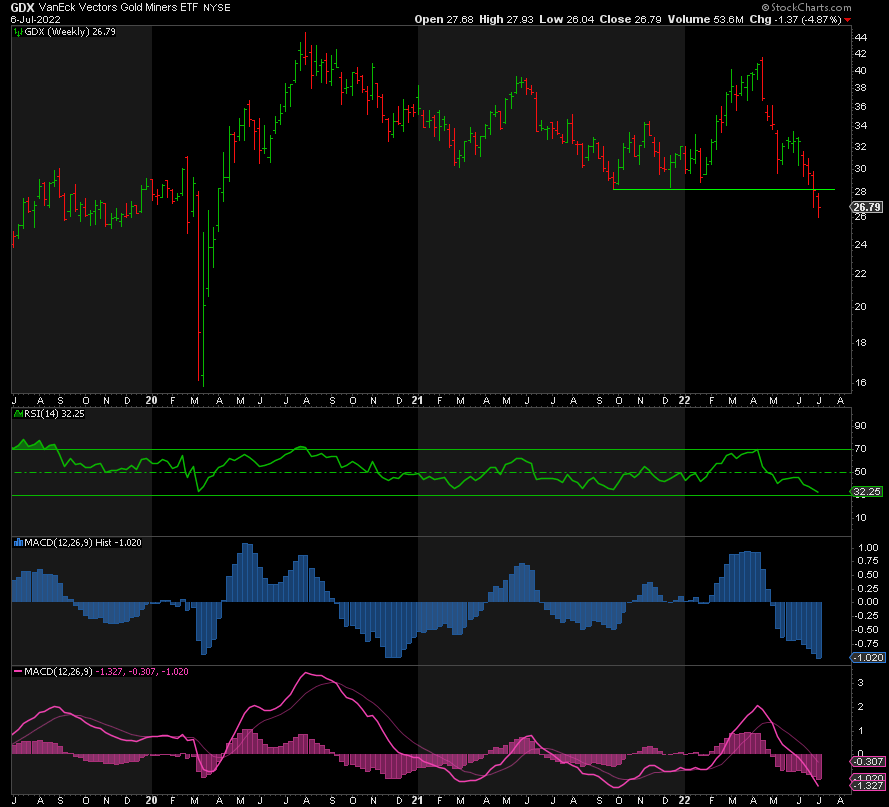
The weekly chart also shows just how oversold GDX is on the RSI and both MACDs. The last time the RSI was this low was in March 2020. We know what happened next. Look up.
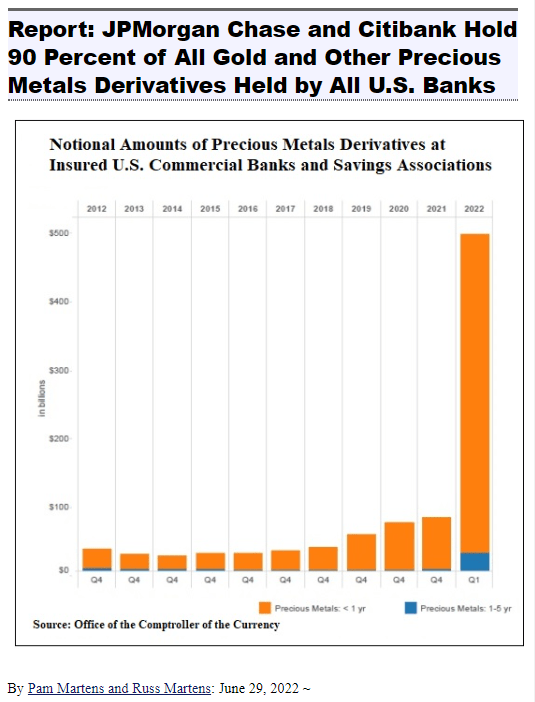
Given all the data in hand, we should expect a bottom soon and a massive rally to follow. But there are two caveats to that: We’re still waiting on the Fed’s 180 or a signal that it is coming, and we have to contend with these guys:
Hence, I must emphasize waiting for the trend to turn up and key resistance to be taken out before loading up on metals and/or miners. Only then can we have a high degree of confidence that the low is in. But based on the data to this point, the final low is not far away, especially in silver and the miners. It’ll be worth the wait, as it was in December 2015, December 2016, August 2018, and March 2020.
Editor’s Note: The summary bullets for this article were chosen by Seeking Alpha editors.
Be the first to comment