

Justin Sullivan
By Nicholas Grous, Associate Portfolio Manager; and Andrew Kim, Research Associate
According to ARK’s open-source research and model, Roku’s (ROKU) stock price could approach $605, compounding at an annual rate of 53% during the next five years.[1]
Based on our assessment of 75th and 25th percentile outcomes, our bull and bear cases are $1,493 and $100 per share, which would deliver annualized returns of 88% and 3%, respectively, as shown below.
As with our open-source Tesla (TSLA) and Zoom (ZM) models, we are publishing our open-source Roku model to strengthen the quality of our research. By sharing our assumptions and modeling methodologies, we hope to solicit constructive feedback and criticism. Like open-source software, we believe that open-source research will be more robust and accurate than research conducted and published non-transparently behind closed doors.[2]
Roku, Inc. Price Targets: Expected (Base), Bear, and Bull Cases Per Share
| ARK’s Simulation Outputs | ARK’s 2026 Price Estimate (Per Share) | Significance |
|---|---|---|
| Expected Value (Base Case) | $605 | Based on our assumptions, our expected value or base case is that Roku’s stock price will hit $605 per share in 2026. |
| Bear Case | $100 | Based on our assumptions, we attach a 25% probability that Roku could be worth $100 per share or less in 2026. |
| Bull Case | $1,493 | Based on our assumptions, we attach a 25% probability that Roku could be worth $1,493 or more in 2026. |
Source: ARK Investment Management LLC, 2022.
For the benefit of readers, this article presents “base,” “bear,” and “bull” cases as a way of contextualizing the meaning of our 2026 share price expectations. Methodologically, we arrive at our three price targets through a series of point estimate assumptions for variables that we consider significant to Roku’s business. We consider our bear and bull cases as roughly the 25th and 75th percentile values with respect to the inputs provided. Forecasts are inherently limited and cannot be relied upon as a basis for making an investment decision and are built on our modeling that reflects our biases and long-term positive view of the company. Please see additional disclosures below on forecasts and hypothetical performance. For informational purposes only and should not be considered investment advice, or a recommendation to buy, sell, or hold any particular security.
ARK’s open-source Roku, Inc. model incorporates 33 independent variables, 28 of which vary across the three cases.[3] While display advertising, content distribution, and player should generate meaningful revenue for Roku, we believe video advertising revenue is likely to be the most significant contributor to the company’s growth during the next five years. In our base case, Roku’s revenue increases 39% at an annual rate to reach $14 billion in 2026. In our bear and bull cases, Roku’s revenue increases at annual rates of 5% and 63% to reach ~$4 billion and ~$32 billion, respectively, as shown below.
ARK Investment Management LLC, 2022; Roku, Inc.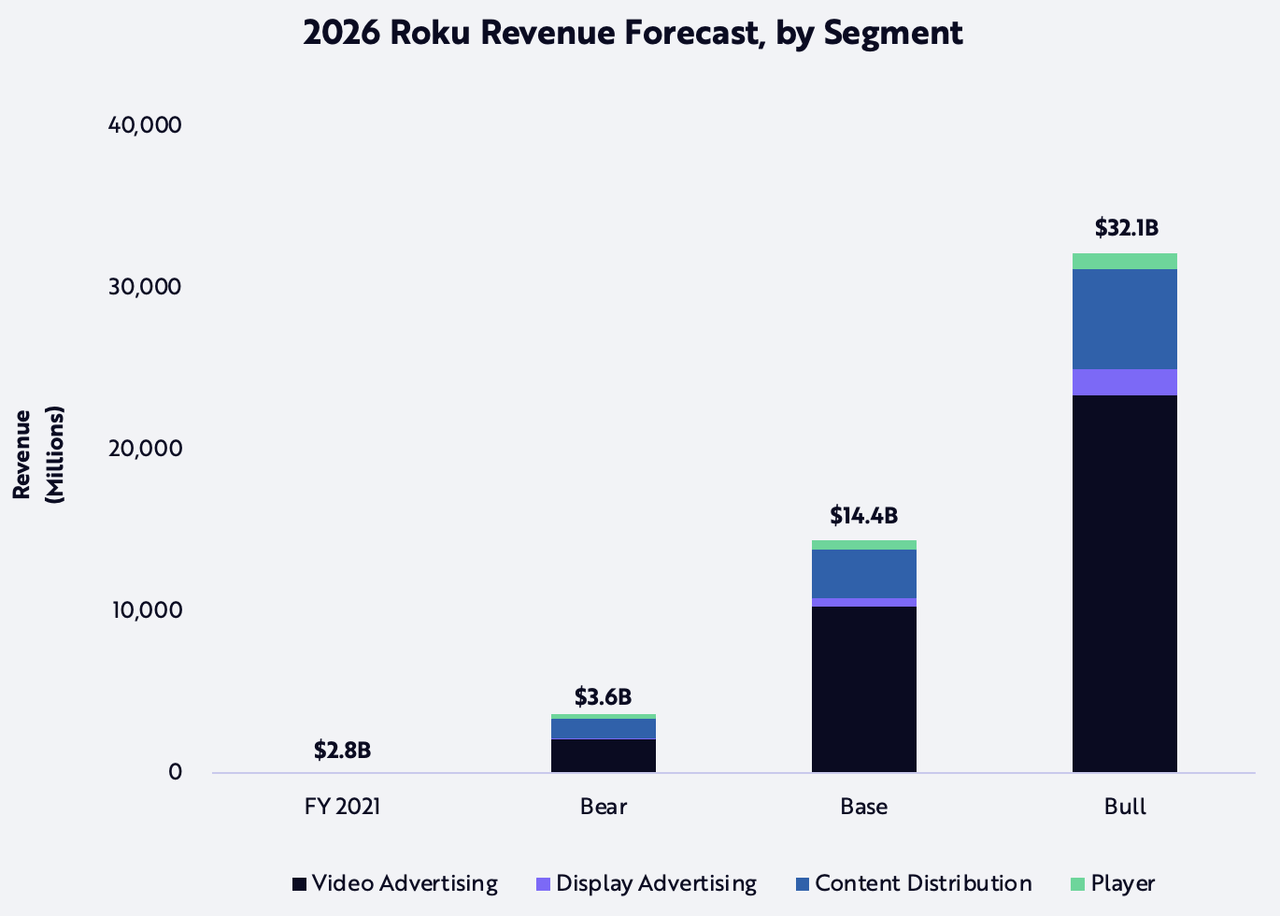
Note: Roku reports its revenues in two primary segments: platform revenue and player revenue. ARK buckets platform revenue into four sub-categories. Third-party video advertising, first-party video advertising and The Roku Channel, display advertising, and content distribution result in total platform revenue, while player revenue is a stand-alone revenue segment. Forecasts are inherently limited and cannot be relied upon as a basis for making an investment decision and are built on our modeling that reflects our biases and long-term positive view of the company. Please see additional disclosure below on forecasts and hypothetical performance. For informational purposes only and should not be considered investment advice, or a recommendation to buy, sell or hold any particular security.
According to our research, Roku is the #1 streaming TV platform as measured by hours streamed in the United States, Canada, and Mexico, and is poised to become the dominant purpose-built TV operating system connecting consumers, content providers, and advertisers. In this article, we provide details behind our open-source Roku model for the next five years.
We divide the remainder of our article into five sections:
- Example Bear, Base, and Bull Cases
- Key Model Inputs
- Total Addressable Market
- Roku’s Business Model
- Business Opportunities Not Included in The Model
Example Bear, Base, and Bull Cases
For further context on the model assumptions that influence our forecast in each of the three scenarios, the table below presents the inputs and outputs that we believe capture Roku’s potential positioning and execution.
| Input / Output [*] | 2021 Actual [**] / ARK Estimates | Example Bear Case 2026 | Example Base Case 2026 | Example Bull Case 2026 |
|---|---|---|---|---|
| Global Households with Connected TVs (CTVs) | 739M | 1,175M | 1,253M | 1,331M |
| Roku Active Accounts | 56M | 117M | 157M | 186M |
| Daily Hours Streamed on Roku per Active Account | 3.6 | 4.0 | 4.5 | 4.8 |
| % of Hours Streamed on AVOD Platforms [***] | 25% | 28% | 35% | 43% |
| Gross Platform Monetization Rate per Hour [****] | $0.13 | $0.11 | $0.21 | $0.38 |
| Net Platform Monetization Rate per Hour [*****] | $0.03 | $0.02 | $0.05 | $0.10 |
| Total Revenue (Millions) | $2,765 | $3,609 | $14,410 | $32,118 |
| Gross Margin | 51% | 38% | 59% | 67% |
| Adjusted EBITDA Margin [******] | 17% | 19% | 29% | 33% |
| Unlevered Free Cash Flow Margin | 12% | 10% | 15% | 17% |
| Enterprise Value / EBITDA | 30x [*******] | 20x | 20x | 20x |
| Market Cap (Billions) | $13 [********] | $17 | $93 | $230 |
| Share Price and CAGR | $96 [*********] | $100 (3%) | $605 (53%) | $1,493 (88%) |
Source: ARK Investment Management LLC, 2022.
*Note: All figures are rounded to the displayed first digit and are consistent with reasonable variance in the forecast. **Note: Under the 2021 Actual / ARK Estimates column, Global Households with Connected TVs (CTVs) and % of Hours Streamed on advertising-based video-on-demand (AVOD) Platforms are based on ARK research. All other figures within the mentioned column are provided by Roku public filings and investor materials. ***Note: This figure estimates the percentage of Daily Hours Streamed on Roku per Active Account allocated to watching via AVOD platforms, such as ad-based Amazon Prime Video, ad-based Hulu, and others. This figure combines both third-party AVOD platforms and The Roku Channel, Roku’s first-party AVOD platform, which provides both original content and third-party ad-supported or subscription-based channels, so-called Premium Subscriptions. ****Note: To calculate gross platform monetization, we sum all gross revenue before applying Roku’s take rate and/or inventory share, which includes platform revenue. We divide this figure by total hours streamed to arrive at a monetization rate, or cost per hour streamed, that aligns with our conviction in Roku’s ability to monetize its opportunity set in 2026. *****Note: Net platform monetization rate entails the same calculation required to assess gross platform monetization rate after adjusting for Roku’s inventory share and/or take rates. In other words, we arrive at net platform monetization rate by dividing projected platform revenue by projected total hours streamed. This figure, in our opinion, corresponds to Roku’s ability to monetize its opportunity set while accounting for operational efficiency and aptitude in contract negotiation. ******Note: We calculate adjusted EBITDA by adding back both COGS-related and Operating Expense-related stock-based compensation expense. *******Note: Earnings before interest, taxes, depreciation, and amortization (EBITDA). Current EV / EBITDA is as of May 27, 2022, at market close. ********Note: Current market capitalization is as of May 27, 2022, at market close. *********Note: Compound Annual Growth Rate (CAGR). Current share price is as of May 27, 2022, at market close. Forecasts are inherently limited and cannot be relied upon as a basis for making an investment decision and are built on our modeling that reflects our biases and long-term positive view of the company. Please see additional disclosure below on forecasts and hypothetical performance. For informational purposes only and should not be considered investment advice, or a recommendation to buy, sell or hold any particular security.
Key Model Inputs
While our open-source model incorporates 33 independent variables that could impact Roku’s valuation, this section presents what our research suggests will be the four most important drivers: active accounts, daily hours streamed on Roku, percent of hours streamed on ad-supported video-on-demand (AVOD) platforms, and gross and net platform monetization rates.
Active Accounts
We approximate the number of Roku households using a metric called “Active Accounts,” the number of accounts that have streamed content via Roku in the last 30 days. Through strong execution in international business expansion, product innovation, and business diversification, Roku has increased active accounts 34% at a compound annual rate during the past five years, from 14 million in early 2017 to 61 million during the first quarter of 2022, as shown below.[4][5]
ARK Investment Management LLC, 2022; Roku, Inc.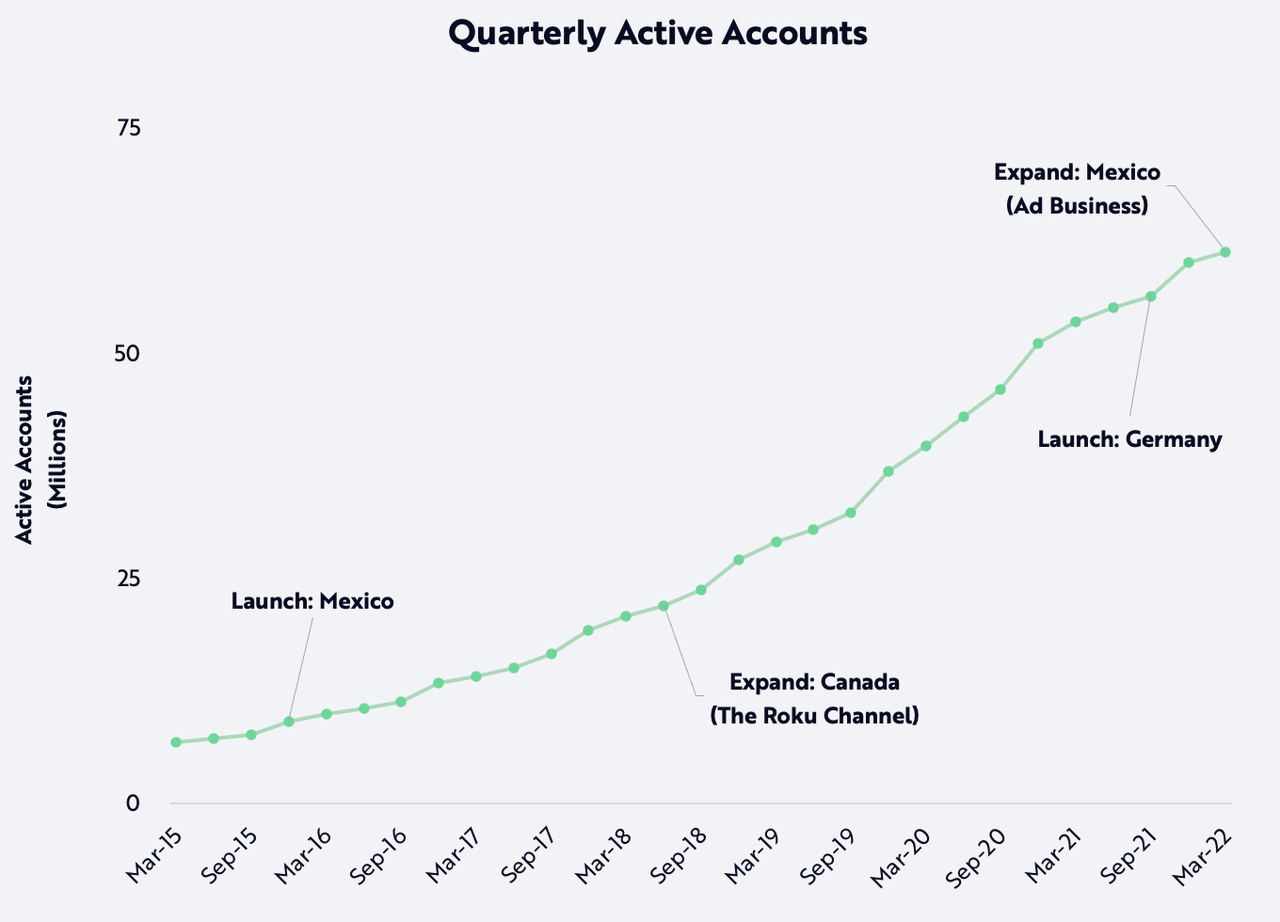
Forecasts are inherently limited and cannot be relied upon as a basis for making an investment decision and are built on our modeling that reflects our biases and long-term positive view of the company. Please see additional disclosure below on forecasts and hypothetical performance. For informational purposes only and should not be considered investment advice, or a recommendation to buy, sell or hold any particular security.
After launching its streaming player in Mexico in October 2015, Roku became the top TV streaming platform based on total hours streamed in only six years.[6][7] Although its market leadership in Canada took longer, Roku has dominated the local connected TV (CTV) market wherever it has expanded.[8][9] Our base case assumes that Roku will continue its track record of strong execution in its current markets, expand aggressively into new territories with high TV viewership, and grow its active accounts 23% at an annual rate to 157 million in 2026, as illustrated below. In our bear and bull cases, Roku increases its active accounts at 16% and 27% annual rates, reaching 117 million and 186 million active accounts, respectively, in 2026.
ARK Investment Management LLC, 2022.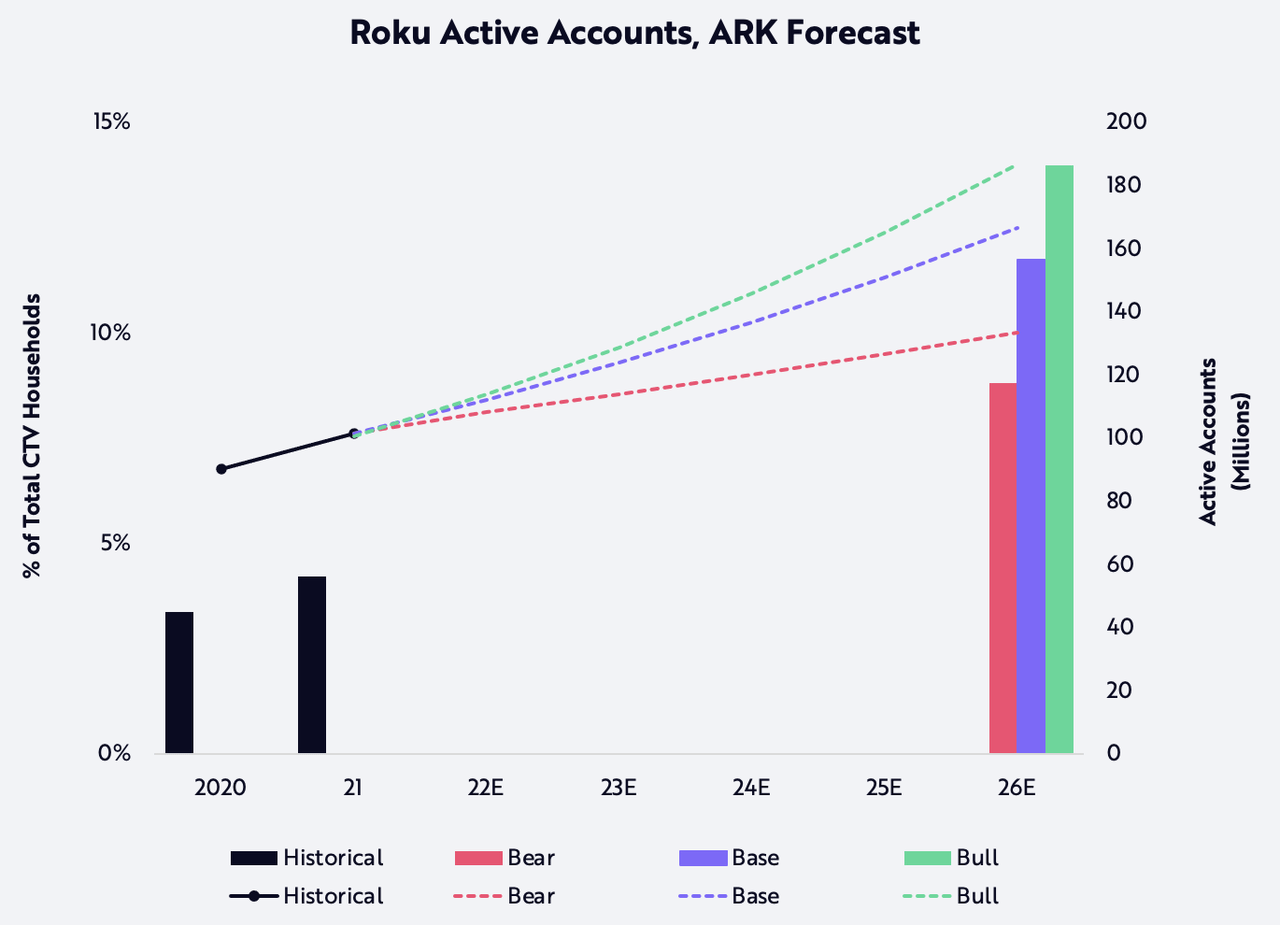
Forecasts are inherently limited and cannot be relied upon as a basis for making an investment decision and are built on our modeling that reflects our biases and long-term positive view of the company. Please see additional disclosure below on forecasts and hypothetical performance. For informational purposes only and should not be considered investment advice, or a recommendation to buy, sell or hold any particular security.
Daily Hours Streamed on Roku
According to Nielsen’s March 2021 Total Audience Report, US adults spent ~3.7 hours a day on average watching linear TV during the third quarter of 2020, down nearly 14% from 4.3 hours during the third quarter of 2018.[10] eMarketer estimates that linear TV viewing dropped another 12% year-over-year to 3.3 hours in 2021.[11] Nielsen and eMarketer report data on a per-person basis while Roku discloses average daily hours streamed per Active Account, so the available metrics do not allow for an “apples-to-apples” comparison. As a result, we use “Active Accounts” as a proxy for the number of Roku households. Assuming at least one person per active account chooses to watch Roku, daily hours streamed per Active Account should exceed daily hours streamed per individual in a household. Our research shows that on average in 2021 Roku Active Accounts streamed 3.6 hours per day, slightly more than the 3.3 hours of linear TV viewed per person.[12] The small gap between these two different metrics indicates not only that Roku has significant room to grow total streamed hours but also that linear TV could lose many more viewing hours. In the next chart, we detail our base, bear, and bull case projections for Roku’s daily average household viewing hours.
ARK Investment Management LLC, 2022; The Nielsen Company LLC; Insider Intelligence, Inc.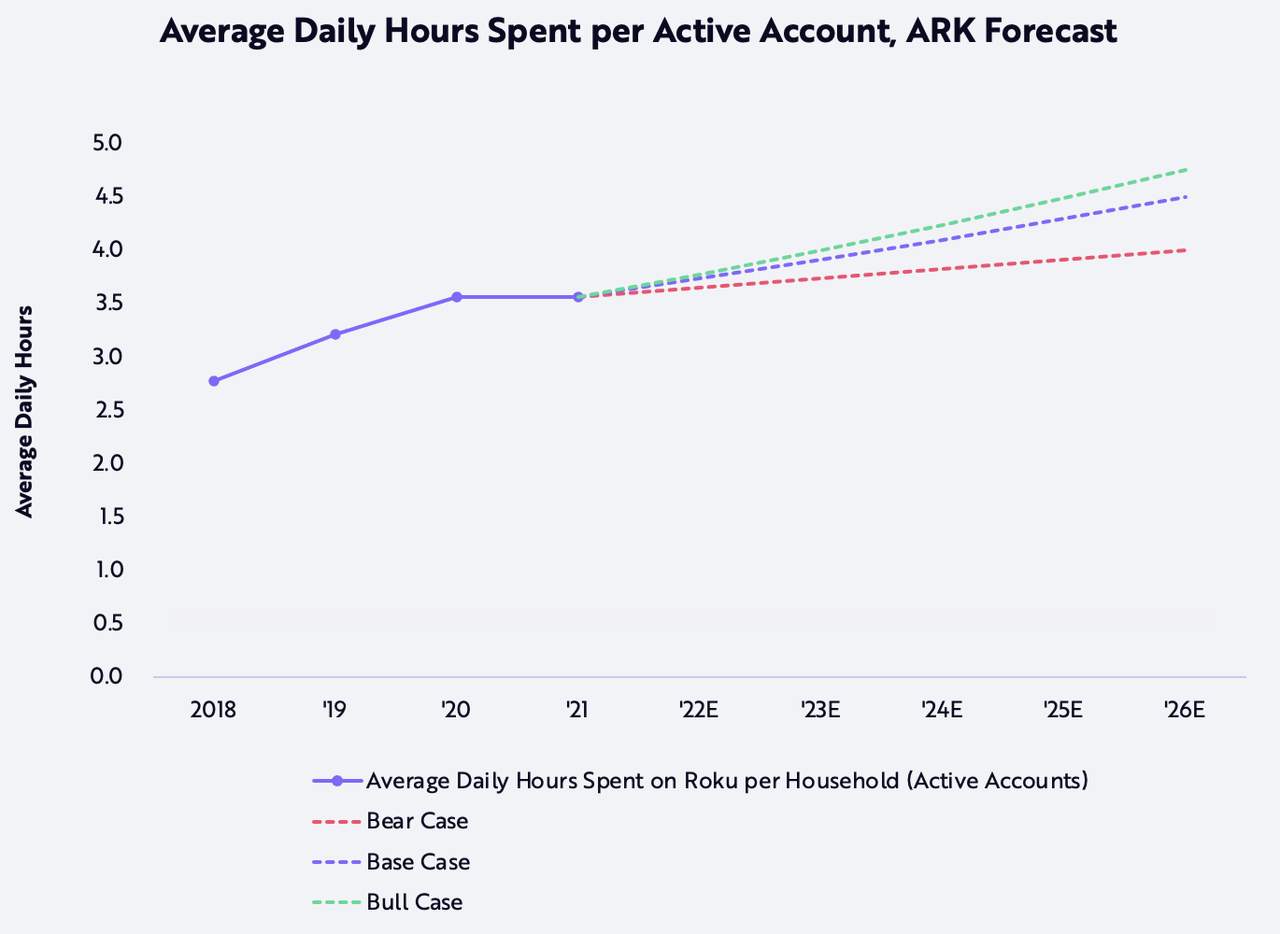
Forecasts are inherently limited and cannot be relied upon as a basis for making an investment decision and are built on our modeling that reflects our biases and long-term positive view of the company. Please see additional disclosure below on forecasts and hypothetical performance. For informational purposes only and should not be considered investment advice, or a recommendation to buy, sell or hold any particular security.
In our base case, the average time spent daily on Roku per Active Account will grow at a nearly 5% annual rate from 3.6 hours per day in 2021 to 4.5 hours in 2026. In our bear case, we assume 2% annualized growth to 4 hours in 2026. In our bull case, we project that average time spent will increase 6% at an annual rate to 4.8 hours a day. We believe that our assumptions are conservative, as the associated forecasts on a per-Active Account basis remain comparable to linear TV viewership on a per-individual basis pre-2020.[13][14]
Percent of Hours Streamed on AVOD Platforms
As noted above, we believe that video advertising is and will remain Roku’s primary revenue stream. Our model breaks video advertising into two revenue lines: (1) third-party ad inventory on advertising-based video-on-demand (AVOD) platforms in Roku’s app store, and (2) first-party ad inventory in ad-supported content on The Roku Channel. In our model, we combine both into one category and estimate that the average Roku household allocates 25% of its daily watch time to third-party AVOD platforms and ad-supported content on The Roku Channel. As more subscription-video-on-demand (SVOD) platforms like Netflix, Disney+, and HBO Max roll out ad-supported tiers to expand their userbases, we believe Roku will position itself strategically as an agnostic television operating system (TV OS). With continued investment in original content and partnerships with smaller streaming platforms on The Roku Channel, Roku should be able to increase its households’ allocation of time to AVOD platforms during the next five years, as shown below.
ARK Investment Management LLC, 2022.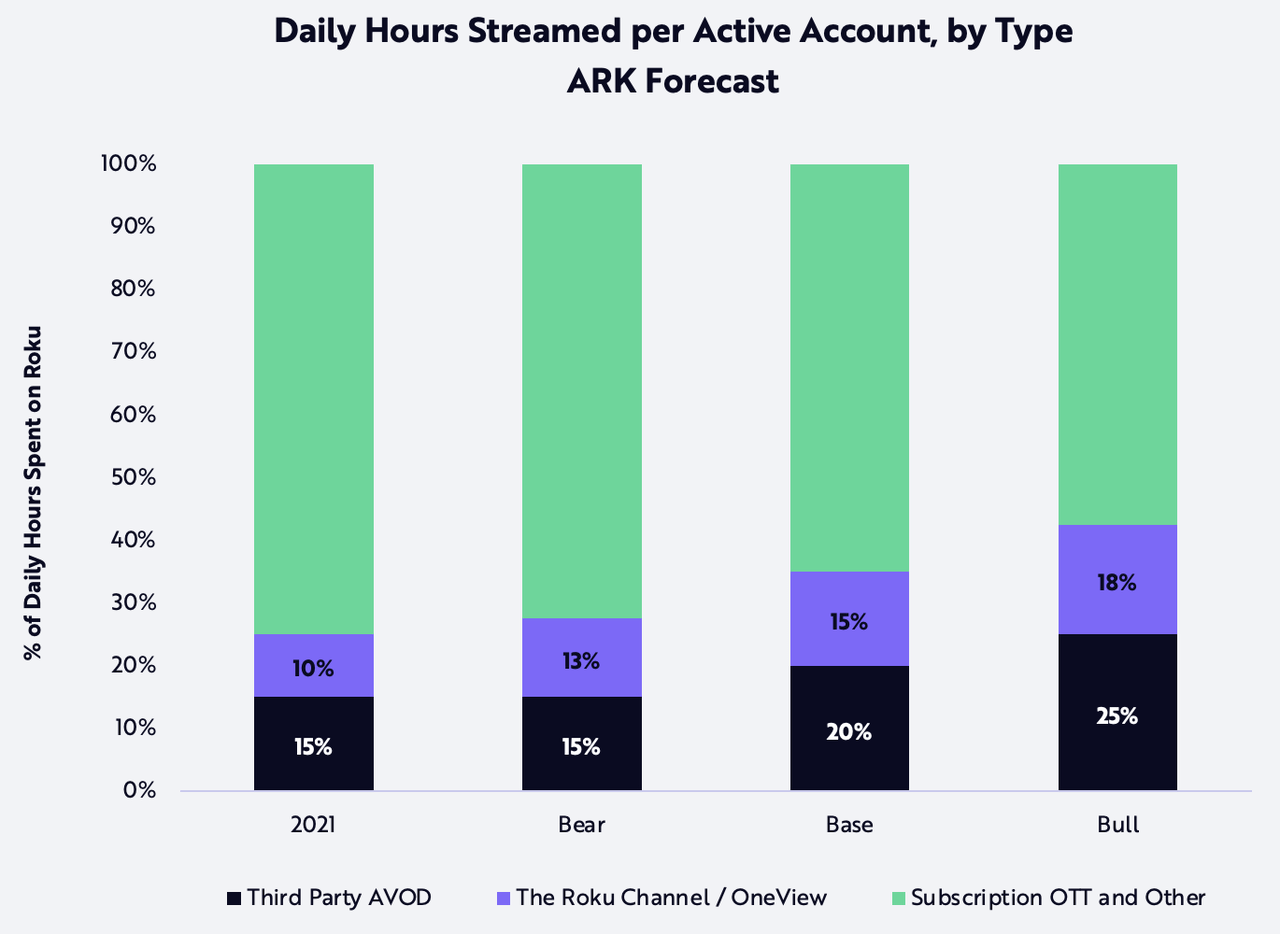
Forecasts are inherently limited and cannot be relied upon as a basis for making an investment decision and are built on our modeling that reflects our biases and long-term positive view of the company. Please see additional disclosure below on forecasts and hypothetical performance. For informational purposes only and should not be considered investment advice, or a recommendation to buy, sell or hold any particular security.
In our base case, Active Accounts will allocate 35% of daily viewing hours to ad-supported content in the Roku ecosystem. In our bear and bull cases, allocations are 28% and 43%, respectively. Given The Roku Channel’s infancy in the ad-supported content market, Roku Active Accounts should attract more third-party AVOD platforms over time.
Gross and Net Platform Monetization Rate
In our view, Roku will contribute to and benefit from advertiser decisions to shift budgets from linear to digital during the next five years. Although mainstream analysis suggests that streamed entertainment is a mature market in the US, we believe that both “over-the-top” (OTT) and CTV have more room to grow. Moreover, its expansion into less mature markets has bolstered our conviction in Roku’s scalability and monetization potential over the next five years.
Roku’s gross platform monetization rate per hour is critical to its model. Though not a direct comparison, linear TV’s indirect monetization rate––or ad spending per hour consumed––in the US approached $0.25 per hour on average from 2015 to 2017, nearly twice Roku’s gross platform monetization rate in 2021, as shown below. In our base case, Roku’s monetization rate will increase 11% at an annual rate during the next five years, from $0.13 in 2021 to $0.21 in 2026, nearing parity with the linear TV monetization rate of $0.24. In our bear case, Roku’s monetization rate declines 3% at an annual rate to $0.11; and, in our bull case, it increases 25% at an annual rate to $0.38, exceeding the historical linear TV monetization rate during the next five years.
ARK Investment Management LLC, 2022; The Nielsen Company LLC; Roku, Inc.; S&P Global Market Intelligence.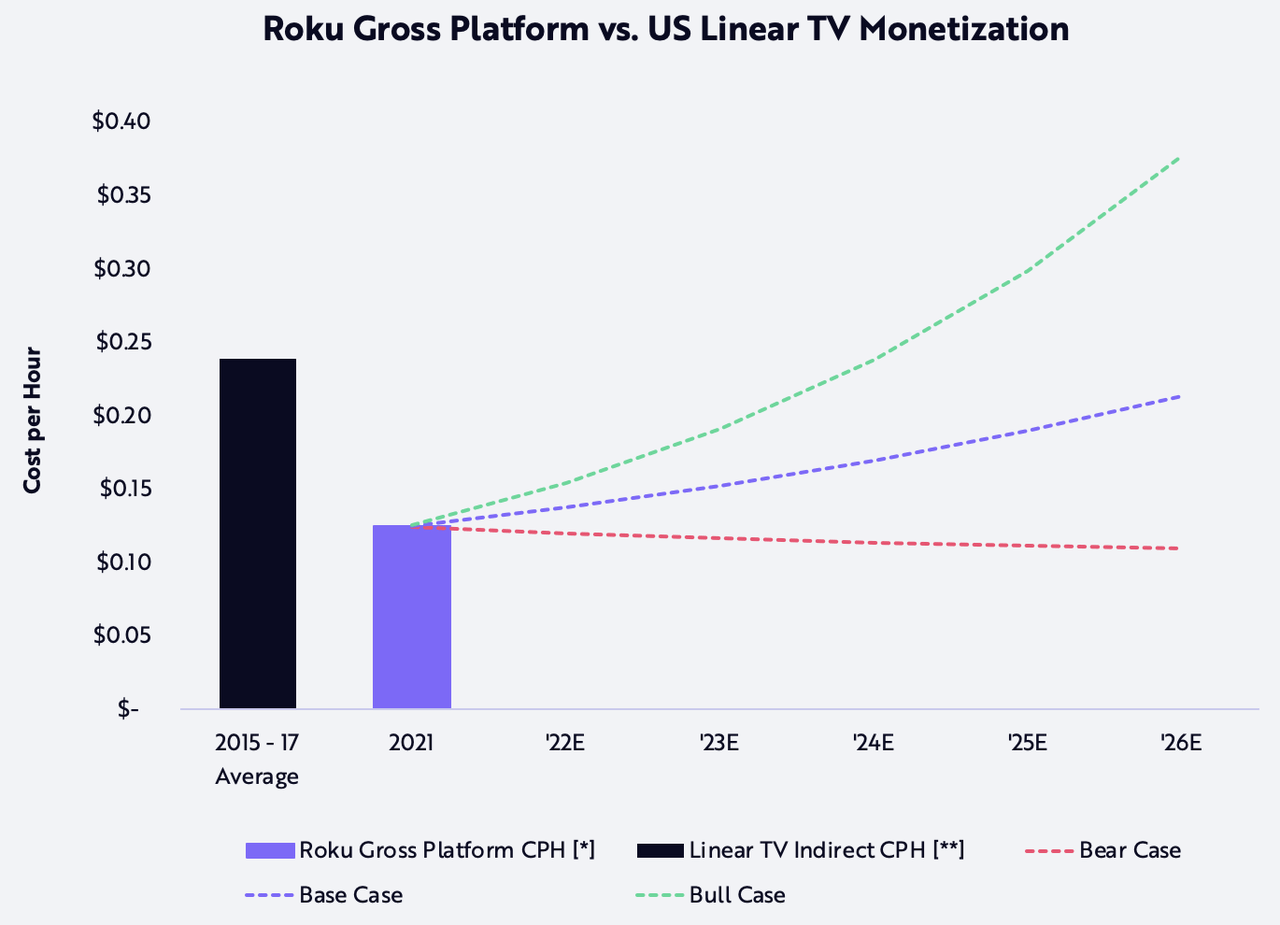
*Note: We calculate Roku’s gross platform cost per hour in a given year by summing our following estimates: gross new SVOD signups that occur through Roku, gross TVOD transactions that occur through Roku, gross new Premium Subscription signups that occur through The Roku Channel, revenue from branded button deals, gross third-party AVOD video advertising revenue before accounting for Roku’s inventory share (or simply assuming 100% inventory share), total display revenue before accounting for Roku’s inventory share, and gross ad spend via OneView. We then take this sum and divide it by our projection of total hours streamed by all Roku Active Accounts. **Note: We calculate linear TV indirect cost per hour in a given year by dividing our estimates for total linear TV ad spend by our estimate for the cumulative number of hours spent watching linear TV by all attributable US households. See ARK Investment Management LLC, 2021 Linear TV and The Cable Box are a Relic of the Past. Forecasts are inherently limited and cannot be relied upon as a basis for making an investment decision and are built on our modeling that reflects our biases and long-term positive view of the company. Please see additional disclosure below on forecasts and hypothetical performance. For informational purposes only and should not be considered investment advice, or a recommendation to buy, sell or hold any particular security.
Total Addressable Market
In our view, CTV platforms pose an existential threat to traditional TV, because OS providers like Roku are likely to displace broadcast and cable companies as the gatekeepers in a burgeoning ecosystem of digital entertainment. Connecting consumers, content providers, and advertisers around the world, Roku should be able to rebuild the TV technology stack on digital rails. Indeed, CTV OS platforms should be able to deliver the scope and scale of content that were not possible with legacy TV.
In 2021, Strategy Analytics estimated that more than 665 million households worldwide –– 34% of all households –– owned a CTV in 2020.[15] According to our estimates, that number is consistent with household penetration of 54% in homes with an internet connection. In our base case, during the next five years, 80% of broadband households will gain access to CTVs while, in our bear and bull cases, 75% and 85% of broadband households, respectively, will gain access, as shown in the chart below.
ARK Investment Management LLC, 2022; International Telecommunication Union; S&P Global Market Intelligence; Strategy Analytics.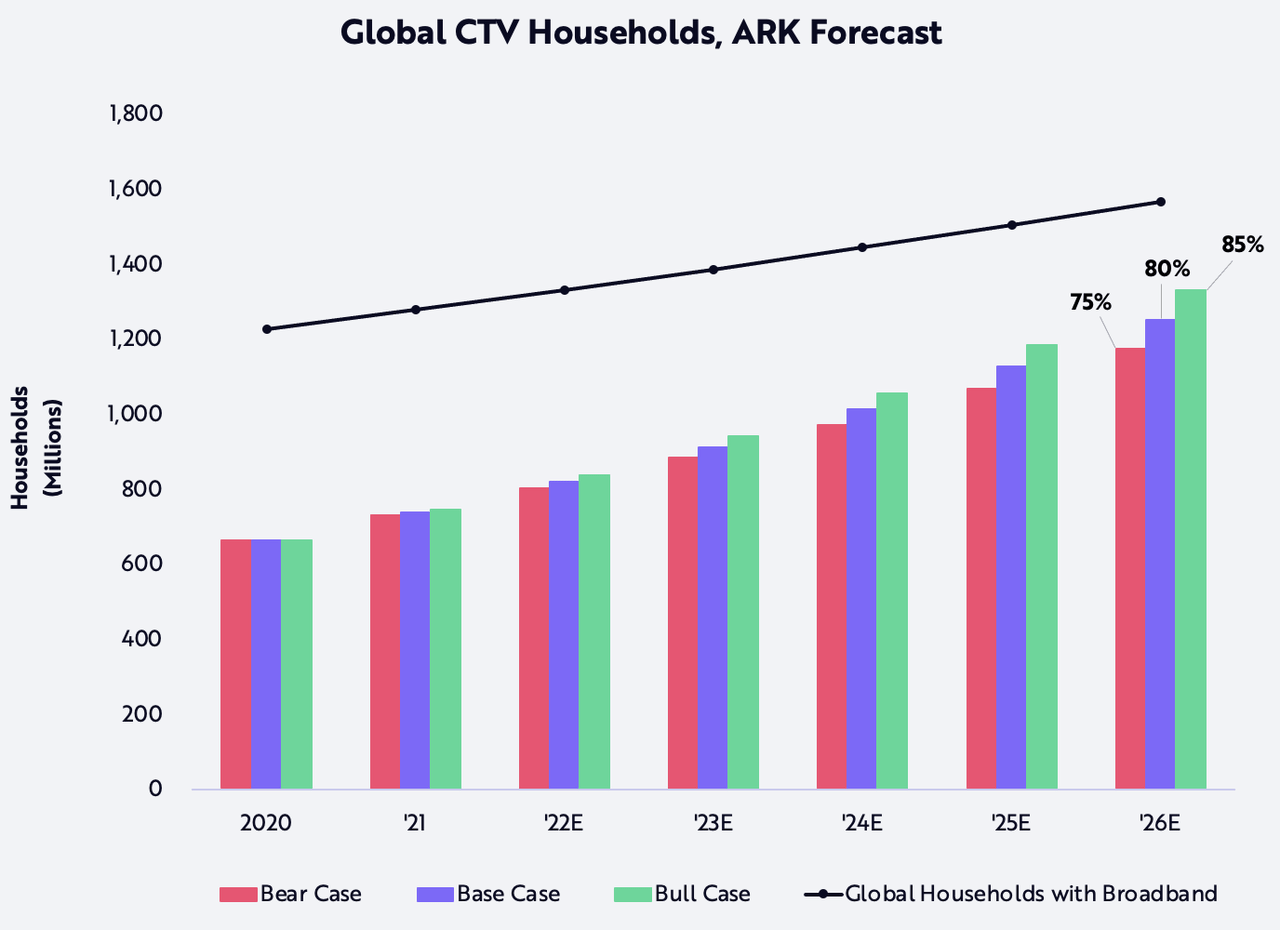
Forecasts are inherently limited and cannot be relied upon as a basis for making an investment decision and are built on our modeling that reflects our biases and long-term positive view of the company. Please see additional disclosure below on forecasts and hypothetical performance. For informational purposes only and should not be considered investment advice, or a recommendation to buy, sell or hold any particular security.
In our base and bull cases, as shown above, more than 1.2 billion households will gain access to CTVs as content shifts from legacy distribution channels to OTT platforms. CTVs should be able to bridge the gap between linear TV and OTT, as consumers who prefer physical TV-viewing access both linear content and streamed entertainment in one OS. While the global linear TV market is relatively mature, its decline in the US could be a harbinger of linear TV disruption worldwide.
Next, we detail the decline of linear TV relative to the rise in CTVs in the US, as shown below. Note that some households have access to both linear TV and CTV and thus are represented in both cohorts.
ARK Investment Management LLC, 2022; S&P Global Market Intelligence; US Census Bureau.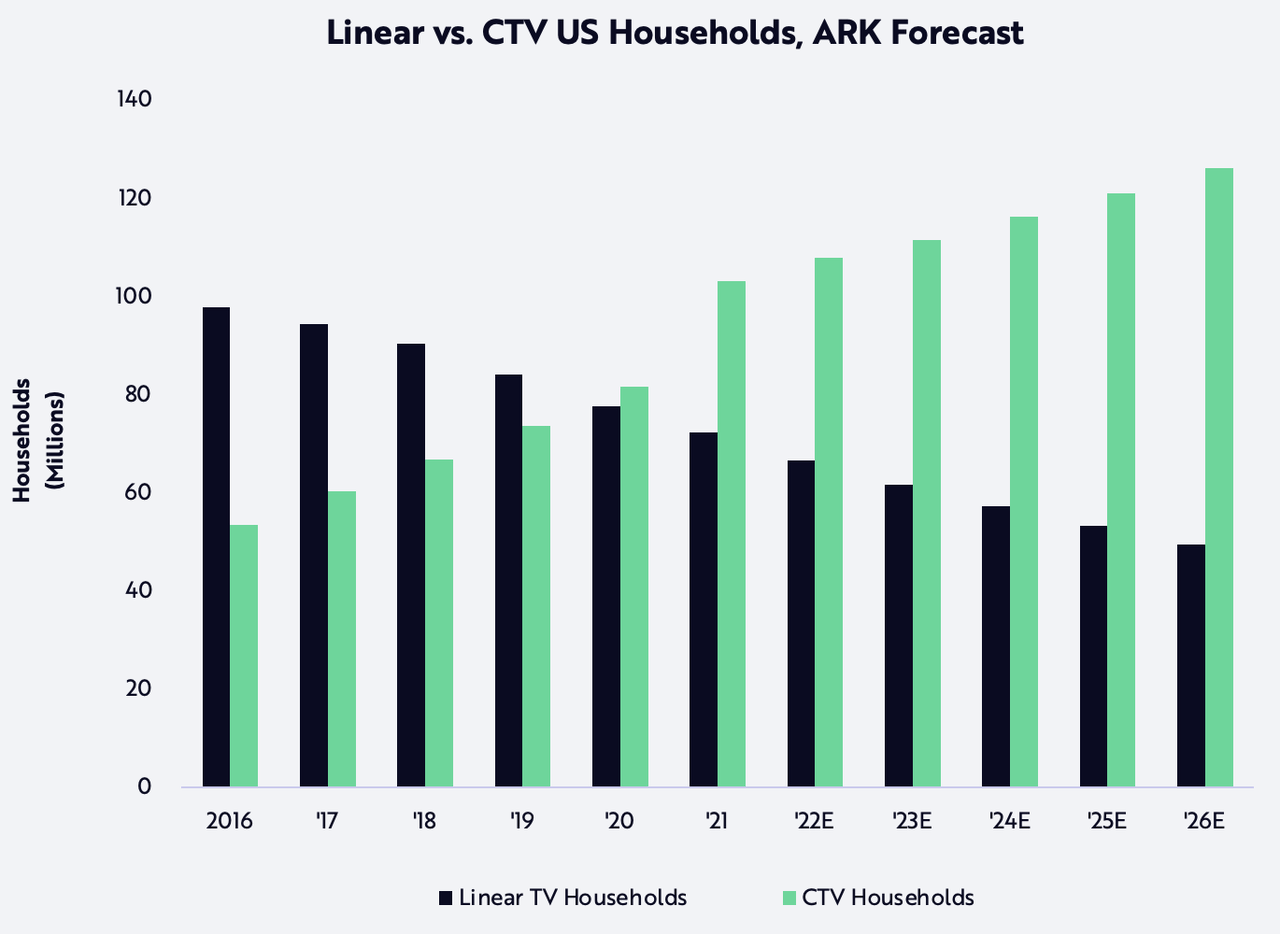
Forecasts are inherently limited and cannot be relied upon as a basis for making an investment decision and are built on our modeling that reflects our biases and long-term positive view of the company. Please see additional disclosure below on forecasts and hypothetical performance. For informational purposes only and should not be considered investment advice, or a recommendation to buy, sell or hold any particular security.
As they seek to improve the TV viewing experience, households are likely to prioritize the purchase of a platform-agnostic OS to access a diverse array of streamed content. As a brand-agnostic intermediary connecting TV viewers to content libraries from a variety of third-party platforms, Roku seems well-positioned to monetize both the global shift from linear TV to CTV and the consumer desire to consolidate content onto one interface.
As of April 2022, US households had consolidated more than 30% of TV viewing time into SVOD platforms like Netflix/HBO Max and AVOD platforms like Hulu/YouTube.[16] While many investors have been pessimistic about the global adoption of OTT,[17] ARK’s research suggests that the OTT market, including its share of digital ad budgets, is early in its adoption cycle. Even the relatively mature US OTT market is enjoying continued increases in streaming adoption[18]: in the year starting May 2021–– when Nielsen began collecting the data––streaming’s share of viewing time increased from 26% to 30%.[19] Meanwhile, the combined US broadcast and cable percentage of viewing hours dropped from 65% to 62%.[20]
Advertising’s shift from linear to digital TV has lagged the consumer’s shift. In Roku’s first quarter earnings call, CEO Anthony Wood reiterated that US audiences spend 46% of their TV time on streaming while advertisers spend only 18% of their TV ad budgets on streaming.[21] Our research suggests that the decline in global linear TV ad spend has just begun: during the last five years, it has declined only 1% at a compound annual rate, from $178 billion in 2016 to $169 billion in 2021, while digital ad spend has increased 19% at a compound annual rate from $182 billion to $439 billion. According to ARK’s research, global linear TV ad spend will shrink 4% at an annual rate during the next five years, from $169 billion to $138 billion, while total digital ad spend grows 14% at an annual rate from $439 billion to $850 billion, as shown below.
ARK Investment Management LLC, 2022; S&P Global Market Intelligence.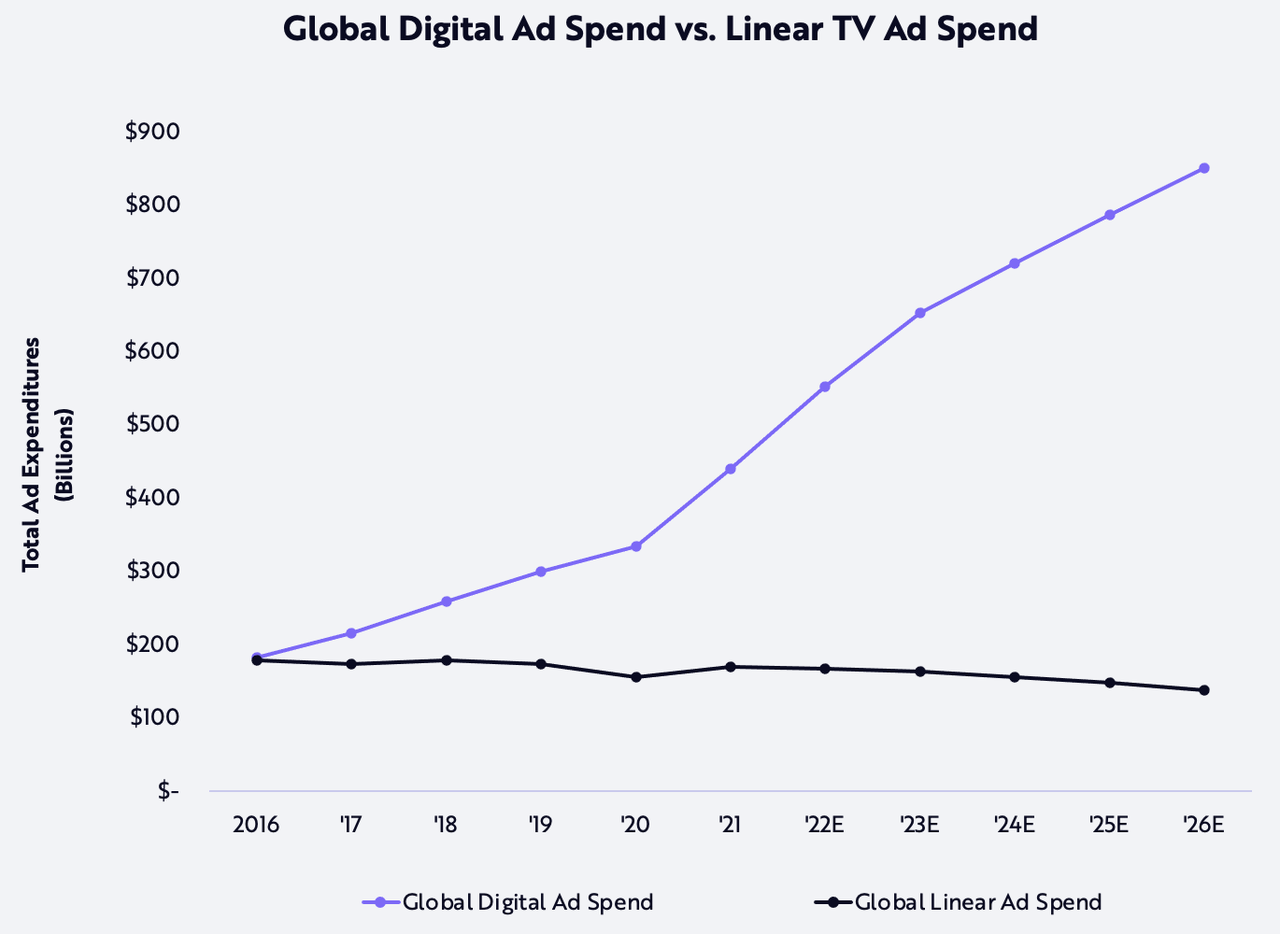
Forecasts are inherently limited and cannot be relied upon as a basis for making an investment decision and are built on our modeling that reflects our biases and long-term positive view of the company. Please see additional disclosure below on forecasts and hypothetical performance. For informational purposes only and should not be considered investment advice, or a recommendation to buy, sell or hold any particular security.
As a content-agnostic OS that serves consumers with any entertainment platform in its app store, Roku should be a prime beneficiary of the shift to digital TV as it monetizes both content and ad inventory on its proprietary ad platform, OneView. In the US, while the number of digital video viewers exceeds that of linear TV, digital TV ad spending accounts for only 6% of total advertising, while linear TV still rakes in 23%, as shown below. Digital ad budgets have significant room to catch up to their legacy counterparts.
ARK Investment Management LLC, 2022; Insider Intelligence, Inc.; S&P Global Market Intelligence.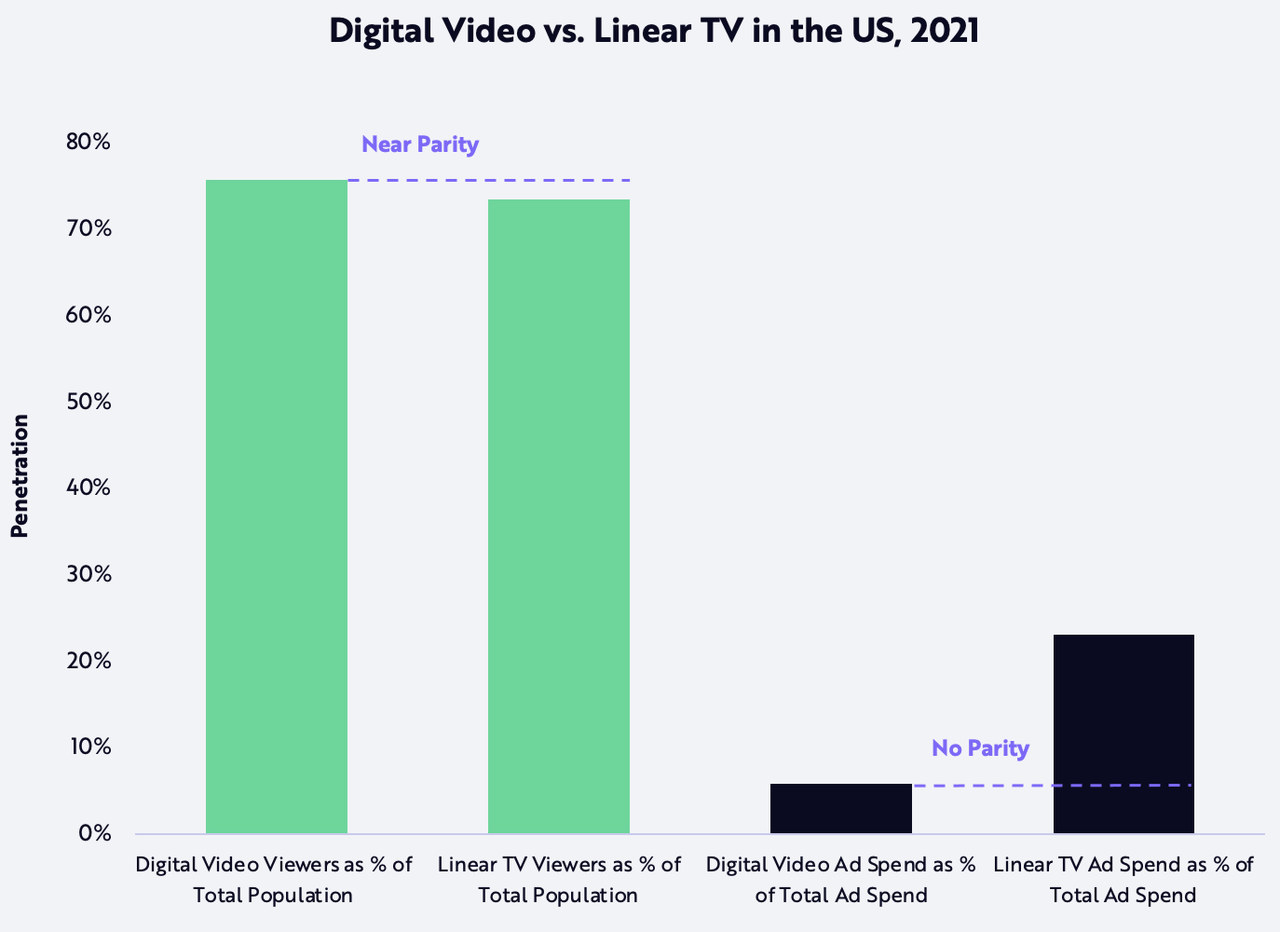
Across the countries in which Roku operates, the disconnect between digital video penetration and digital video ad spend is not as significant as in the US. The chart below shows that digital video viewership relative to linear TV viewership is higher in the US than in four of the countries that Roku has entered; yet, digital advertising relative to linear advertising is much lower in the US. In all five countries, the ratio between digital TV ad budgets and linear TV ad budgets ranges from 20% to 40%. In our view, the lag in ad budgets relative to viewership offers Roku an important opportunity to capitalize on what could be a significant shift in ad dollars from linear TV to CTV during the next five years.
ARK Investment Management LLC, 2022; Insider Intelligence, Inc.; S&P Global Market Intelligence.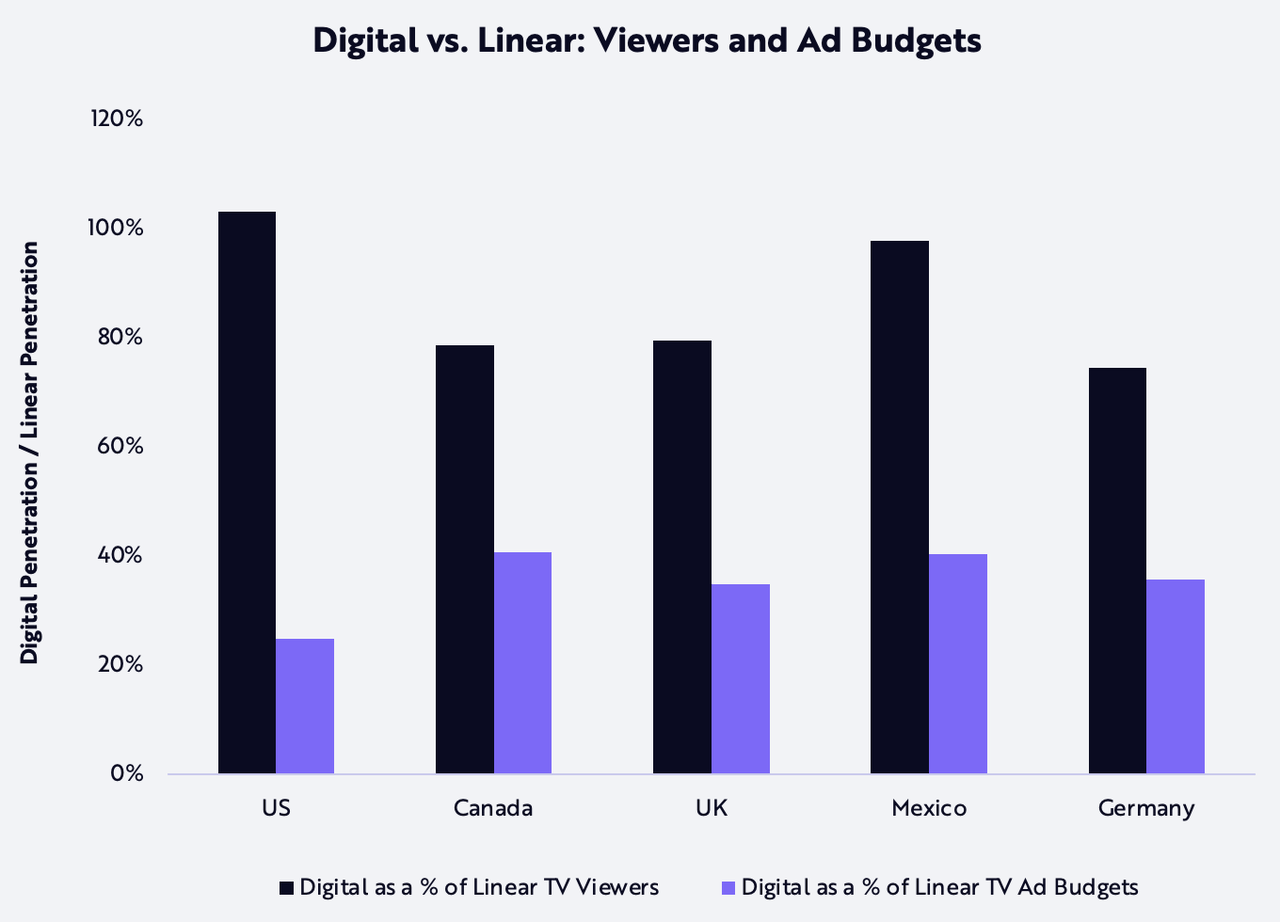
Roku’s Business Model
In this section, we detail the assumptions in our open-source Roku model. Roku segments its revenue into two streams: (1) platform revenue and (2) player revenue. We divide platform revenue into four parts: third-party video advertising, first-party video advertising and The Roku Channel, display advertising, and content distribution. Our forecasts are contingent upon our own assumptions.
Platform Revenue: Third-Party Video Advertising
Third-party content platforms can monetize video ads in two ways on Roku:
- In the “Inventory Split” model, the third-party channel in Roku’s app store sets up its own ad server and sends 30% of its ad inventory to Roku. Roku retains 100% of revenue attributable to selling this portion of inventory, while the third-party channel controls the remaining 70% and keeps 100% of the revenue attributable to it.[22]
- In the “Roku Sales Representation Program” model, the third-party channel sends 100% of its ad inventory to Roku to be managed and sold, eliminating the incremental operational and financial expenses associated with generating ad demand.[23]
Our model assumes that all channel partners monetize through the “Inventory Split”. Please find the details behind other assumptions in the open-source model itself.
In the table below, we highlight our forecast for Roku’s third-party video advertising revenue in our bear, base, and bull cases in 2026, compared to estimated results in 2021.
| Input / Output | 2021 ARK Estimates | 2026 Bear Case | 2026 Base Case | 2026 Bull Case |
|---|---|---|---|---|
| Daily Hours Streamed Attributable to AVOD Platforms (excluding The Roku Channel) per Active Account | 0.5 | 0.6 | 0.9 | 1.2 |
| Total Ad Minutes per Hour | 8 | 10 | 12 | 14 |
| Video Impressions per Hour [*] | 20 | 25 | 30 | 35 |
| Roku Inventory Share | 30% | 20% | 30% | 30% |
| Video Ad Sell-Through Rate [**] | 60% | 55% | 60% | 65% |
| Video Ad Target CPM [***] | $22.50 | $22.50 | $25.00 | $27.50 |
Source: ARK Investment Management LLC, 2022.
*Note: Across all cases, we assume that 1/4th of total ad minutes per hour is allocated to 15-second ads and that the remaining 3/4th of total ad minutes per hour is allocated to 30-second ads. The number of individual video ads per hour constitutes our calculation for total video impressions per hour. **Note: While the channel partner may send 30% of its ad inventory to Roku, Roku is under no obligation to sell all of it. The sell-through rate refers to the number of paid impressions sold divided by the total number served or available for sale. ***Note: “Cost per mille” (CPM) refers to the price an advertiser is willing to pay for its ad to receive 1,000 impressions. Forecasts are inherently limited and cannot be relied upon as a basis for making an investment decision and are built on our modeling that reflects our biases and long-term positive view of the company. Please see additional disclosure below on forecasts and hypothetical performance. For informational purposes only and should not be considered investment advice, or a recommendation to buy, sell or hold any particular security.
Platform Revenue: First-Party Video Advertising and The Roku Channel
Through The Roku Channel, Roku monetizes the sale of first-party video ad inventory by routing advertisers through OneView, its ad buying platform built specifically for streamed TV. With this service, Roku will provide advertisers with a dashboard of data about its users’ behavior patterns across any content or service on its platform. In our view, as demand for The Roku Channel increases, OneView’s ability to target demographic cohorts will attract more advertisers, positioning Roku for higher CPMs than the industry.
In the table below, we offer our 2026 bear, base, and bull case forecasts of Roku’s first-party digital advertising revenue. Roku’s first-party data in ad campaigns, as processed through OneView, has the potential to lead to better returns on investment (ROI), thanks to the more efficient targeting, conversion, and monetization of ad viewers.
| Input / Output | 2021 ARK Estimates | 2026 Bear Case | 2026 Base Case | 2026 Bull Case |
|---|---|---|---|---|
| Daily Hours Streamed Attributable to The Roku Channel per Active Account | 0.4 | 0.5 | 0.7 | 0.8 |
| Total Ad Minutes per Hour | 8 | 8 | 10 | 12 |
| Video Impressions per Hour [*] | 16 | 16 | 20 | 24 |
| Video Ad Sell-Through Rate [**] | 69% | 58% | 69% | 81% |
| OneView Video Ad Target CPM [***] | $28.13 | $25.88 | $31.25 | $37.13 |
| Roku Take Rate [****] | 20% | 10% | 20% | 20% |
Source: ARK Investment Management LLC, 2022.
*Note: Across all cases, we assume that all ad minutes are allocated to 30-second ads. **Note: We believe that sell-through rates will be higher for video ads transacted through OneView, due to higher advertiser demand for Roku’s first-party data and analytics. ***Note: To the video ad target CPMs forecasted for third-party video advertising, we apply a CPM premium of 15%, 25%, and 35% in our bear, base, and bull cases, respectively. We see this premium as reasonable, given the associated inclusion of Roku’s first-party data. ****Note: Roku charges a flat take rate on gross ad spend transacted through OneView. We use The Trade Desk’s publicized take rate of 20% as a proxy for OneView’s pricing structure. Forecasts are inherently limited and cannot be relied upon as a basis for making an investment decision and are built on our modeling that reflects our biases and long-term positive view of the company. Please see additional disclosure below on forecasts and hypothetical performance. For informational purposes only and should not be considered investment advice, or a recommendation to buy, sell or hold any particular security.
Platform Revenue: Display Advertising
We group revenue from third-party and first-party display advertising into one segment –– “Blended Inventory Share,” as shown below. Roku recognizes 100% of the revenue from the 30% of third-party display ad inventory it sells. It recognizes 100% of the revenue associated with first-party ads. To model display advertising under a single, blended view, we assume a slightly lower inventory share of 27% in 2021, which excludes the application of a take rate. We adjust the blended share down to 17% in our bear case to reflect lower assumptions for both inventory share (from 30% to 20%) and take rates (from 20% to 10%). We also increase the display ad CPMs, relative to our estimate of average CPMs for browser-based display ads, given the premium that OneView data should command.
| Input / Output | 2021 ARK Estimates | 2026 Bear Case | 2026 Base Case | 2026 Bull Case |
|---|---|---|---|---|
| Total Daily Display Impressions per Active Account | 7 | 4 | 9 | 14 |
| Roku (Blended) Inventory Share [*] | 27% | 17% | 27% | 27% |
| Display Ad Sell-Through Rate [**] | 75% | 41% | 60% | 81% |
| Display Ad Target CPM [***] | $6.12 | $4.59 | $6.12 | $7.65 |
Source: ARK Investment Management LLC, 2022.
*Note: The blended inventory share of 27% assumes that 2/3 of recorded display ad sales goes through third-party demand-side platforms (DSPs), whereas the remaining 1/3 of recorded display ad sales goes through OneView. **Note: We assume higher sell-through rates for display ads than for video ads, though we project that first-party video ads and display ads will exhibit similar sell-through rates. ***Note: We estimate that the CPM of both third-party and first-party display ads reflects roughly 1.5x the average CPM of Google display ads in 2021. We justify these higher costs by two factors: 1) the higher cost of advertising on CTVs versus browser/mobile formats, and 2) the inclusion of Roku’s first-party data for first-party display ad transactions. Forecasts are inherently limited and cannot be relied upon as a basis for making an investment decision and are built on our modeling that reflects our biases and long-term positive view of the company. Please see additional disclosure below on forecasts and hypothetical performance. For informational purposes only and should not be considered investment advice, or a recommendation to buy, sell or hold any particular security.
Platform Revenue: Content Distribution
We view all content distribution as monetizable relationships for Roku. Roku details in its documentation for developers that any transactional channel––or any platform that requires payment to install, subscribe, or purchase in-app goods and services –– enters a revenue sharing program in which Roku retains 20% of that platform’s revenue, net of credits, refunds, and other sources.[24] We assume that any platform’s net revenue to Roku is a combination of payments for SVOD (subscription video on demand) and TVOD (transactional video on demand).
Roku uses a different revenue-sharing model for third-party content platforms on The Roku Channel, Roku’s proprietary content platform, as opposed to a standalone app. Roku recognizes revenues accrued to these Premium Subscriptions on a gross basis and accounts for the revenue sharing agreement by subtracting the Premium Subscription’s share as cost-of-goods-sold (COGS).[25]
Finally, Roku sells space on its remote physical devices, which allow users to navigate to a specific third-party platform at the click of a branded button, and then charges a fixed fee per device sold.[26]
In the chart below, we detail by segment our estimates for Roku’s content distribution revenue both for 2021 and for our 2026 bear, base, and bull cases. We believe that SVOD and TVOD purchases will dominate Roku’s content distribution revenue –– 91%, 84%, and 73% in our bear, base, and bull cases, respectively.[27]
ARK Investment Management LLC, 2022.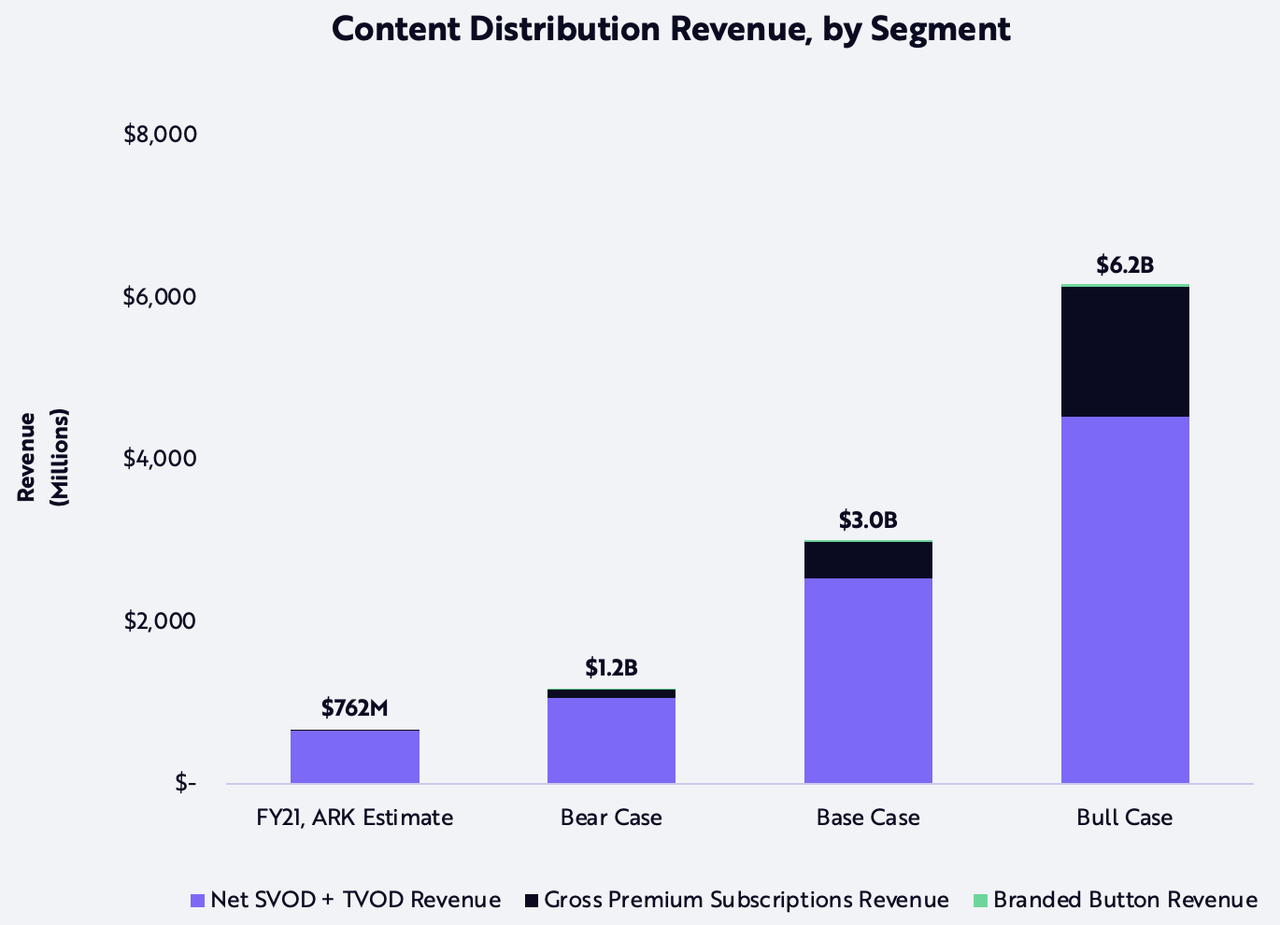
Forecasts are inherently limited and cannot be relied upon as a basis for making an investment decision and are built on our modeling that reflects our biases and long-term positive view of the company. Please see additional disclosure below on forecasts and hypothetical performance. For informational purposes only and should not be considered investment advice, or a recommendation to buy, sell or hold any particular security.
Player Revenue
Roku generates player revenue from the sale of streaming players and other hardware devices/accessories. Because new and returning Roku customers are likely to choose Roku CTVs over Roku streaming players, we do not forecast that player revenue will contribute meaningfully to overall revenue growth in the long run. While Roku generates some fee from the original equipment manufacturers (OEMs) with whom it has partnered, we assume that the fee is di minimis, as Roku sells the hardware primarily to acquire customers and then to monetize them through content distribution and advertising opportunities.
Business Opportunities Not Included in The Model
We have excluded from our model two additional business lines that could become meaningful to Roku’s business model, as discussed below.
Roku Pay and Direct Commerce
Roku Pay reduces friction in the TV shopping experience by enabling consumers to make purchases directly from their Roku TVs or other Roku devices.[28] While Roku Pay originally improved subscription and content transactions, its new exclusive deal with Walmart represents push into TV e-commerce: the company will sell ads in which viewers can use Roku Pay to purchase products from Walmart. While the ability to shop on TV has existed for decades, mobile and desktop e-commerce have provided more consumer-friendly checkout experiences than linear TV has been able to offer.[29] With one-tap checkout, Roku Pay could solve for linear TV’s weaknesses. We do not include this opportunity in the model currently, but we will be monitoring it for proof of concept.
Conclusion
ARK’s price target for Roku is $605 per share in 2026, implying a 53% annualized return.[30] Our bear and bull cases are approximately $100 and $1,493 per share, corresponding to 3% and 88% annualized returns, respectively. We have published our open-source Roku model on GitHub here and welcome readers to explore, test our assumptions, and scenario-test with other assumptions. As always, we look forward to your constructive criticism and feedback, which you can submit here.
Disclosure
The forecasted performance and price estimates herein are subject to revision by ARK and provided solely as a guide to current expectations. There can be no expectation that the specific security will achieve such performance or that there will be a return of capital. Past performance is not indicative of future results.
FORECASTED PERFORMANCE RESULTS ARE HYPOTHETICAL AND HIGHLY SPECULATIVE, AND PRESENT MANY RISKS AND LIMITATIONS. The recipient should not consider these estimated prices alone in making an investment decision. While ARK believes that there is a sound basis for the forecasts presented, no representations are made as to their accuracy, and there can be no assurance that such forecasts or returns will be achieved by the specific security.
The recipient is urged to use extreme caution when considering the forecasted performance, as it is inherently subjective and reflects ARK’s inherent bias toward higher expected returns. Any higher returns should be viewed as a measure of the relative risk of such investments, with higher forecasted performance generally reflecting greater risk. There is no guarantee that any results will align with the forecasted performance, and they might not be predictive. Some or all results may be substantially lower than projected results and, as with any investment, it is possible that you could lose money.
FORECASTED performance results (single security model simulation forecasts) have many inherent limitations. A recipient account might or might not hold this single security, and the account performance will be affected in proportion to its holding size and the amount of price fluctuation over time. No representation is being made that any client account will or is likely to achieve profits or losses tied to a security in the security model forecasts. In fact, there could be significant differences between these forecasted performance results and the actual results realized.
Forecasted performance has not been achieved by the security, and like all modeled, projected or hypothetical performance, it is important to note that there are multiple versions of a model, and ARK has a conflict of interest in that we have an incentive to show you the best performing results. These forecasts rely on models, which calculate hypothetical performance. Several of the limitations of hypothetical performance models include: 1) reliance on a variety of data obtained from sources that are believed to be reliable, but might be incorrect, inaccurate or incomplete and ARK does not guarantee the accuracy or completeness of any information obtained from any third party, 2) potential inclusion of inherent model creation biases, data discrepancies and/or calculation errors that could cause actual results to differ materially from those projected, 3) NO reflection of the impact that material economic and market factors might have had on investment decisions that would have been in actual portfolios being managed at the time and do not involve market risk, and 4) NO guarantee of future investment results. The forecasted results rely on assumptions, forecasts, estimates, modeling, algorithms and other data input by ARK, some of which relies on third-parties, that could be or prove over time to be incorrect, inaccurate or incomplete.
The forecasted returns are based on a variety of criteria and assumptions, which might vary substantially, and involve significant elements of subjective judgment and analysis that reflect our own expectations and biases, which might prove invalid or change without notice. It is possible that other foreseeable events that were not taken into account could occur. The forecasted performance results contained herein represent the application of the simulation models as currently in effect on the date first written above, and there can be no assurance that the models will remain the same in the future or that an application of the current models in the future will produce similar results because the relevant market and economic conditions that prevailed during the performance period will not necessarily occur. The results will not be updated as the models change, or any information upon which they rely changes. There are numerous other factors related to the markets in general or to the public equity security specifically that cannot be fully accounted for in the preparation of forecasted performance results, all of which can adversely affect actual results. For these reasons, forecasted performance results will differ, and could differ significantly from actual results. FORECASTED PERFORMANCE RESULTS ARE SUBJECT TO REVISION AND PRESENTED FOR ILLUSTRATIVE PURPOSES ONLY.
While ARK’s current assessment of the subject company may be positive, please note that it might be necessary for ARK to liquidate or reduce position sizes prior to the company attaining any forecasted valuation pricing due to a variety of conditions including, but not limited to, client specific guidelines, changing market conditions, investor activity, fundamental changes in the company’s business model and competitive landscape, headline risk, and government/regulatory activity. Additionally, ARK does not have investment banking, consulting, or any type of fee-paying relationship with the subject company.
-
1 To calculate the compound annual growth rate, we use Roku’s share price of $88.53, its price at close on July 6, 2022.
- 2 ARK Invest Brochure – This forecast relies on data that have not been verified, and are subject to numerous criteria, assumptions, risks, and limitations that are inherently uncertain, and there will be variations with real life that could cause substantially different results. The forecast includes assumptions on gross margin and capital efficiency, and certain other metrics, which are subject to change or revisions over time, that are influenced by ARK’s subjective judgments and biases that heighten the risks and limit the uses of the forecast as a decision-making tool. Given the unpredictable nature of markets and other future events, relying on forecasts is inherently risky. While we believe that there is a sound basis for the forecast presented, no representations are made as to their accuracy, and there can be no assurance that such forecasts or returns will be achieved or align with any actual results. A recipient should not consider these forecasts alone in making an investment decision. These forecasts do not reflect any fees or expenses related to owning Roku shares. ARK related persons and ARK clients can own Roku shares, and therefore ARK has an incentive and interest in the value of these shares, and ARK and its related persons can receive asset- and performance-based fees on the value of these shares in an ARK client’s portfolio, meaning if share prices rise, ARK can earn more fees. ARK’s related persons can make investment determinations that conflict with determinations made on behalf of ARK clients, and that are aligned with, contrary to or differ from the information contained herein. For more information related to ARK’s conflicts of interest, please see ARK’s Form ADV Part 2A.
- 3 We assume the same inputs across all three cases for five variables that we do not consider to be core drivers of the model.
- 4 “Roku Q1 2022 Shareholder Letter.” Roku Inc., April 28, 2022.
- 5 Roku All data and business developments are sourced from Roku’s quarterly shareholder letters and S-1 filing.
- 6 “Roku Launches Popular Streaming Players in Mexico.” Roku Inc., October 1, 2015.
- 7 “Roku is the #1 TV Streaming Platform in Mexico.” Roku Inc., November 30, 2021.
- 8 “Roku Streaming Players Launch in Canada.” Roku Inc., April 16, 2012.
- 9 “Roku is Canada’s #1 TV Streaming Platform.” Roku Inc., January 27, 2022.
- 10 “The Nielsen Total Audience Report.” The Nielsen Company, March 2021.
- 11 Rachel Wolff, “Disney’s earnings show a company in transition.” eMarketer, February 11, 2022.
- 12 We sum the total time allocated to Live TV, DVD/Blue-ray Device, and Time-Shifted TV––as estimated by Nielsen––to approximate the total time spent via legacy video. We then bucket the aforementioned cohorts into time spent on linear TV. Due to lack of annualized data, we use Nielsen’s third-quarter data as proxy for that calendar year.
- 13 “Roku Q4 2021 Shareholder Letter.” Roku Inc., February 17, 2022.
- 14 “The Nielsen Total Audience Report.” The Nielsen Company.
- 15 “Strategy Analytics: Global Smart TV Household Ownership to Exceed 50% by 2026.” Strategy Analytics, July 20, 2021.
- 16 “Streaming climbs to new heights again in April despite a dip in total TV viewing.” The Nielsen Company, May 19, 2022.
- 17 The planned introduction of ad-supported services by subscription-based streaming giants Netflix and Disney+ seems to be fueling such pessimism, as does Netflix’s recent loss of 200,000 subscribers in the first quarter of 2022. See Nicole Sperling, “Netflix loses subscribers for first time in 10 years.” The New York Times, April 19, 2022. “Disney+ to Introduce an Ad-Supported Subscription Offering in Late 2022.” The Walt Disney Company, March 4, 2022.
- 18 “Streaming climbs to new heights again in April despite a dip in total TV viewing.” The Nielsen Company.
- 19 Ibid.
- 20 Ibid.
- 21 Anthony Wood, “Roku, Inc. Q1 2022 Earnings Call.” (Earnings call, April 28, 2022), S&P Global Market Intelligence.
- 22 “Video advertisements.” Roku Developers, Roku, Inc., accessed June 1, 2022.
- 23 Ibid.
- 24 “Monetization overview.” Roku Developers, Roku, Inc., accessed May 24, 2022.
- 25 Roku, Inc., Form 10-K 2021, San Jose, California: Roku, Inc., 2022.
- 26 Ibid.
- 27 To calculate the compound annual growth rate, we use Roku’s share price of $88.53, its price at close on July 6, 2022.
- 28 “What is Roku Pay?” Roku Support, Roku, Inc., accessed June 28, 2022.
- 29 Lauren Forristal, “Roku and Walmart partner up to bring shoppable ads to streaming.” TechCrunch, June 18, 2022.
- 30 Our open-source Roku model on GitHub does include projections of player revenue for our bear, base, and bull cases.
Disclosure: ARK’s statements are not an endorsement of any company or a recommendation to buy, sell or hold any security. For a list of all purchases and sales made by ARK for client accounts during the past year that could be considered by the SEC as recommendations, click here. It should not be assumed that recommendations made in the future will be profitable or will equal the performance of the securities in this list. For full disclosures, click here.
Editor’s Note: The summary bullets for this article were chosen by Seeking Alpha editors.
Be the first to comment