

Kwarkot
REIT Performance
July’s real estate investment trust (“REIT”) sector rebound sharply reversed in August as REITs averaged a -5.29% total return. REITs underperformed the broader market, suffering deeper declines than the Dow Jones Industrial Average (-3.7%), S&P 500 (-4.1%) and NASDAQ (-4.5%). The market cap weighted Vanguard Real Estate ETF (VNQ) saw a lower total return than the average REIT in August (-6.01% vs. -5.29%) and remains deeper in the red YTD (-18.88% vs. -16.26%). The spread between the 2022 funds from operations (“FFO”) multiples of large cap REITs (20.0x) and small cap REITs (13.4x) widened in August as multiples decreased by 0.7 turns for large caps and 1.1 turns for small caps.
In this monthly publication, I will provide REIT data on numerous metrics to help readers identify which property types and individual securities currently offer the best opportunities to achieve their investment goals.
Graph by Simon Bowler of 2nd Market Capital, Data compiled from S&P Global Market Intelligence LLC. See important notes and disclosures at the end of this article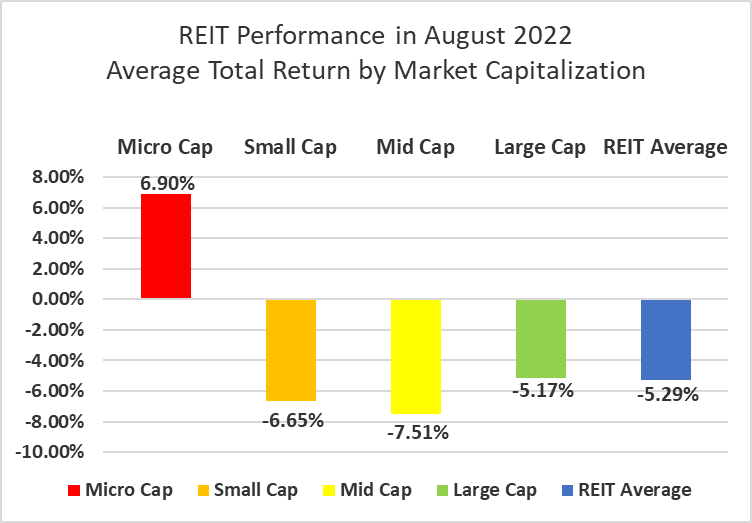
Microcap REITs (+6.9%) were in the black in August thanks to the +201% return of one REIT more than offsetting the decline in most others. Excluding that single REIT, microcaps averaged a -6.04% return which was in line with the rest of the REIT sector. Mid cap (-7.51%), small cap (-6.65%) and large cap (-5.17%) REITs all fell sharply into the red for the month of August. Large cap REITs (-15.10%) are outperforming small caps (-15.33%) by 23 basis points on YTD 2022 total return.
Graph by Simon Bowler of 2nd Market Capital, Data compiled from S&P Global Market Intelligence LLC. See important notes and disclosures at the end of this article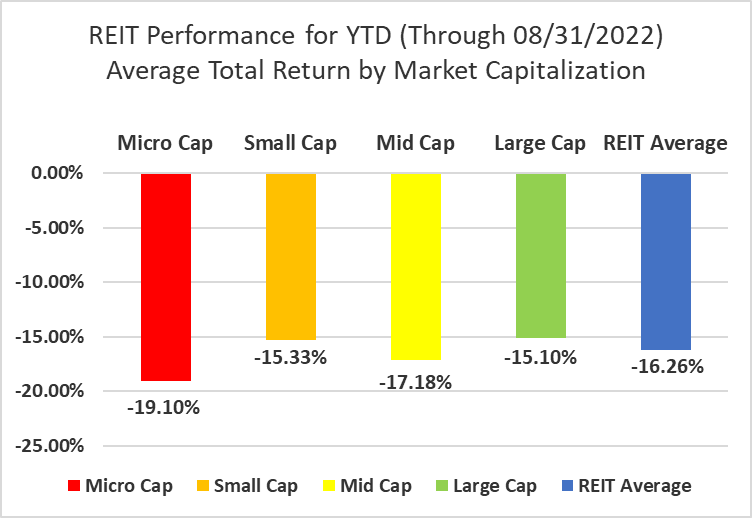
2 out of 18 Property Types Yielded Positive Total Returns in August
11 percent of REIT property types averaged a positive total return in August, with a 15.55% total return spread between the best and worst performing property types. Office (-12.33%) and Diversified (-9.24%) REITs had the worst average total returns in August. Office fundamentals continue to be an area of concern due to the uncertainty regarding when and to what extent work-from-home employees will eventually return to the office. Office as an asset class can also struggle during recessions, so back to back quarters with negative U.S. GDP have further shaken confidence that investors will be able to achieve strong returns through Office REITs.
Shopping Center (+3.21%) and Self Storage (+0.78%) were the only REIT property types to finish in the black at the end of a rough August for the market. Self Storage REITs have historically remained more resilient throughout economic downturns and faced less selling pressure in August than their more economically sensitive peers.
Table by Simon Bowler of 2nd Market Capital, Data compiled from S&P Global Market Intelligence LLC. See important notes and disclosures at the end of this article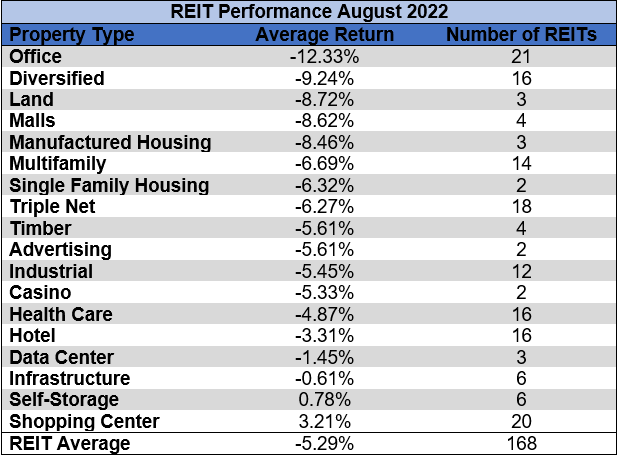
After the first eight months of the year, Student Housing (+14.02%) and Casino (+5.98%) REITs are the only property types in positive territory. The Student Housing gains came in the first 7 months of the year prior to the only Student Housing REIT being acquired. Malls (-38.15%) and Office (-29.80%) REITs are the worst performing property types thus far in 2022.
Table by Simon Bowler of 2nd Market Capital, Data compiled from S&P Global Market Intelligence LLC. See important notes and disclosures at the end of this article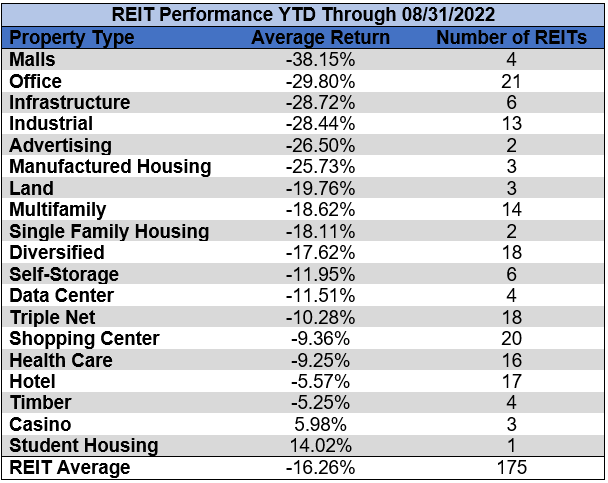
The REIT sector as a whole saw the average P/FFO (2022) decrease 1.1 turns in August (from 16.1x down to 15.0x). The average FFO multiples declined for 100% of property types in August. There are no recent 2022 FFO/share estimates for either of the Advertising REITs. Land (35.4x), Industrial (23.2x) and Manufactured Housing (23.0x) currently trade at the highest multiples of any REIT property type. Mall (5.0x), Office (8.5x) and Hotel (8.8x) REITs are the only property types currently trading at a single digit multiple.
Table by Simon Bowler of 2nd Market Capital, Data compiled from S&P Global Market Intelligence LLC. See important notes and disclosures at the end of this article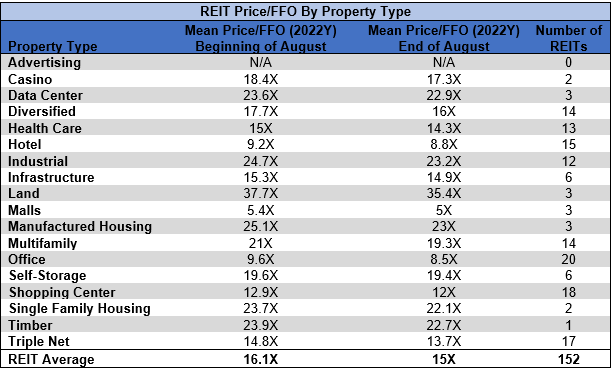
Performance of Individual Securities
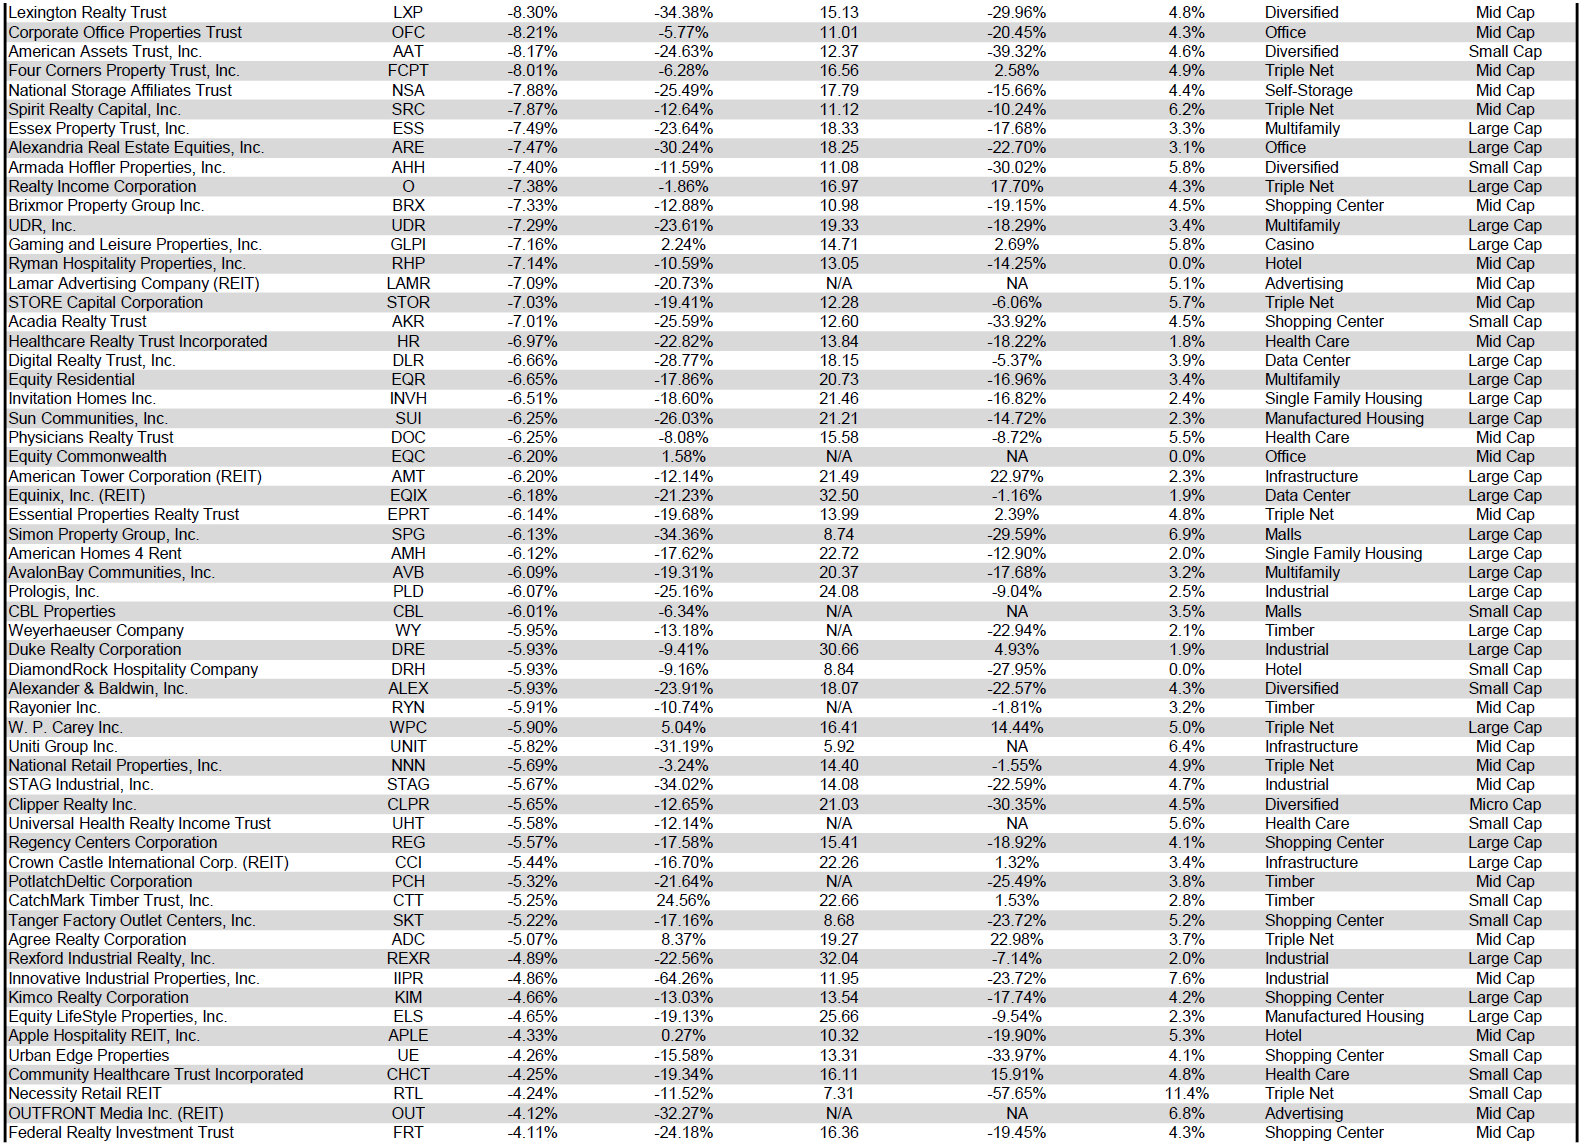
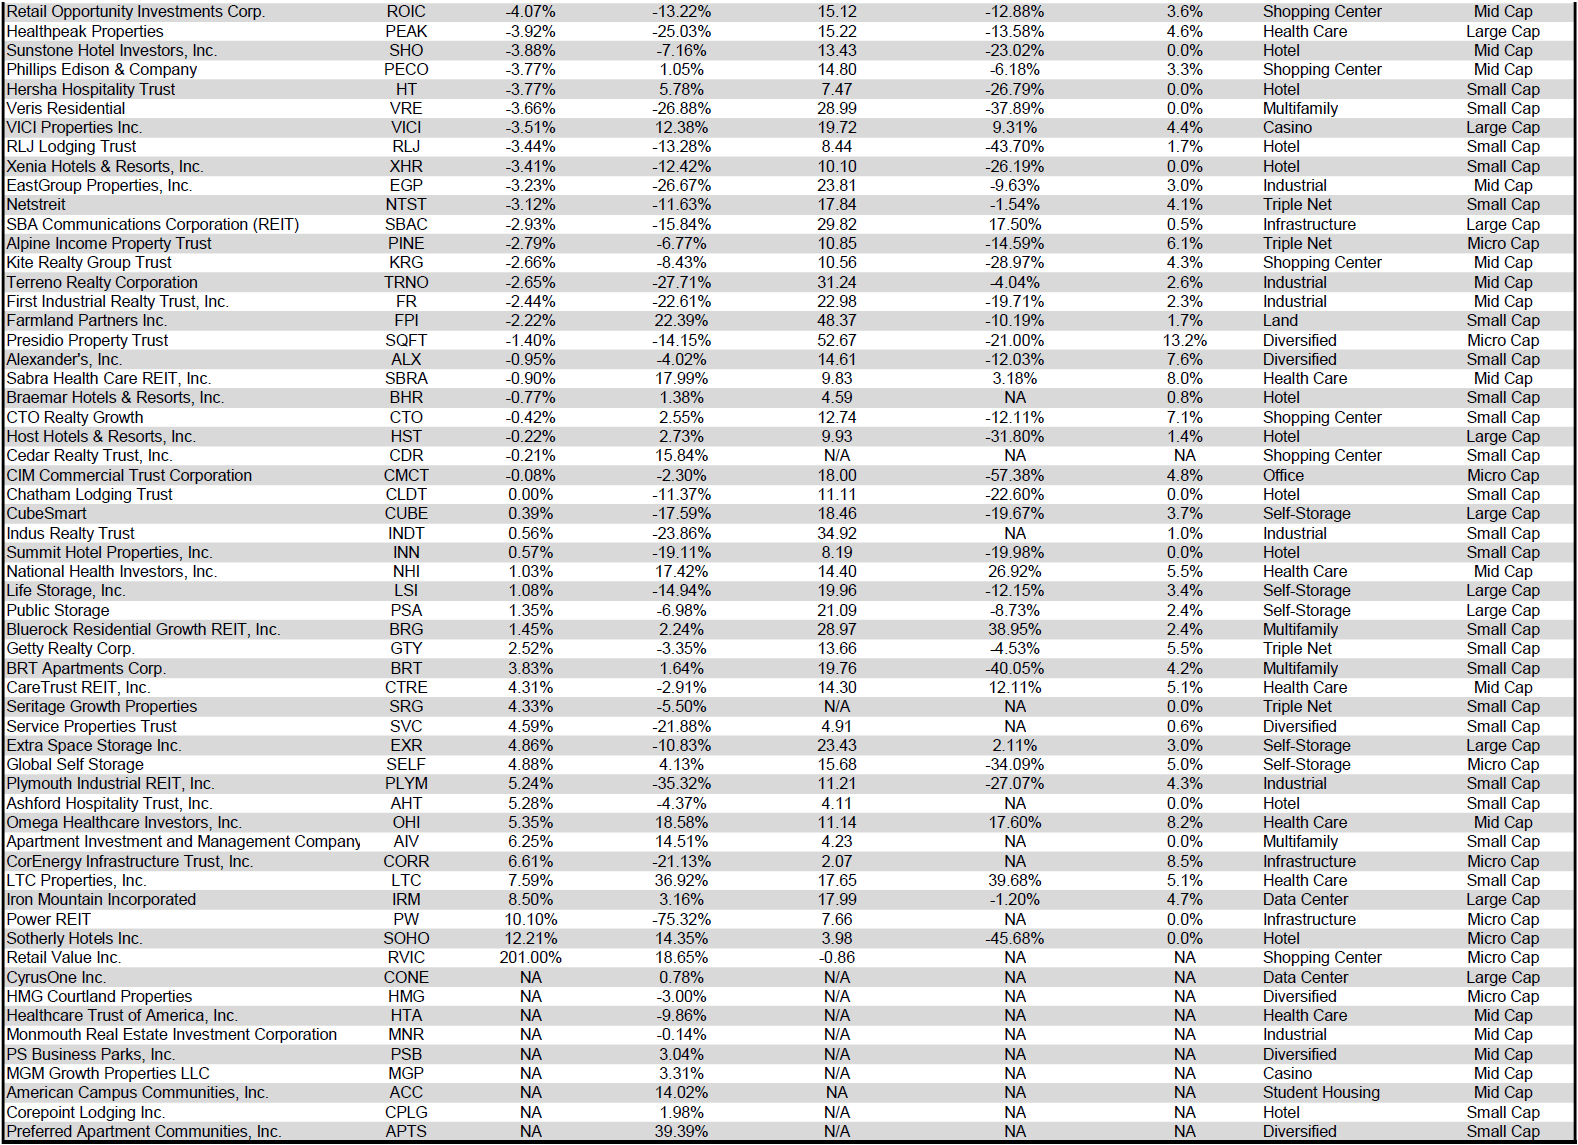
Cedar Realty Trust (CDR) merged with Wheeler REIT (WHLR) on August 22nd. The combined entity will continue to trade under the name Wheeler REIT and CDR has ceased trading. The preferred shares of both REITs will continue to trade on their respective exchanges. Holders of CDR common shares and OP units received $9.48/share from the merger. In addition, a $19.52/share special dividend was paid to all shareholders of record as of August 19th.
Retail Value Inc. (OTCPK:RVIC) (+201%) tripled after releasing a Q2 2022 earnings report that revealed updated financials. RVIC had filed a certificate of dissolution on June 30th, so investors have been watching closely to see how much will be left to distribute to shareholders. RVIC will continue to exist for the purpose of “paying, satisfying and discharging any unknown or contingent claims or any debts or other obligations, collecting and distributing its assets, and doing all other acts required to liquidate and wind-up its business and affairs.” Each quarterly earnings report will provide updated financials that could cause similarly large share price movement to what was seen in August given the visibility into the magnitude of potential payout at or before liquidation.
Franklin Street Properties (FSP) (-25.86%) continues to struggle to an even greater degree than most of their office REIT peers, posting a dismal -8.5% SS-NOI growth in Q2 2022. This poor operating performance followed the July announcement that FSP switched to a variable dividend that slashed the payout from $0.09 in April to only $0.01 in July. FSP underperformed all other REITs in August.
15.06% of REITs had a positive return in August, with 18.86% in the black year to date. During the first eight months of last year the average REIT had a +28.59% return, whereas this year the average REIT has seen a -16.26% total return.
Table by Simon Bowler of 2nd Market Capital, Data compiled from S&P Global Market Intelligence LLC. See important notes and disclosures at the end of this article Table by Simon Bowler of 2nd Market Capital, Data compiled from S&P Global Market Intelligence LLC. See important notes and disclosures at the end of this article Table by Simon Bowler of 2nd Market Capital, Data compiled from S&P Global Market Intelligence LLC. See important notes and disclosures at the end of this article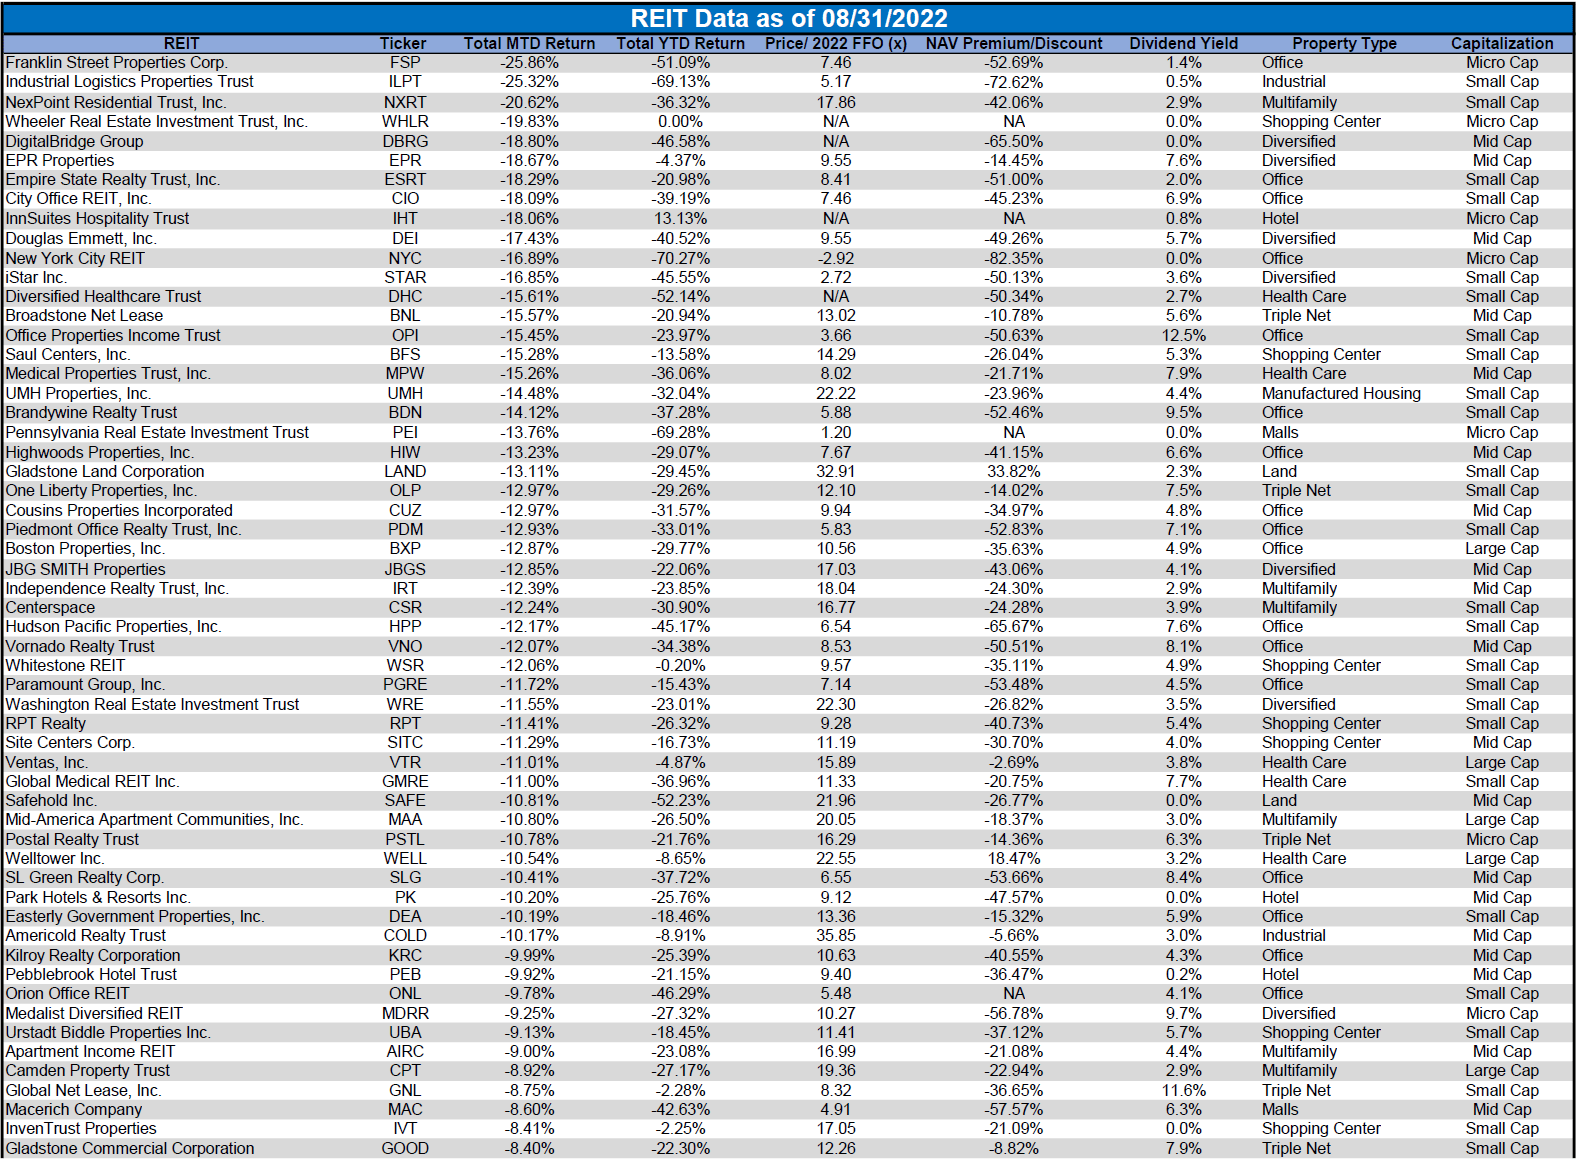
For the convenience of reading this table in a larger font, the table above is available as a PDF as well.
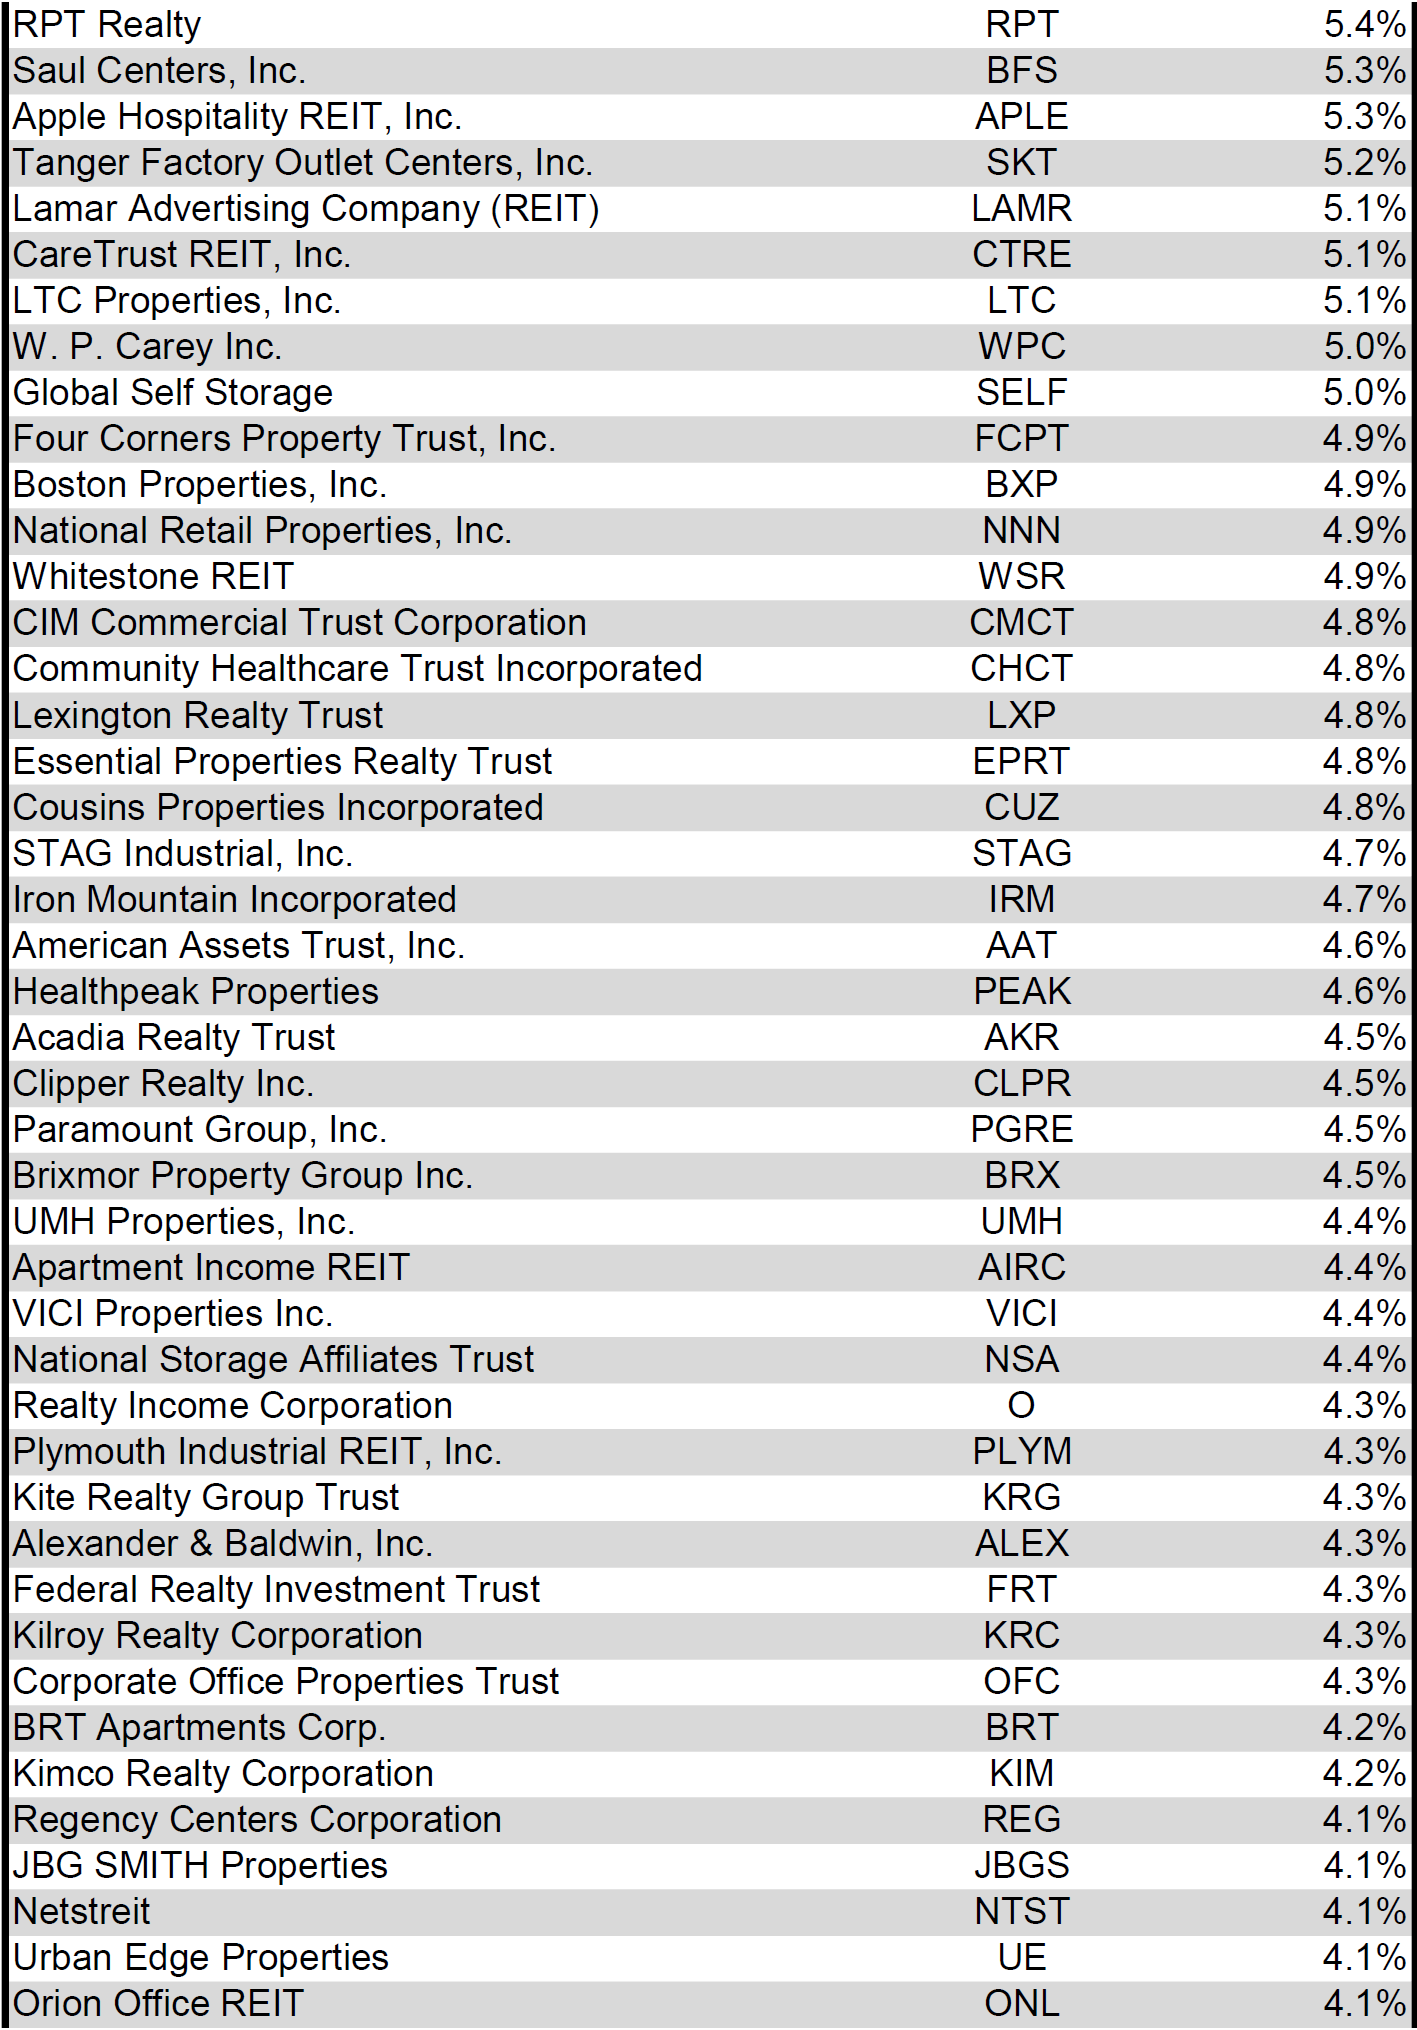
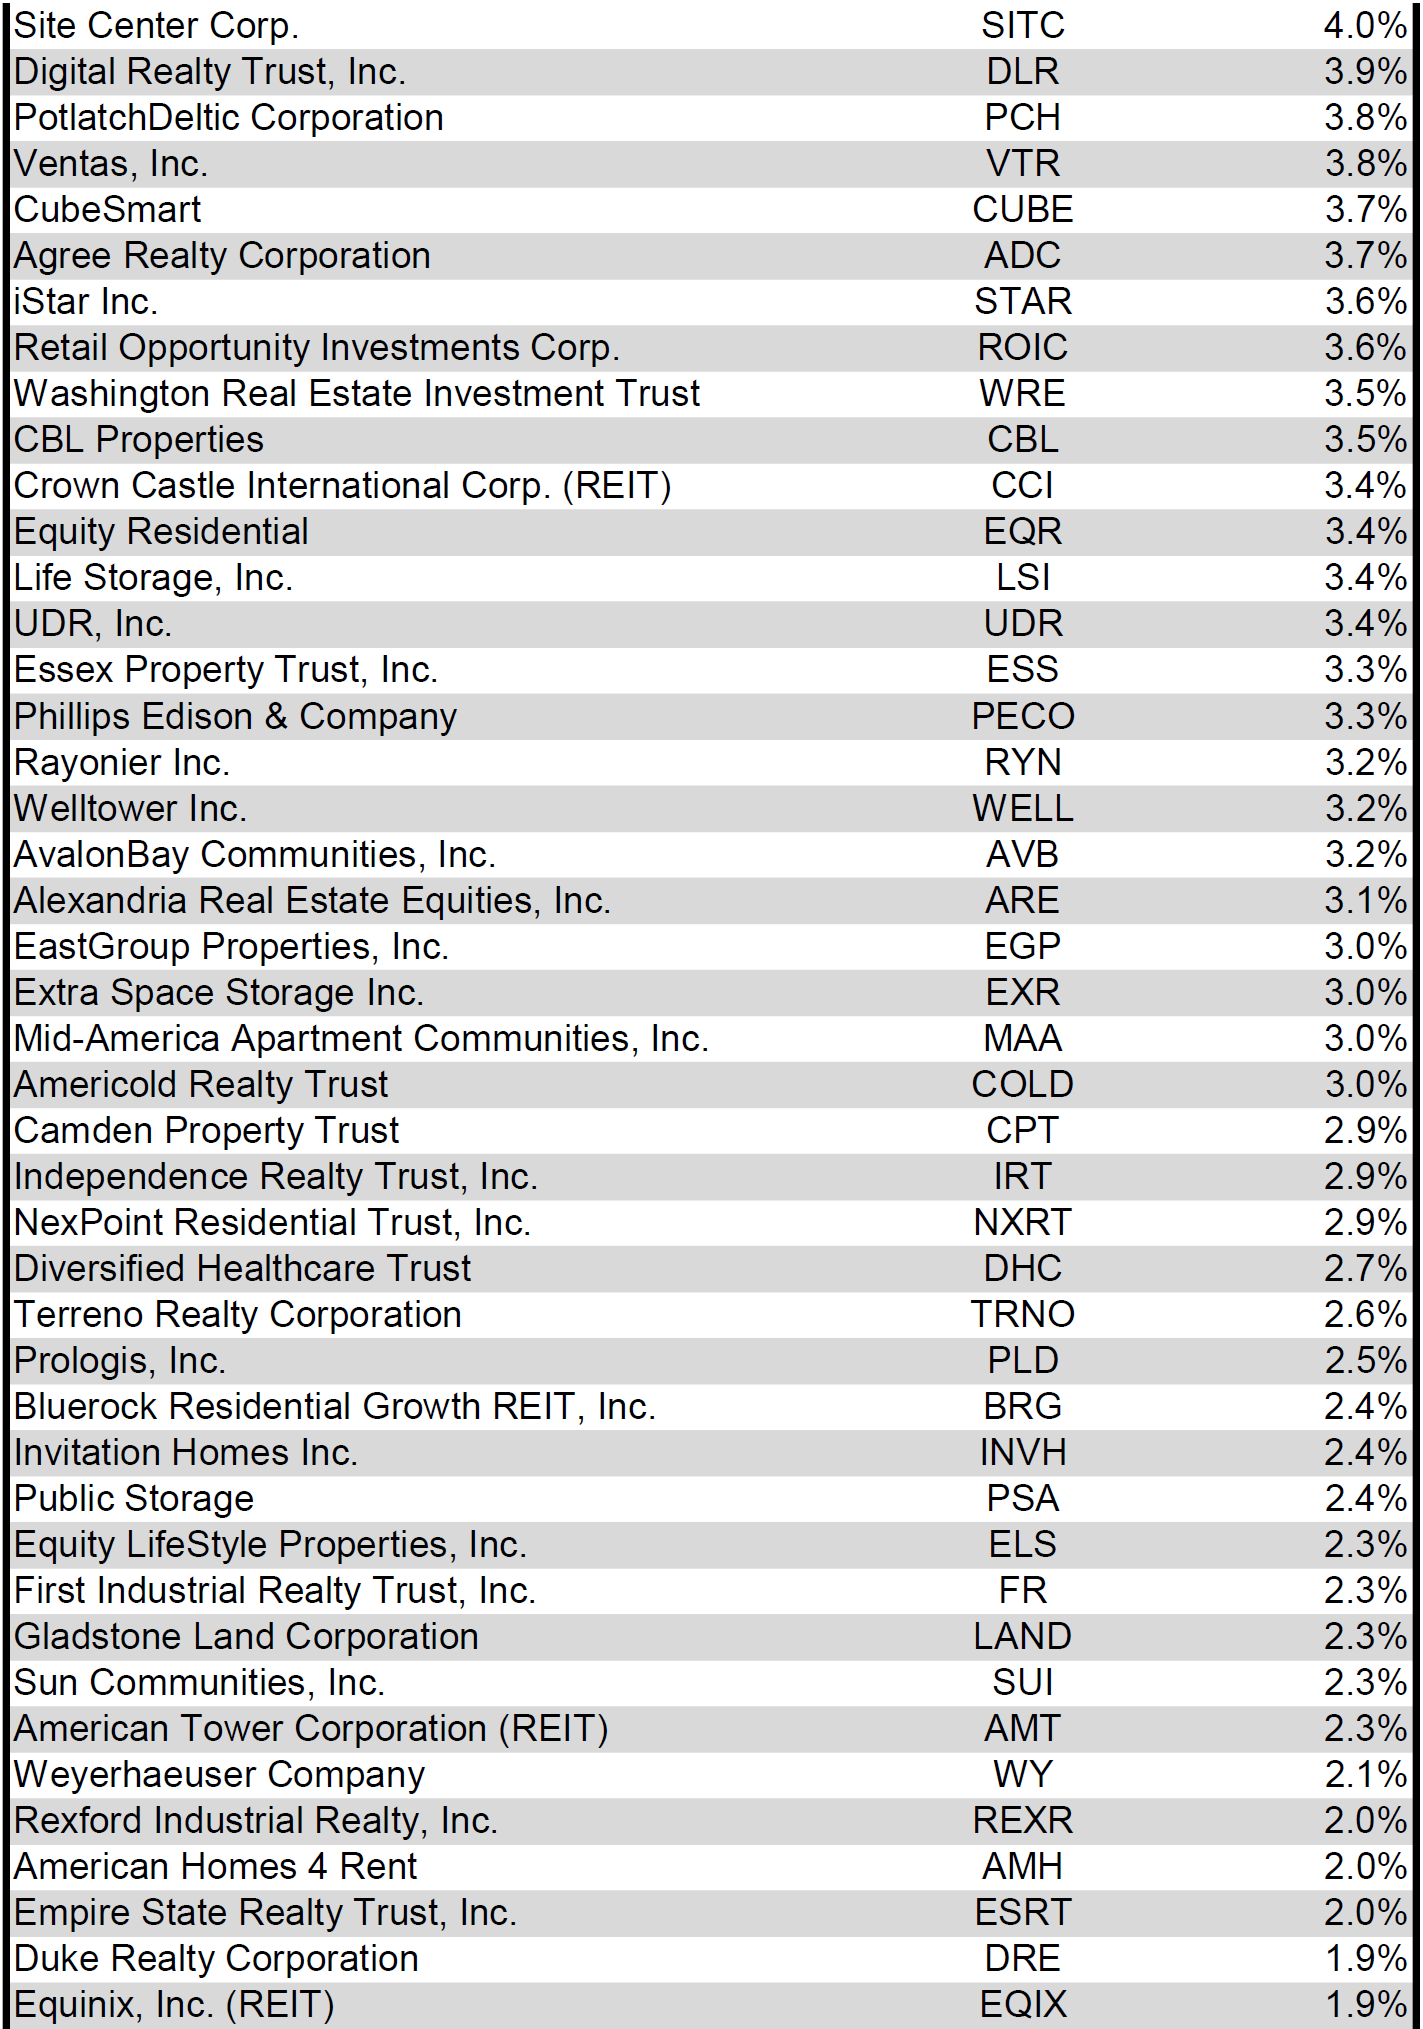
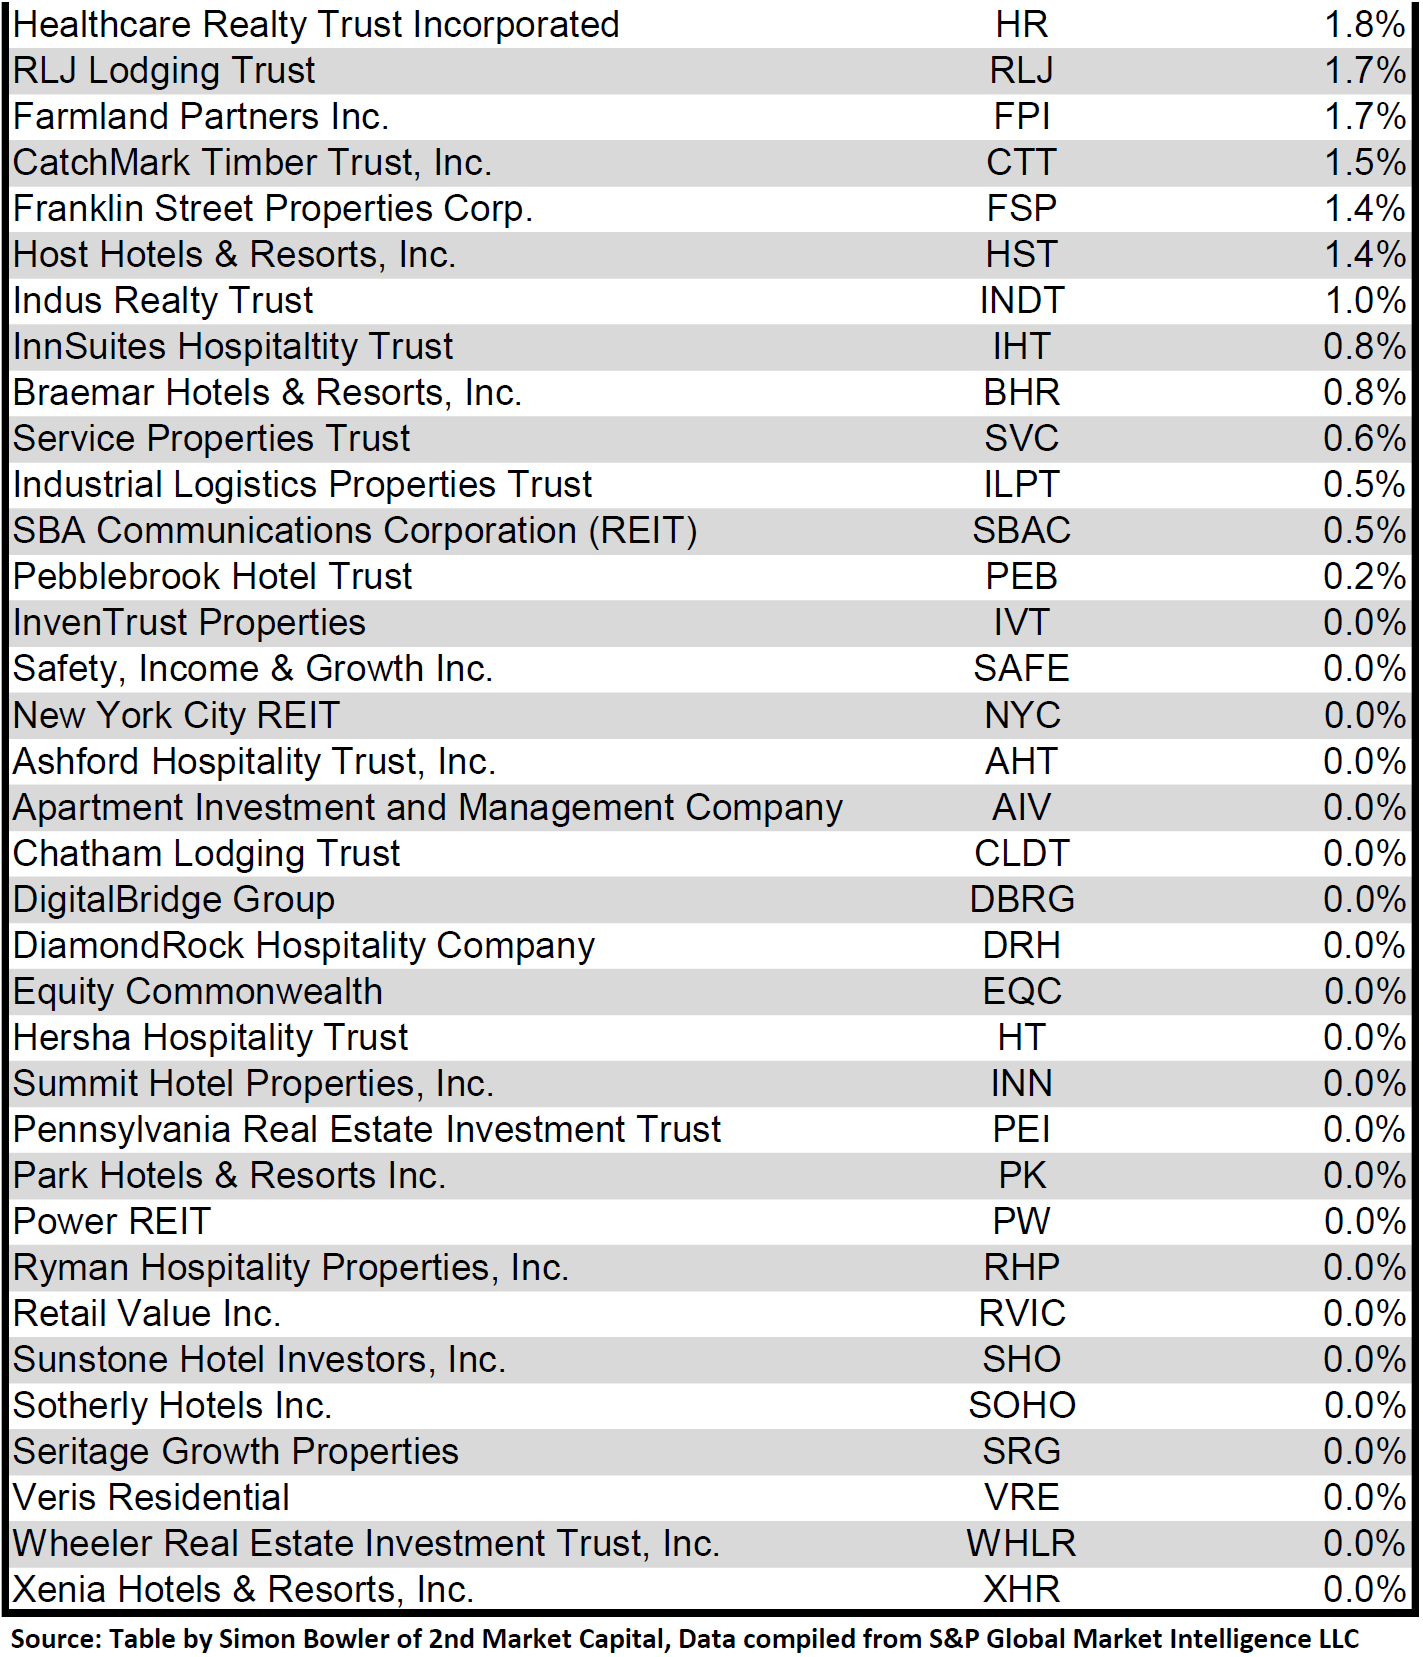
Dividend Yield
Dividend yield is an important component of a REIT’s total return. The particularly high dividend yields of the REIT sector are, for many investors, the primary reason for investment in this sector. As many REITs are currently trading at share prices well below their NAV, yields are currently quite high for many REITs within the sector. Although a particularly high yield for a REIT may sometimes reflect a disproportionately high risk, there exist opportunities in some cases to capitalize on dividend yields that are sufficiently attractive to justify the underlying risks of the investment. I have included below a table ranking equity REITs from highest dividend yield (as of 08/31/2022) to lowest dividend yield.
Table by Simon Bowler of 2nd Market Capital, Data compiled from S&P Global Market Intelligence LLC. See important notes and disclosures at the end of this article Table by Simon Bowler of 2nd Market Capital, Data compiled from S&P Global Market Intelligence LLC. See important notes and disclosures at the end of this article Table by Simon Bowler of 2nd Market Capital, Data compiled from S&P Global Market Intelligence LLC. See important notes and disclosures at the end of this article Table by Simon Bowler of 2nd Market Capital, Data compiled from S&P Global Market Intelligence LLC. See important notes and disclosures at the end of this article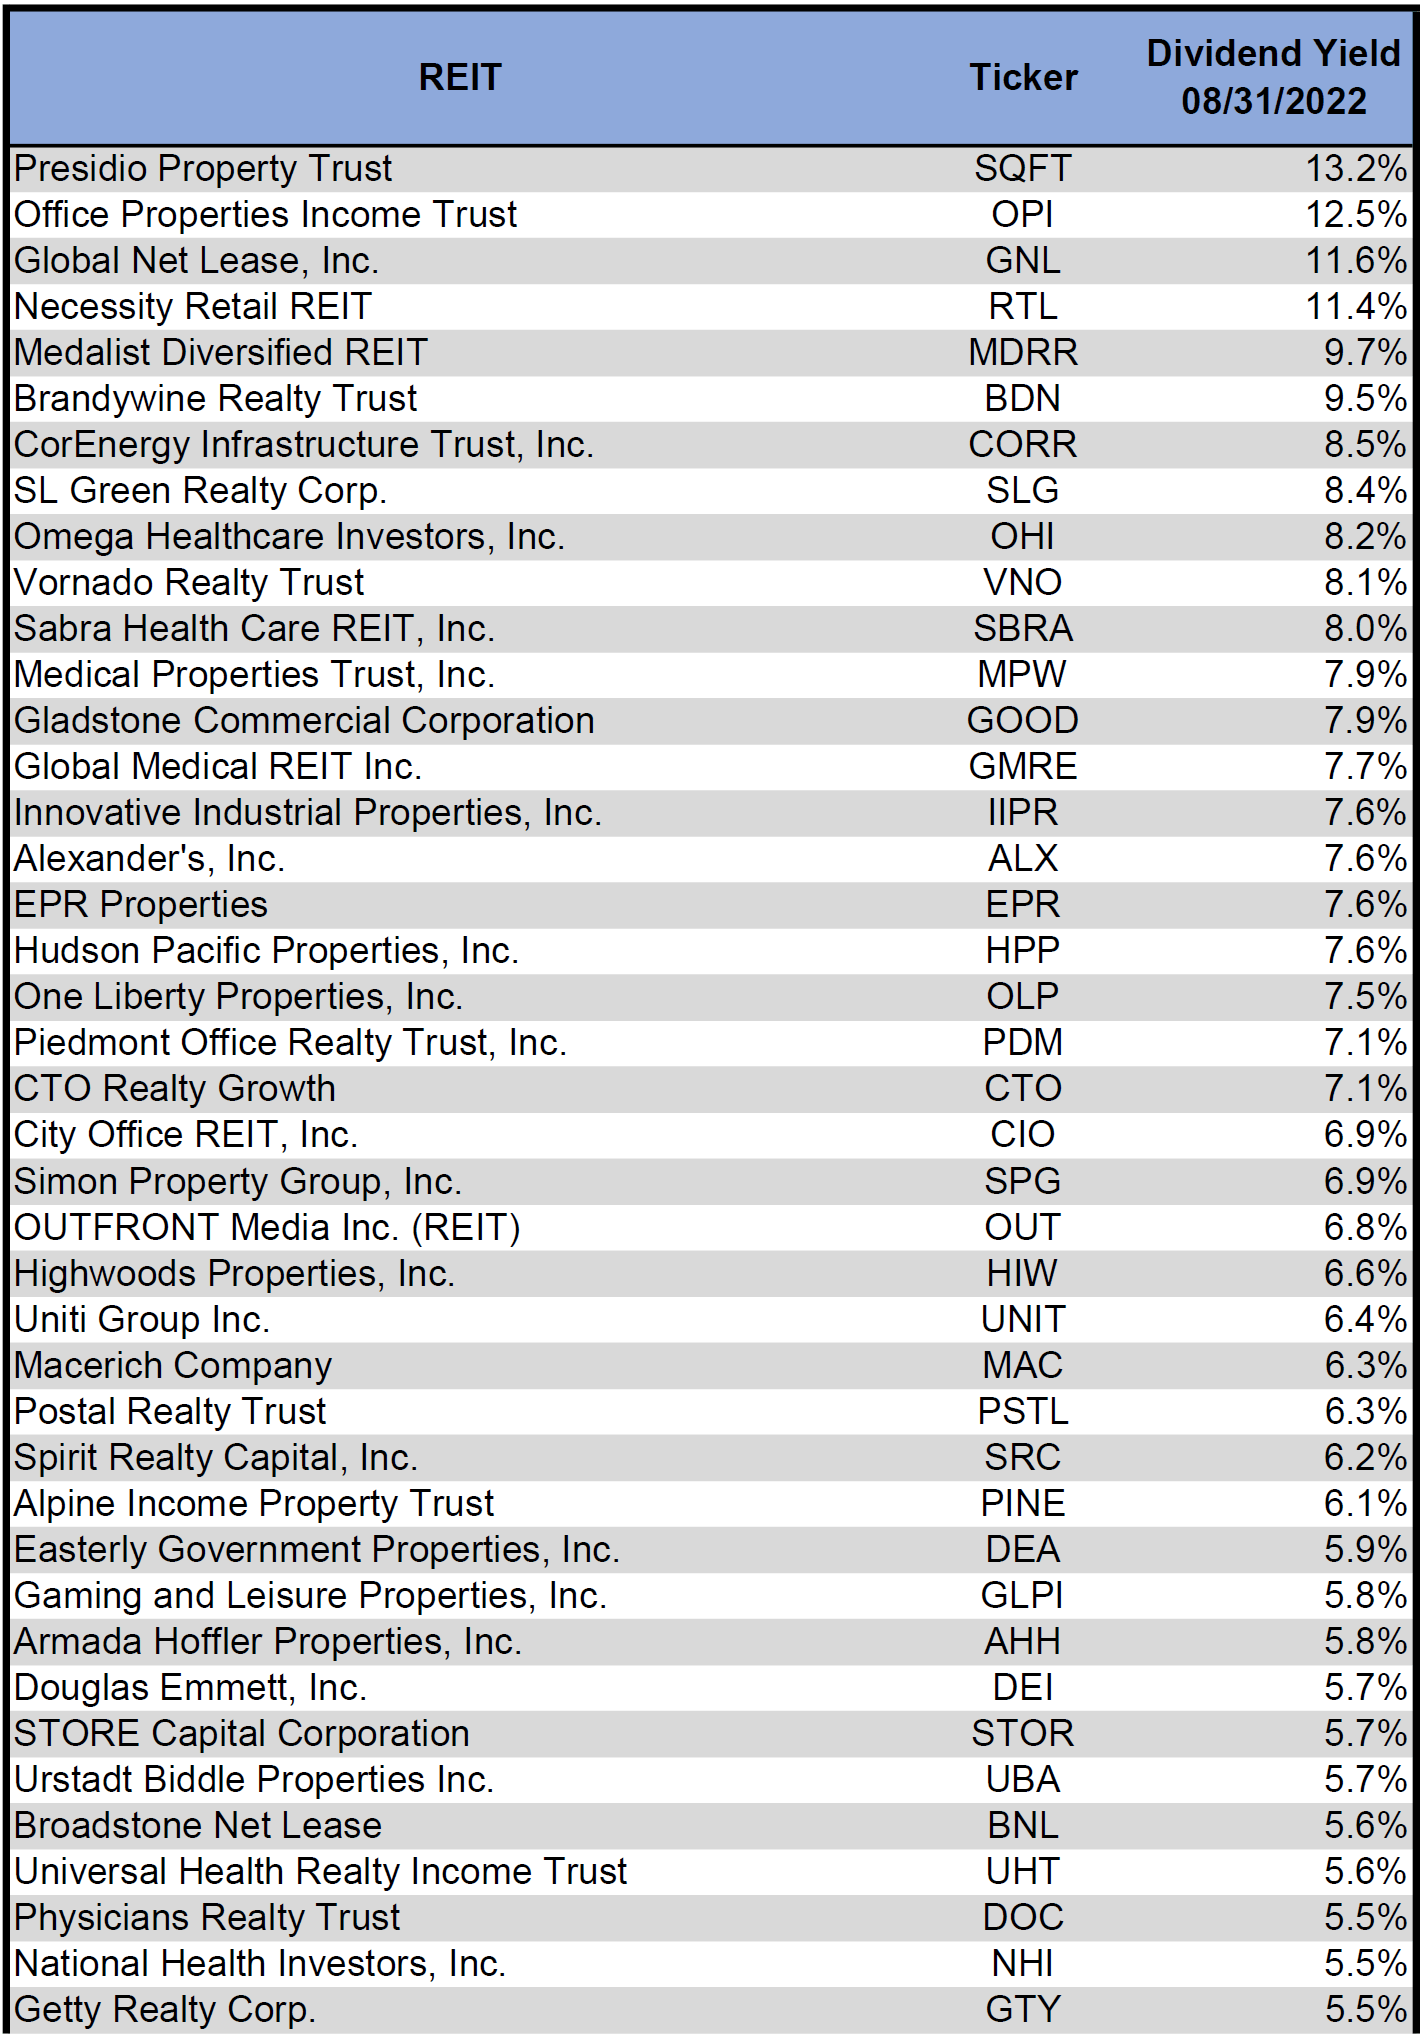
For the convenience of reading this table in a larger font, the table above is available as a PDF as well.
Although a REIT’s decision regarding whether to pay a quarterly dividend or a monthly dividend does not reflect on the quality of the company’s fundamentals or operations, a monthly dividend allows for a smoother cash flow to the investor. Below is a list of equity REITs that pay monthly dividends ranked from highest yield to lowest yield.
Table by Simon Bowler of 2nd Market Capital, Data compiled from S&P Global Market Intelligence LLC. See important notes and disclosures at the end of this article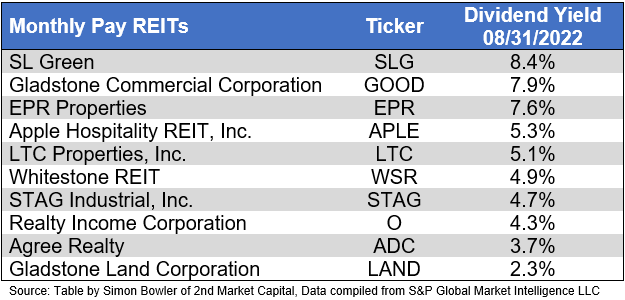
Valuation
REIT Premium/Discount to NAV by Property Type
Below is a downloadable data table, which ranks REITs within each property type from the largest discount to the largest premium to NAV. The consensus NAV used for this table is the average of analyst NAV estimates for each REIT. Both the NAV and the share price will change over time, so I will continue to include this table in upcoming issues of The State of REITs with updated consensus NAV estimates for each REIT for which such an estimate is available.
Table by Simon Bowler of 2nd Market Capital, Data compiled from S&P Global Market Intelligence LLC. See important notes and disclosures at the end of this article Table by Simon Bowler of 2nd Market Capital, Data compiled from S&P Global Market Intelligence LLC. See important notes and disclosures at the end of this article Table by Simon Bowler of 2nd Market Capital, Data compiled from S&P Global Market Intelligence LLC. See important notes and disclosures at the end of this article Table by Simon Bowler of 2nd Market Capital, Data compiled from S&P Global Market Intelligence LLC. See important notes and disclosures at the end of this article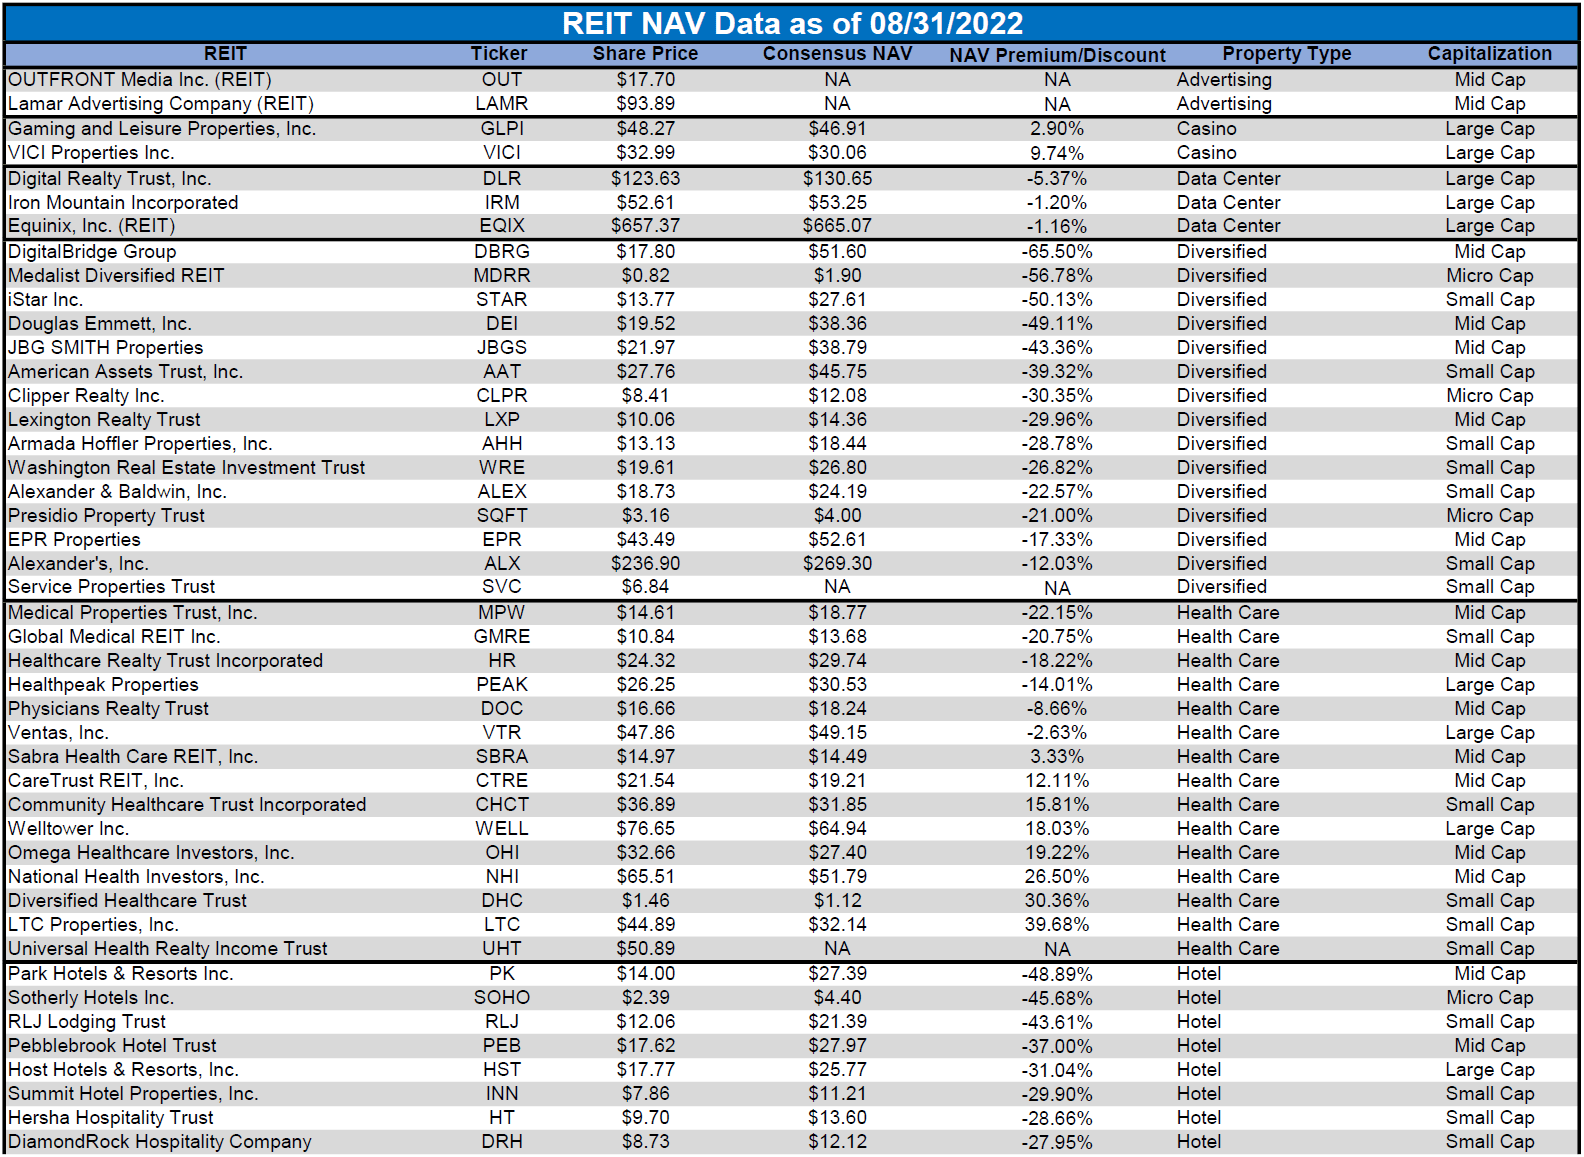
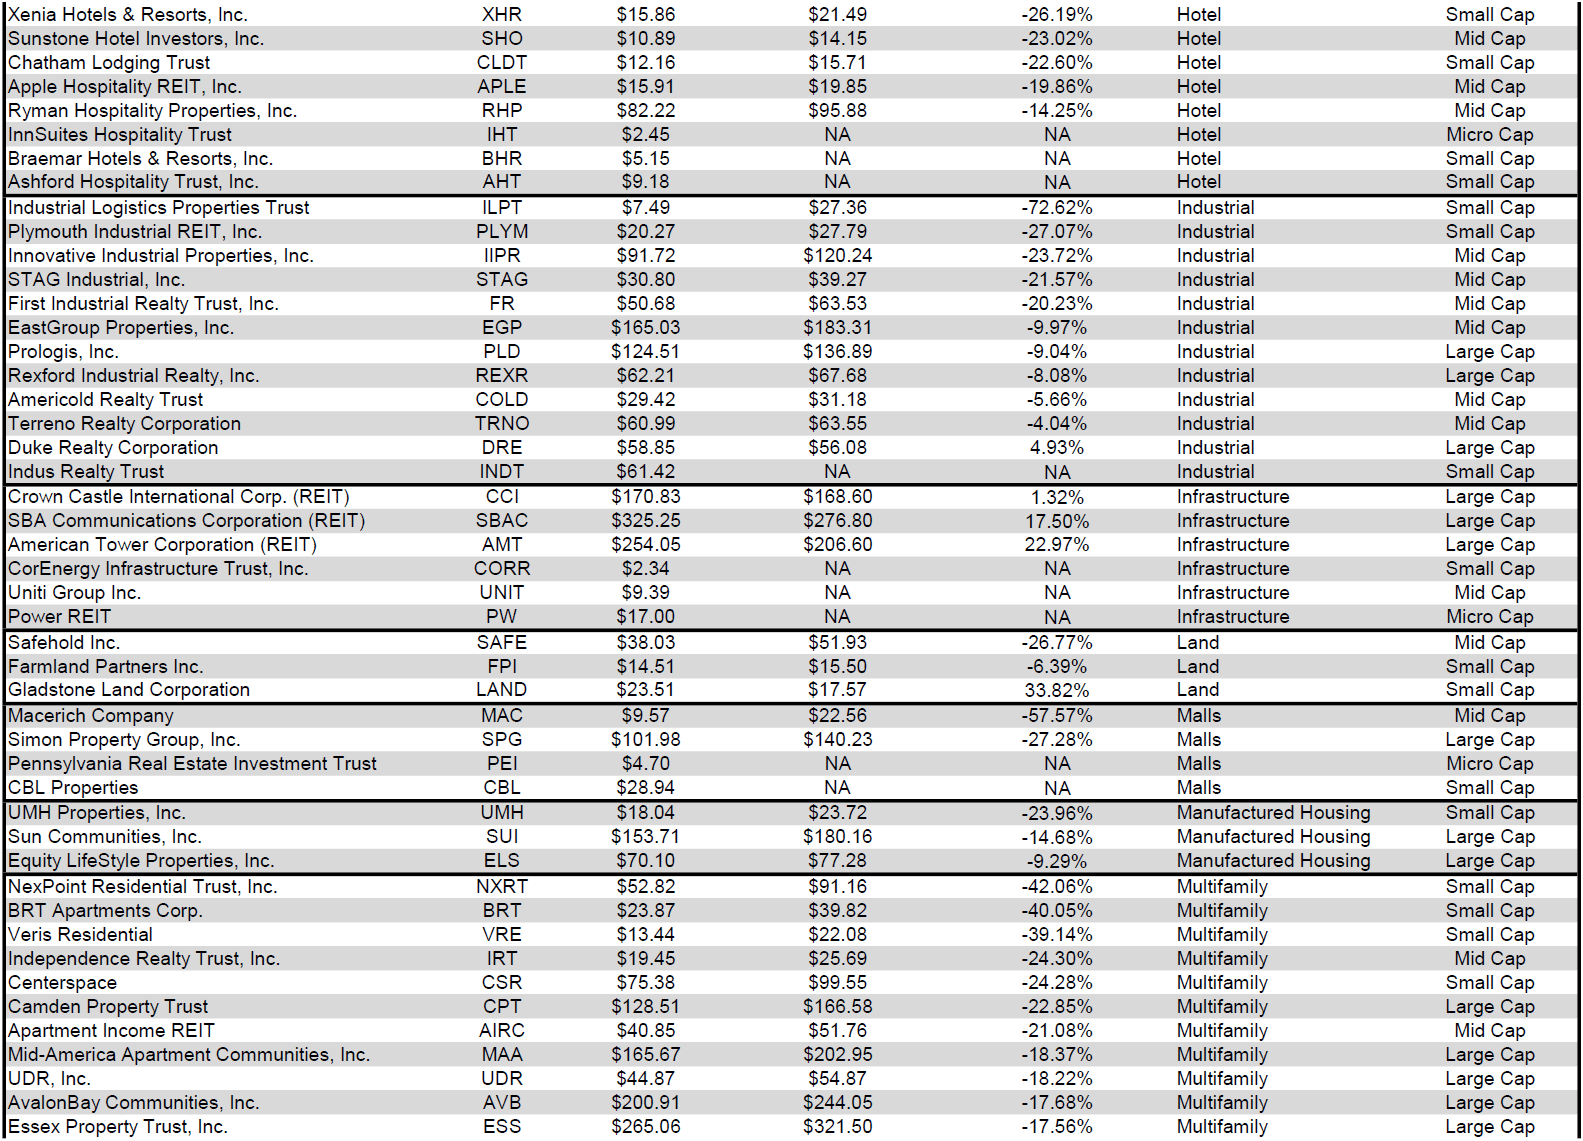

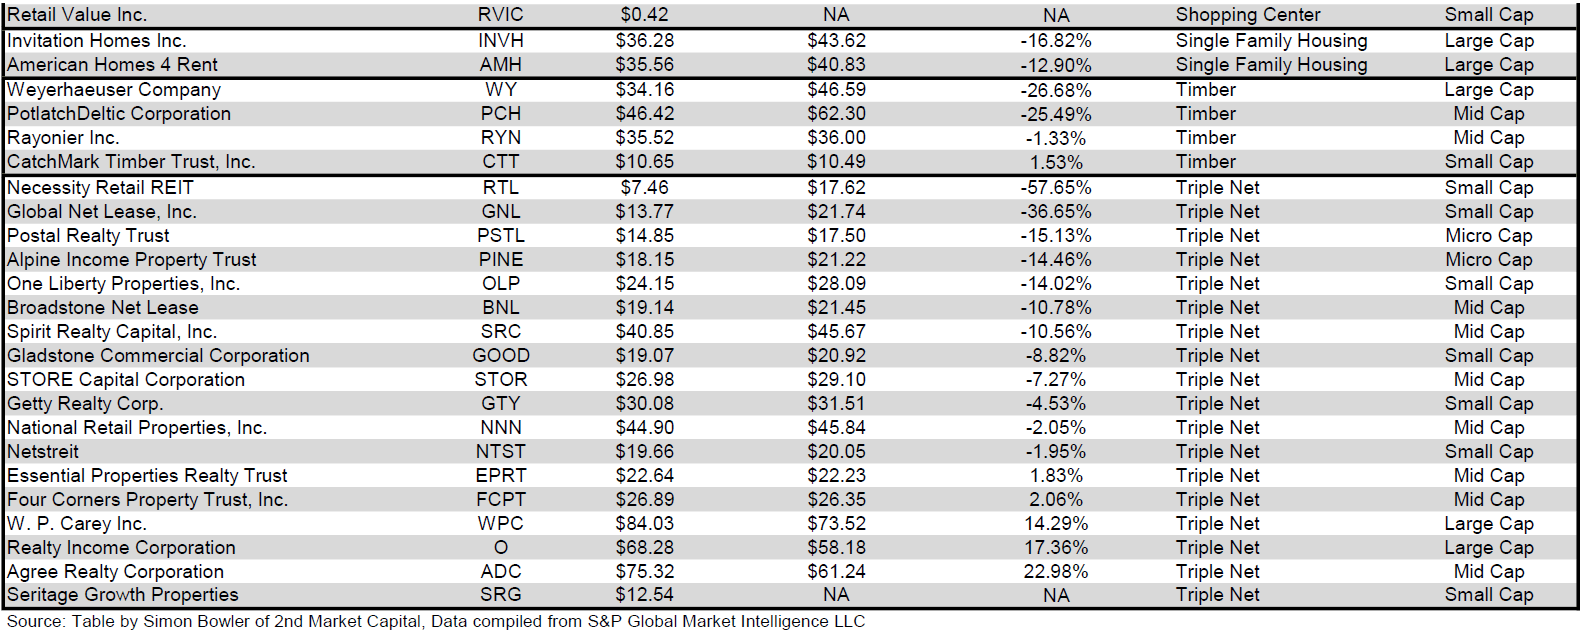
For the convenience of reading this table in a larger font, the table above is available as a PDF as well.
Takeaway
The large cap REIT premium (relative to small cap REITs) widened in August, and investors are now paying on average about 49% more for each dollar of 2022 FFO/share to buy large cap REITs than small cap REITs (20x/13.4x – 1 = 49.3%). As can be seen in the table below, there is presently a strong positive correlation between market cap and FFO multiple.
Table by Simon Bowler of 2nd Market Capital, Data compiled from S&P Global Market Intelligence LLC. See important notes and disclosures at the end of this article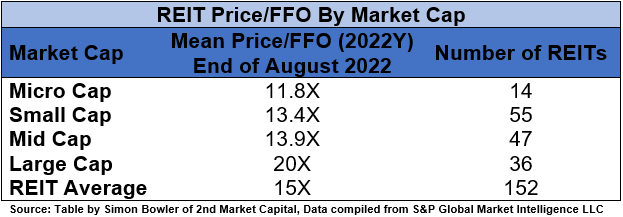
The table below shows the average premium/discount of REITs of each market cap bucket. This data, much like the data for price/FFO, shows a strong, positive correlation between market cap and Price/NAV. The average large cap REIT (-8.54%) trades at a single digit discount to NAV, while midcap REITs (-19.53%) and small cap REITs (-25.59%) trade at double-digit discounts. Microcaps on average trade at less than 3/5 of their respective NAVs (-40.99%).
Table by Simon Bowler of 2nd Market Capital, Data compiled from S&P Global Market Intelligence LLC. See important notes and disclosures at the end of this article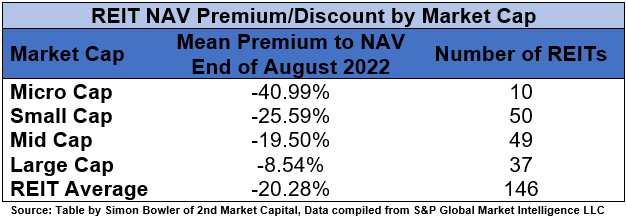
While the U.S. economy continues to suffer from rampant inflation and rapidly rising interest rates, the REIT sector is continuing to see robust growth. Although total REIT FFO did decline from $15.49B in Q4 2019 to $11.12B in Q2 2020 due to the impact of government-imposed lockdowns, REITs have rapidly rebounded and soared to new heights. REIT FFO in Q2 2022 was $19.11B, a 72% increase in just the past 2 years.
S&P Global Market Intelligence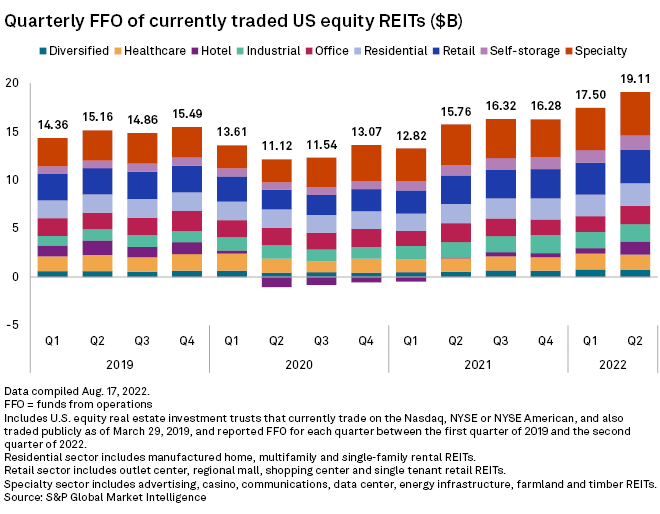
This massive growth in FFO has been fueled by remarkable same-store NOI (SS-NOI) growth. Although REIT SS-NOI growth faded somewhat in Q2 2022 (from 8.6% in Q1 to 5.4% in Q2), both quarters this year remain ahead of the 5.3% SS-NOI growth for full-year 2021. This growth continues to remain strong with many property types posting huge SS-NOI gains in Q2 2022. The most robust growth has been achieved in Self Storage (+18.9%), Residential (+13.4%) and Industrial (+7.1%). Even struggling property types such as Office (+2.9%) and Malls (+1.6%) are still achieving positive SS-NOI growth.
S&P Global Market Intelligence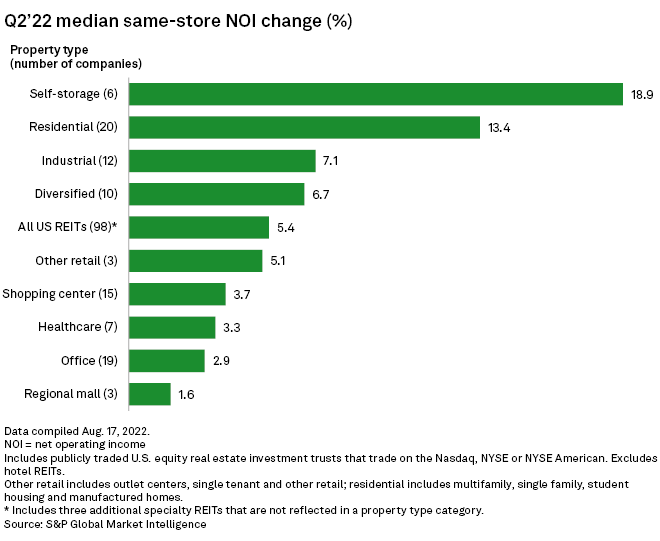
As can be seen in the graph below, these SS-NOI growth gains have not just come from rent increases, but also from improving occupancy.
S&P Global Market Intelligence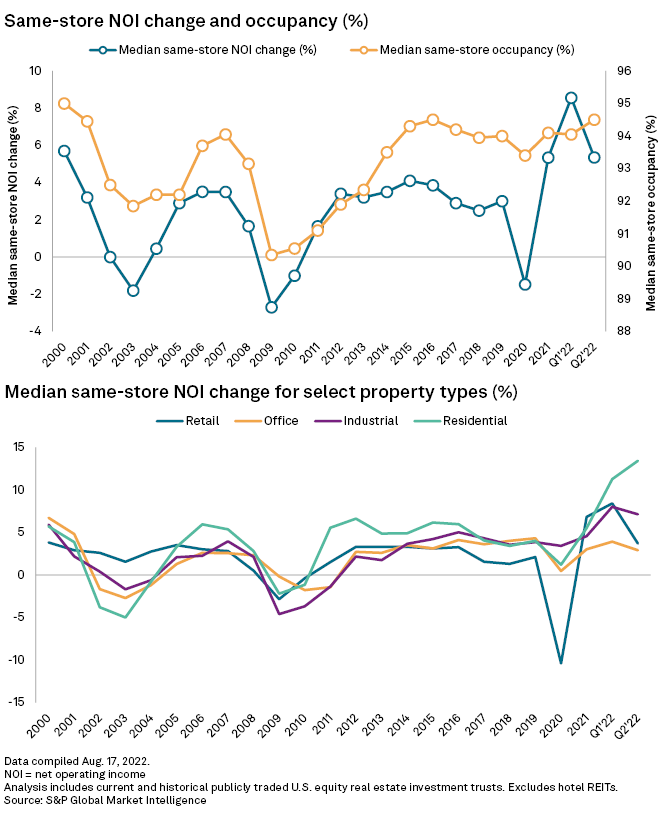
Of the core 4 property types of Retail, Office, Industrial and Residential, only Retail saw SS-NOI growth turn negative during the lockdowns of 2020. This decline was the result of some retail tenants, who were banned from opening by the government, refusing to pay rent for space they were unable to use. Some landlords gave rent concessions in the form of reduced or deferred rent. Other tenants exited leases entirely. However, Retail REITs rebounded back into positive territory as governments allowed retailers to re-open and have maintained positive SS-NOI growth since.
S&P Global Market Intelligence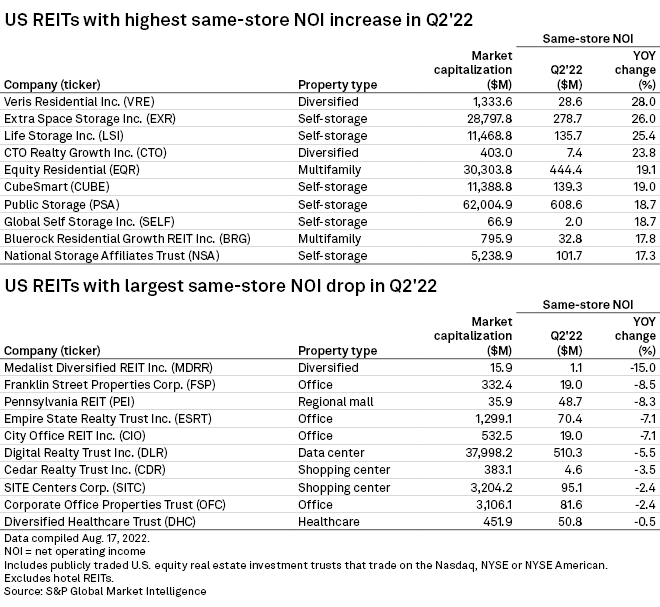
Same store NOI growth varied by property types and between individual REITs within each property type in Q2 2022. All 6 Self Storage REITs achieved SS-NOI growth greater than 17%, whereas performance was not as favorable for Office REITs such as Franklin Street Properties (FSP) at -8.5%, Empire State Realty Trust (ESRT) at -7.1%, City Office REIT (CIO) at -7.1% and Corporate Office Properties Trust (OFC) at -2.4% SS-NOI growth. Within some property types, however, there has been significant disparity of SS-NOI growth such as in Malls: Pennsylvania REIT (PEI) endured the 3 rd worst SS-NOI decline of all non-hotel REITs at -8.3%, whereas Mall REIT peers CBL Properties (CBL) (+1.6%) and Macerich (MAC) (+7.8%) achieved positive growth. This illustrates the importance of both property type allocation and individual stock selection in achieving positive alpha.
Be the first to comment