

00one/iStock via Getty Images
Dear Shareholder
The good news for our shareholders is that this bear market should likely hit us less hard than most and create the kind of bargains that have blessed our long-term performance.
The bear market of 2022 caught up to us in the 2nd quarter, much like a rip tide carries you out into the ocean. The Smead Value Fund (MUTF:SMVLX) fell sharply in absolute terms losing 13.33% versus a loss of 16.10% for the S&P 500 Index and a loss of 12.21% in the Russell 1000 Value Index. For the first half of the year, we tracked closely to the Russell 1000 Value Index with a loss of 12.92% versus a loss of 12.86%.
We were significantly better than the loss in the S&P 500 Index of 19.96%. We have warned that the S&P 500 Index would be mathematically challenged over the next decade and its challenges got off to the best (worst) start to the first half of the year since 1970.
For the quarter, our best-performing stocks were Continental Resources (CLR), Merck (MRK) and Occidental Petroleum (OXY). Despite a steep sell-off in June in the oil and gas stocks, two of our oil stocks made the quarterly list. Merck’s defensive characteristics and good news on earnings/growth didn’t shock us. We argued one year ago that Merck was historically cheap relative to the indexes as compared to the last 20 years.
Leading the downside were stocks we own tied to any economic optimism. Warner Bros. Discovery (WBD) suffered selling from AT&T (T) shareholders disposing of it upon distribution of the shares in the merger. We have been too optimistic about how long it would take for these uninterested parties to sell. Macerich (MAC) suffered from fears of what a recession and higher interest rates would do to their business, disregarding the recovery in the Class “A” mall space since 2020.
Target (TGT) got blistered by excess inventories as the consumers woke up from their COVID-19 hibernation and associated purchasing patterns. When we tell you that we hold winners to a fault, Target proves the downside of that practice. We view it as a very strong long-term hold.
|
PERFORMANCE |
Average Annualized Total Returns as of June 30, 2022 |
|||||||
|
One Month |
ǪTR |
YTD |
One Year |
Three Year |
Five Year |
Ten Year |
Since Inception (1/2/2008) |
|
|
SVFAX A Share Class (w/ load) |
-16.76% |
-18.32% |
-17.93% |
-10.74% |
9.13% |
10.15% |
12.75% |
8.56% |
|
SVFAX A Share Class (w/o load) |
-11.69% |
-13.34% |
-12.92% |
-5.29% |
11.30% |
11.46% |
13.42% |
9.01% |
|
SMVLX Investor Class |
-11.68% |
-13.33% |
-12.92% |
-5.28% |
11.31% |
11.44% |
13.45% |
9.12% |
|
SVFCX C Share Class |
-11.72% |
-13.46% |
-13.17% |
-5.82% |
10.98% |
11.24% |
13.35% |
9.05% |
|
SVFFX I1 Share Class |
-11.67% |
-13.28% |
-12.81% |
-5.05% |
11.60% |
11.73% |
13.75% |
9.36% |
|
SVFYX Y Share Class |
-11.65% |
-13.23% |
-12.74% |
-4.94% |
11.73% |
11.88% |
13.82% |
9.36% |
|
RUSSELL 1000 VALUE |
-8.74% |
-12.21% |
-12.86% |
-6.82% |
6.87% |
7.17% |
10.50% |
6.77% |
|
S&P 500 TR INDEX |
-8.25% |
-16.10% |
-19.96% |
-10.62% |
10.60% |
11.31% |
12.96% |
8.95% |
A Shares Gross Expense Ratio 1.26% C Shares Gross Expense Ratio 1.84% I1 Shares Gross Expense Ratio 0.99% Y Shares Gross Expense Ratio 0.84% Investor Gross Expense Ratio 1.26%
Performance data quoted represents past performance; past performance does not guarantee future results. The investment return and principal value of an investment will fluctuate so that an investor’s shares, when redeemed, may be worth more or less than their original cost. Current performance of the Fund may be lower or higher than the performance quoted. Performance data current to the most recent month end may be obtained by calling 877-807-4122.
Performance for SVFAX (w/load) reflects maximum sales charge of 5.75%. Performance for SVFAX (w/o load) does not reflect maximum sales charge of 5.75%. If reflected, the load would reduce the performance amount quoted. SVFAX imposes a 1.00% deferred sales charge on purchases of $1,000,000 or more that are redeemed within 18 months of purchases. Performance data does not reflect the deferred sales charge. If it had, returns would be reduced.
Investor Class shares of the Fund commenced operations on January 2, 2008. I1 Class shares of the Fund commenced operations on December 18, 2009. Performance shown for I1 Class shares prior to its inception reflects the performance of Investor Class shares. Class A shares of the Fund commenced operations on January 24, 2014. Performance shown for Class A shares prior to its inception reflects the performance of Investor Class shares, adjusted to reflect Class A expenses.
Smead Capital Management, Inc., The Advisor, has agreed to waive its fees and/or absorb expenses of the Fund to ensure that Total Annual Operating Expenses do not exceed 1.26% for Class A shares, 1.26% for Investor Class shares, 1.84% for Class C shares, 0.99% for Class I1 shares and 0.84% for Class Y shares respectively, through March 31, 2023. This operating expense limitation agreement can be terminated only by, or with the consent of, the Board of Trustees. See the prospectus for additional details.
Two-Headed Investment Monster
If you are wondering how we are outperforming the S&P 500 Index in the first half of the year, look no further than our top three performers. Occidental Petroleum (OXY), Continental Resources (CLR) and Conoco Phillips (COP) soared in value and were barely represented in the S&P 500 Index. To quote Jerry Jones, owner of the Dallas Cowboys, “We are in the first quarter on higher energy prices!”
On the downside, higher interest rates crushed real estate- oriented shares. The aforementioned Macerich (MAC), Lennar (LEN), the second-largest home builder, and Simon Properties (SPG) got roughed up this year. Simon and Lennar were big winners the prior two years for us.
The good news for our shareholders is that this bear market should likely hit us less hard than most and create the kind of bargains that have blessed our long-term performance. Continental’s majority owner, Harold Hamm, is offering to buy us out as minority shareholders and this would give us a huge cash position in the middle of what we believe will end up being a painful bear market. As we wrestle with the two-headed monster of unwinding financial euphoria and “wolverine inflation” leading to higher interest rates, stay tuned. As Sir John Templeton said, “If you can see the light at the end of the tunnel, you are too late.”
As we’ve hit the halftime mark for the investment year 2022, we are faced with a daunting two-headed monster. One head is the first full year of unwinding what Charlie Munger called, “the biggest financial euphoria episode in his career, because of the totality of it.” The second head is what we call “wolverine inflation,” which is mean and leaves a stench. This combination is powerful and, in many ways, unprecedented. How do we navigate a stock market which is dealing with a two-headed monster?
John Kenneth Galbraith, in his book, A Short History of Financial Euphoria, explained today’s circumstances quite well:
“That the free enterprise economy is given to recurrent episodes of speculation will be agreed. These – great events and small, involving bank notes, securities, real estate, art and other assets and objects – are, over the years and centuries, part of history.”
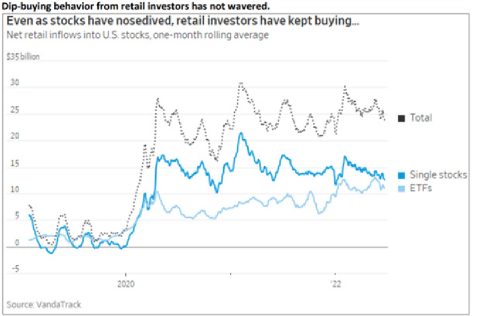
Munger, who has seen 75 years of these episodes, is looking at the last five years realizing that what happened to tech stock valuations became a financial euphoria episode. As a result of five consecutive years of record performance among the largest of the large-cap stocks, a mania developed among research analysts, portfolio managers and individual investors, believing that these FAANG stocks were a ticket to countless wealth. Investors, both institutional and individual, were trained like Pavlov’s dog in a “just buy the dips” mentality.
What has happened to second and third-tier tech stocks is a financial euphoria episode in and of itself. Munger recognizes that crypto became its own episode, as did clean energy investing, meme stocks, Robinhood trades, and IPOs and SPACs. This euphoria has manifested in participation/ownership of common stocks by households at levels only seen at the most major stock market tops of the last 100 years:
Source: Federal Reserve Data, Bloomberg. Data from 1/1/1952 – 1/31/2022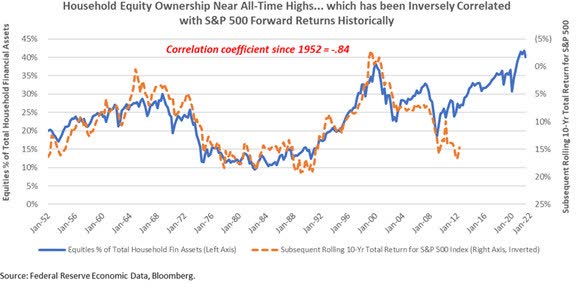
Simultaneously, the circumstances which could cause the Federal Reserve Board to lose control of inflation surfaced over a year ago. The Fed so hoped that the problem of inflation would go away that they dubbed it “transitory.” This explosion of price increases followed the pandemic just as the economic textbooks of my college years would have prescribed: Too many people with too much money chasing too few goods.
To deal with the pandemic war (COVID), the U.S. Government borrowed $6-7 trillion dollars and printed money. In tandem with this massive liquidity, 90 million millennial Americans started to form households and join adulthood for the first time. Then, as if we needed another inflation driver, our under-investment in energy was made glaringly obvious when Russia invaded Ukraine and caused the price of oil and gas to soar.
While ESG investing has soared in popularity:
Source: Principles for Reponsible Investing.. Data from 1/1/2006 – 12/31/2020.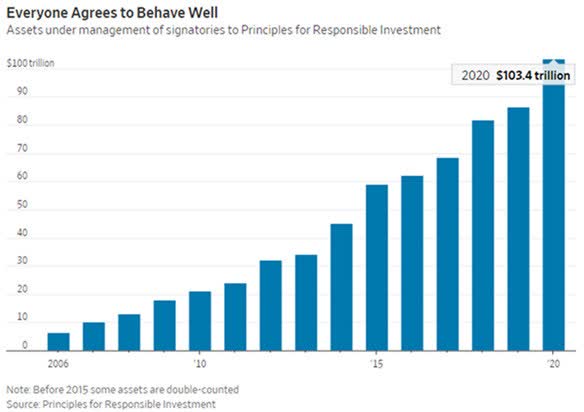
Investments in oil and gas disappeared:
Source: Bloomberg. Data from 3/1/2019 – 3/31/2022.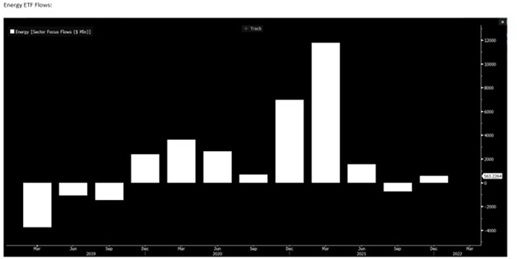
Therefore, inflation has reached 8.6%, and the on-the-ground inflation rate in many cities is most likely even higher. In an effort to make up for their error of one year ago, the Fed is now raising the federal funds rate aggressively and pulling its buying of bonds in the open market. Unfortunately, the proverbial cat has been let out of the bag and this wolverine inflation animal is especially hard to get back into its high-elevation cave.
Action plan for the Two-Headed Monster
“Anyone taken as an individual is tolerably sensible and reasonable—as a member of a crowd, he at once becomes a blockhead.”
—Friedrich Von Schiller, As quoted by Bernard Baruch
Our plan for dealing with the unwinding of the financial euphoria episode is the same as the plan we had before it began to unwind. You avoid the areas which were part of the euphoria and don’t try to be a hero:
The five-year chart below compares the returns of the S&P 500 Index, the S&P Global Clean Energy Index, the ARK Innovation ETF NAV Index and the Russell 1000 Value/Growth Total Return Index:
Source: Bloomberg. Data from 12/31/2016 – 12/31/2021..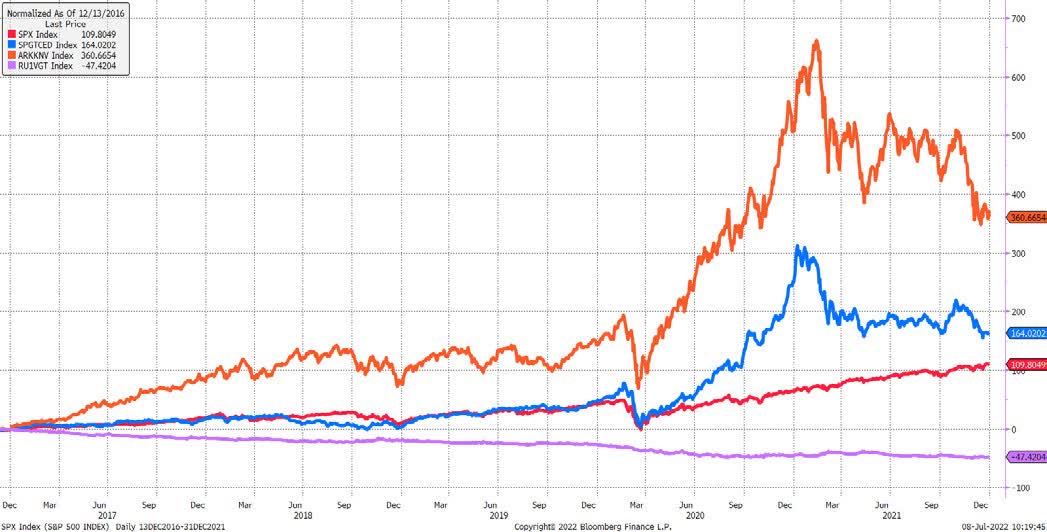
Source: Bloomberg. Data from 12/31/2016 – 12/31/2021..
We believe you need to avoid these formerly glamorous stock groups for many years. We loved to use eBay (EBAY) as a poster child back in 1999 for the dotcom bubble. We bought it eight years later and have done very well on it. We wouldn’t have done well if we bought it in the early years of that bear market, or even five years later. If you think this bear will be shorter and or less damaging than the dotcom bear market of 2000-2003, you could be showing your inexperience!
Where do we believe we can make money in the next two years?
Source: Bison Interests, Marketwatch.com, NYU Stern, National Association of REITS, Kenneth French (Tuck/Dartmouth)..Data from 1/1/1971 – 12/31/1981..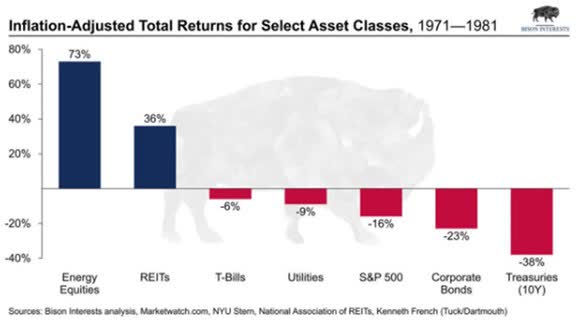
We are very excited about the zeitgeist which will develop as wolverine inflation emerges as a more permanent problem. Investors will chase companies that benefit from 90 million millennials replacing 65 million Gen-X Americans in the key 27–45-year-old age group. The 1970s were all about household formation among baby boomers and the liquidity created by the Federal Government to fight the Vietnam War and to fight poverty, with President Johnson’s Great Society legislation in 1968.
Household formation among millennials should drive a big increase in necessity spending, at the expense of discretionary spending. The stocks which did well from 2010-2019 were all about single people spending money on non-necessity personal pleasures. Necessity spending among the 27–45-year-old group could encourage investment success in oil and gas, real estate and residential housing.
The biggest problem investors have is their willingness to invest in former darlings being crushed by the first six months of this bear market. This bear market won’t die until there is a capitulation in the money flows into darling tech stocks, crypto and other speculative investments covered by Friedrich Von Schiller.
As we wrestle with the “Two-Headed Investment Monster” and position ourselves to benefit from “Wolverine Inflation,” we ask for your patience, thank you for your confidence in our discipline and always suggest that investors fear stock market failure!
Bill Smead, Lead Portfolio Manager
Cole Smead, CFA, Co-Portfolio Manager
Editor’s Note: The summary bullets for this article were chosen by Seeking Alpha editors.
Be the first to comment