

EUR/USD Price, Chart, and Analysis
Recommended by Nick Cawley
Get Your Free EUR Forecast
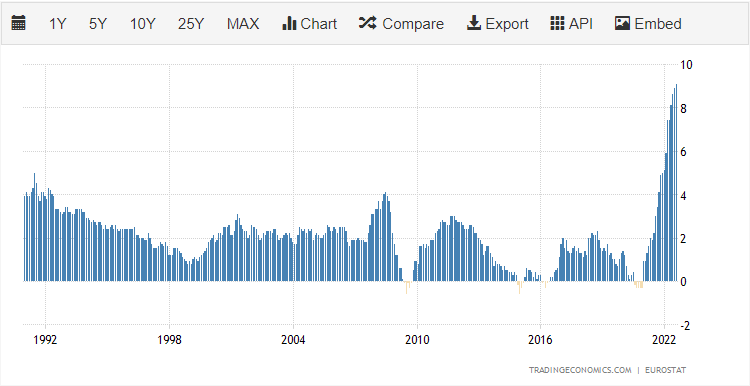
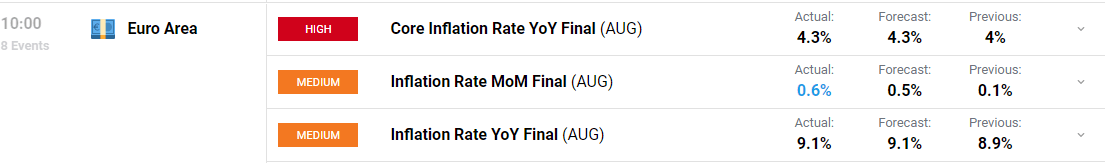
Euro Area headline inflation (August) was confirmed at 9.1% today, a fresh record high. Energy prices continue to rise, along with food, alcohol and tobacco, and services. On a monthly basis, consumer prices rose by 0.6%, a fraction higher than the preliminary reading of 0.5% and a prior reading of 0.1% in July.
Chart via TradingEconomics.
For all market-moving economic releases and events, see the DailyFX Calendar
Next week sees four major central banks announce their latest monetary policy decisions, with Wednesday’s FOMC release arguably the most important of them all. Market expectations of a super-sized 100 basis point hike rose sharply earlier this week after the latest US inflation data showed price pressures increasing further. One week ago, it was doubtful if anyone would have suggested that the Fed would hike by one point but the market now sees a 24% chance of an oversized hike next week.
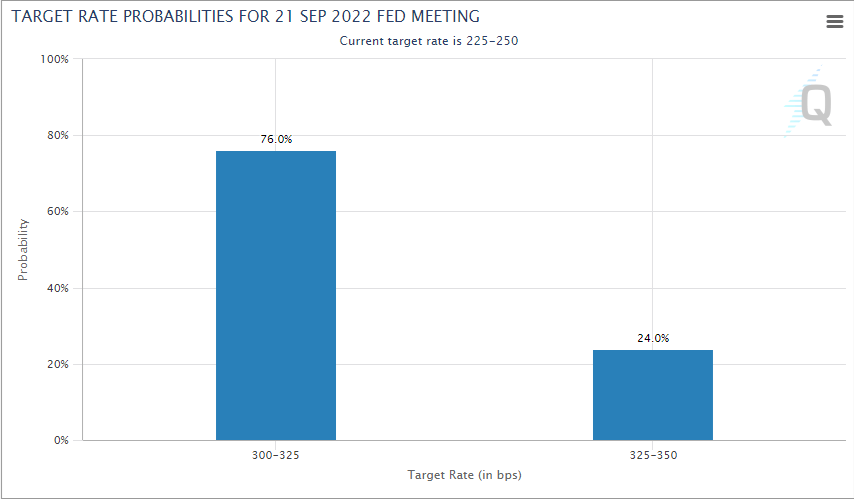
Chart via CME Group
EUR/USD has been trading on either side of parity (1.0000) over the last month as buyers and sellers jockey for control of the pair. Commentary from ECB officials remains hawkish with further front loading of rates hikes regularly mentioned. The next ECB monetary policy meeting is nearly six weeks away (October 27) and if the Fed does raise rates by 100 bps, or raises by 75bps with a hawkish view, EUR/USD looks set to fall further.
Interest rate expectations in the US have climbed further this week. The rate-sensitive UST 2-year is currently offered with a yield of 3.90%, up from around 3.44% one week ago, and is back at levels last seen 15 years ago.
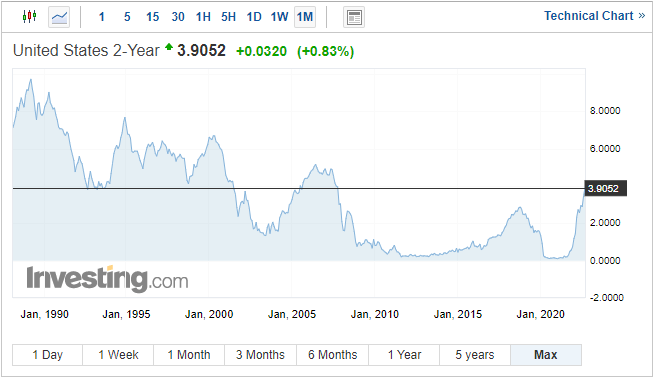
Chart via Investing.Com
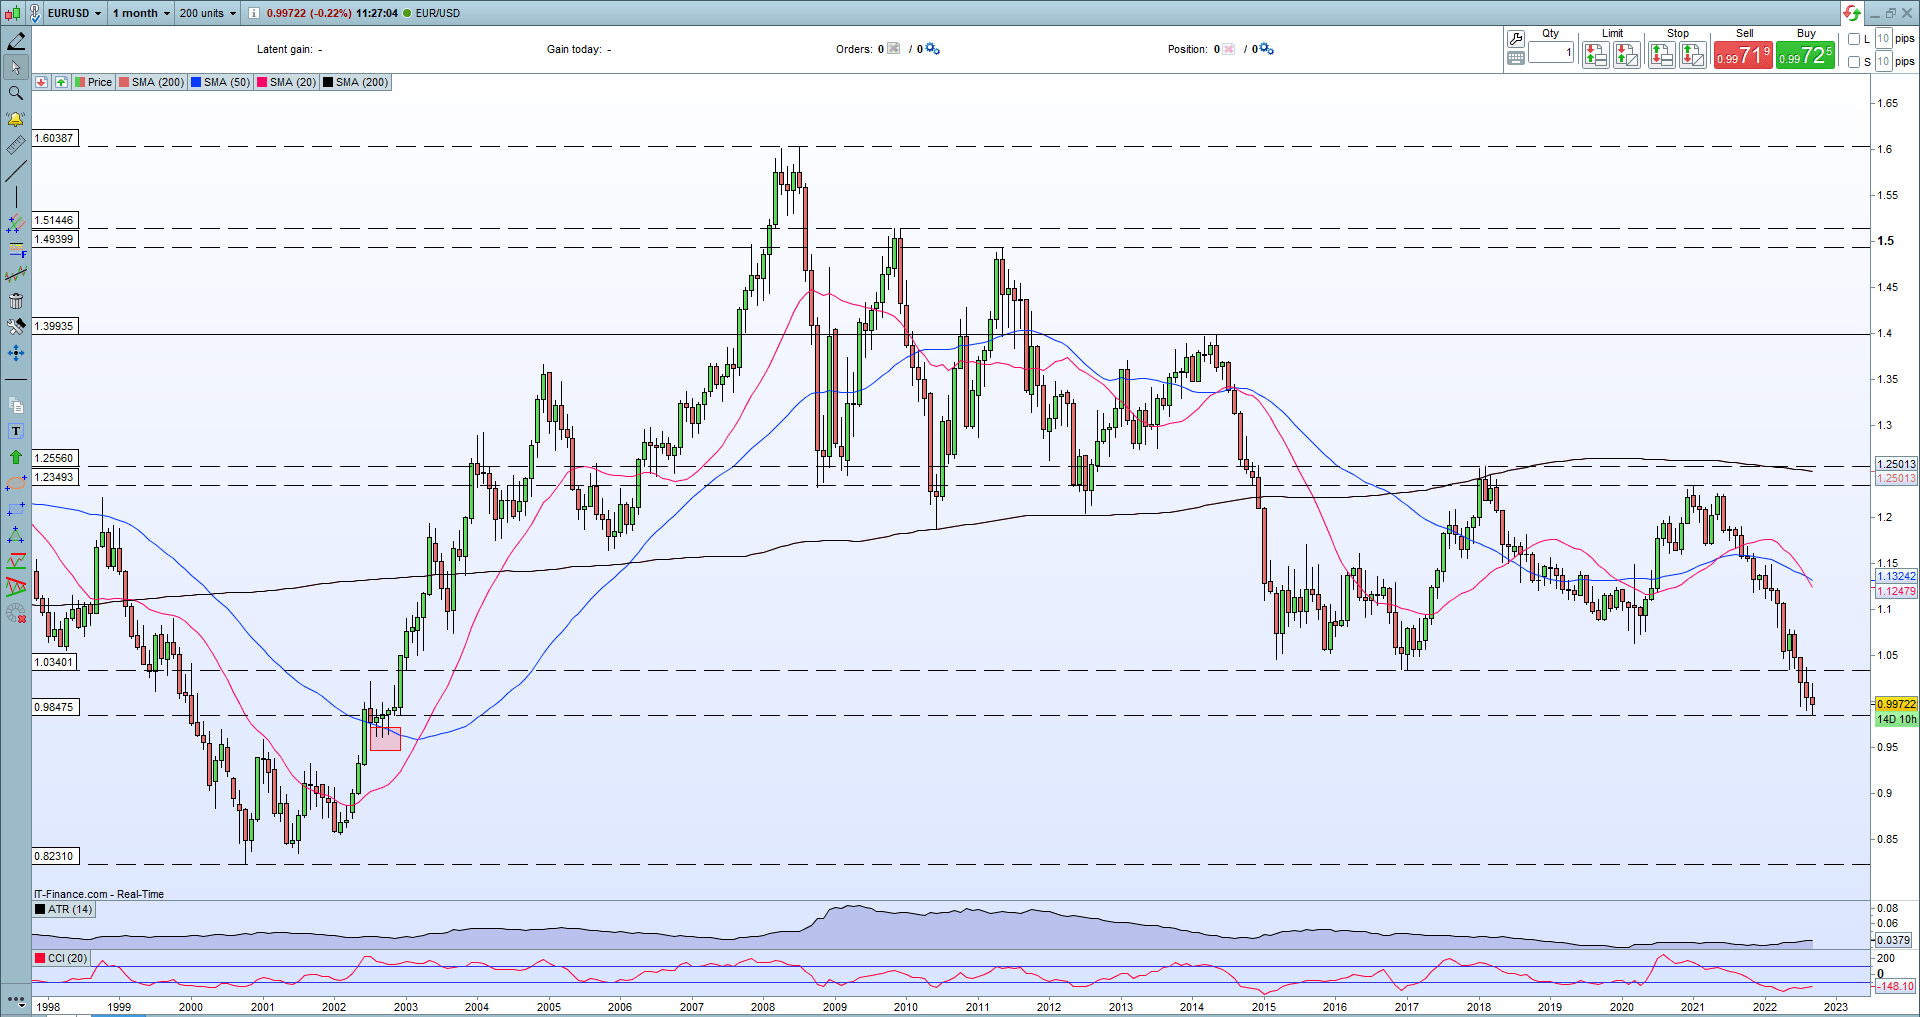
To find the next levels of support for EUR/USD we need to look at a longer-term (monthly) chart. Going back to August 2002, the chart shows three candles with lows around 0.9610, and this zone may be the next stopping point if EUR/USD continues its trend lower. In the longer-term, and unless the ECB gets to grips with its ongoing inflation/growth dilemma, a complete re-trace back to the October 2001 low at 0.82310 cannot be discounted.
EUR/USD Monthly Price Chart September 16, 2022
Retail trader data show 61.90% of traders are net-long with the ratio of traders long to short at 1.62 to 1.The number of traders net-long is 9.82% lower than yesterday and 8.62% higher from last week, while the number of traders net-short is 12.96% higher than yesterday and 7.90% lower from last week.
We typically take a contrarian view to crowd sentiment, and the fact traders are net-long suggests EUR/USD prices may continue to fall. Positioning is less net-long than yesterday but more net-long from last week. The combination of current sentiment and recent changes gives us a further mixed EUR/USD trading bias.
| Change in | Longs | Shorts | OI |
| Daily | -7% | -5% | -6% |
| Weekly | 11% | -11% | 2% |
What is your view on the EURO – bullish or bearish?? You can let us know via the form at the end of this piece or you can contact the author via Twitter @nickcawley1.
Be the first to comment