

Robert Way
Introduction
My thesis is that BYD (OTCPK:BYDDY) is taking off with respect to sales of battery electric vehicles (“BEVs”).
At the time of this writing, 1 RMB is about $0.14.
The Numbers
Looking at sales volume from July, August and September, BYD sold 80,991, 82,678 and 94,941 BEVs, respectively, which comes to 258,610 for the third quarter and the substantial majority of these were in China. Meanwhile, Tesla (TSLA) delivered 343,830 BEVs globally in the third quarter. CnEVPost shows the way in which BYD BEV sales have grown over the years:
BYD BEV Sales (CnEVPost)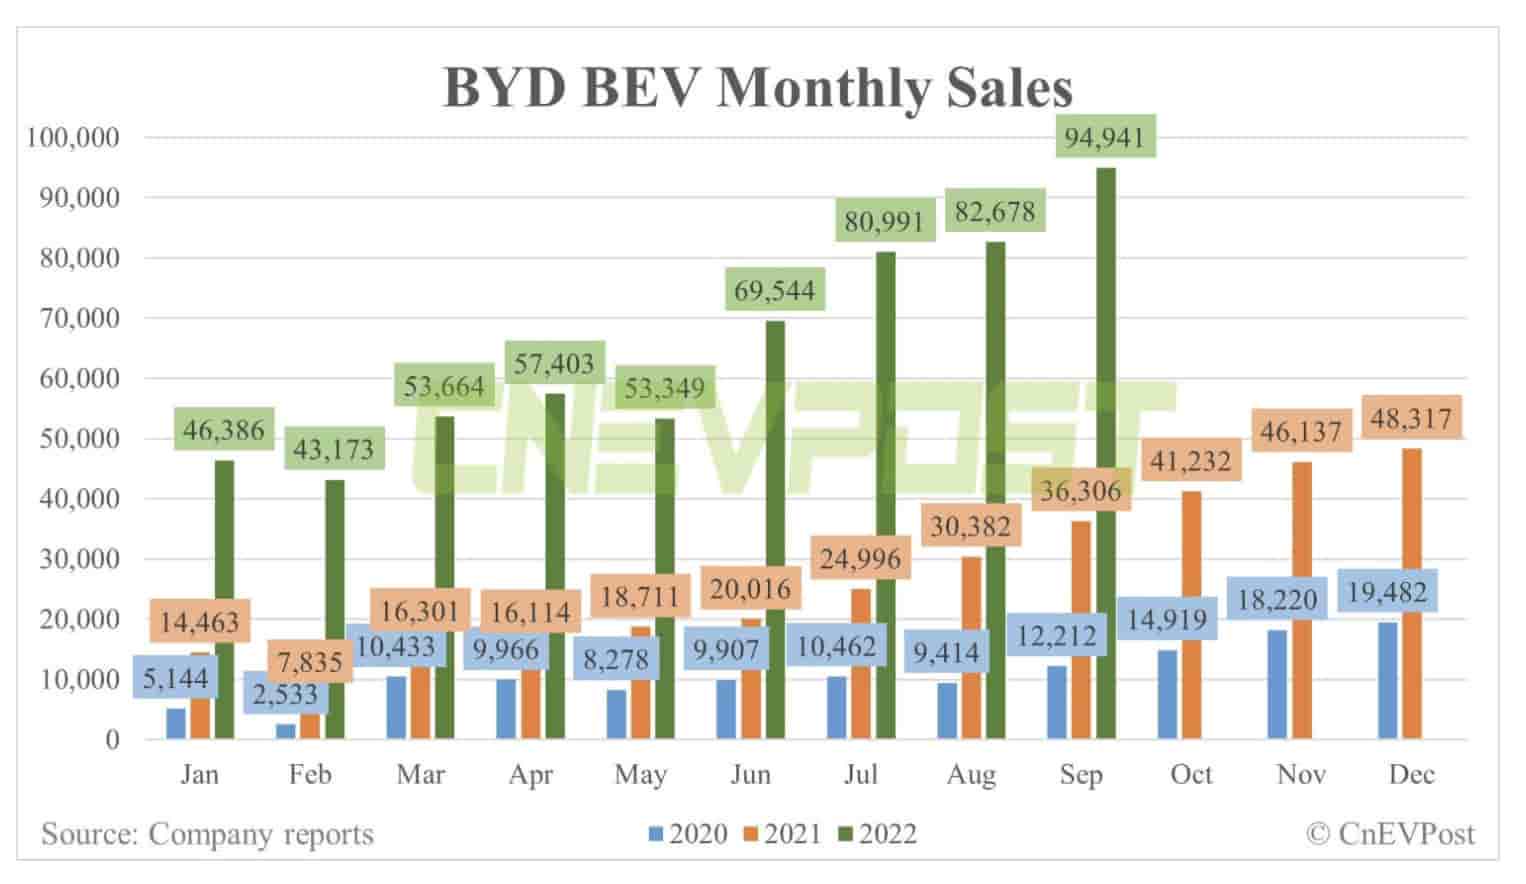
BYD’s September sales of 94,941 BEV units was 162% higher than the September 2021 total of 36,306! Regarding the substantial majority of BYD’s BEVs being sold in China above, Electrek reports that BYD only sold 7,736 vehicles outside China in September but the breakdown for this figure between plug-in hybrid electric vehicles (“PHEVs”) and BEVs is not given.
BEVs are selling like crazy in China per CnEVPost and we know from the numbers above that BYD is a substantial portion of the totals:
China BEV Sales (CnEVPost)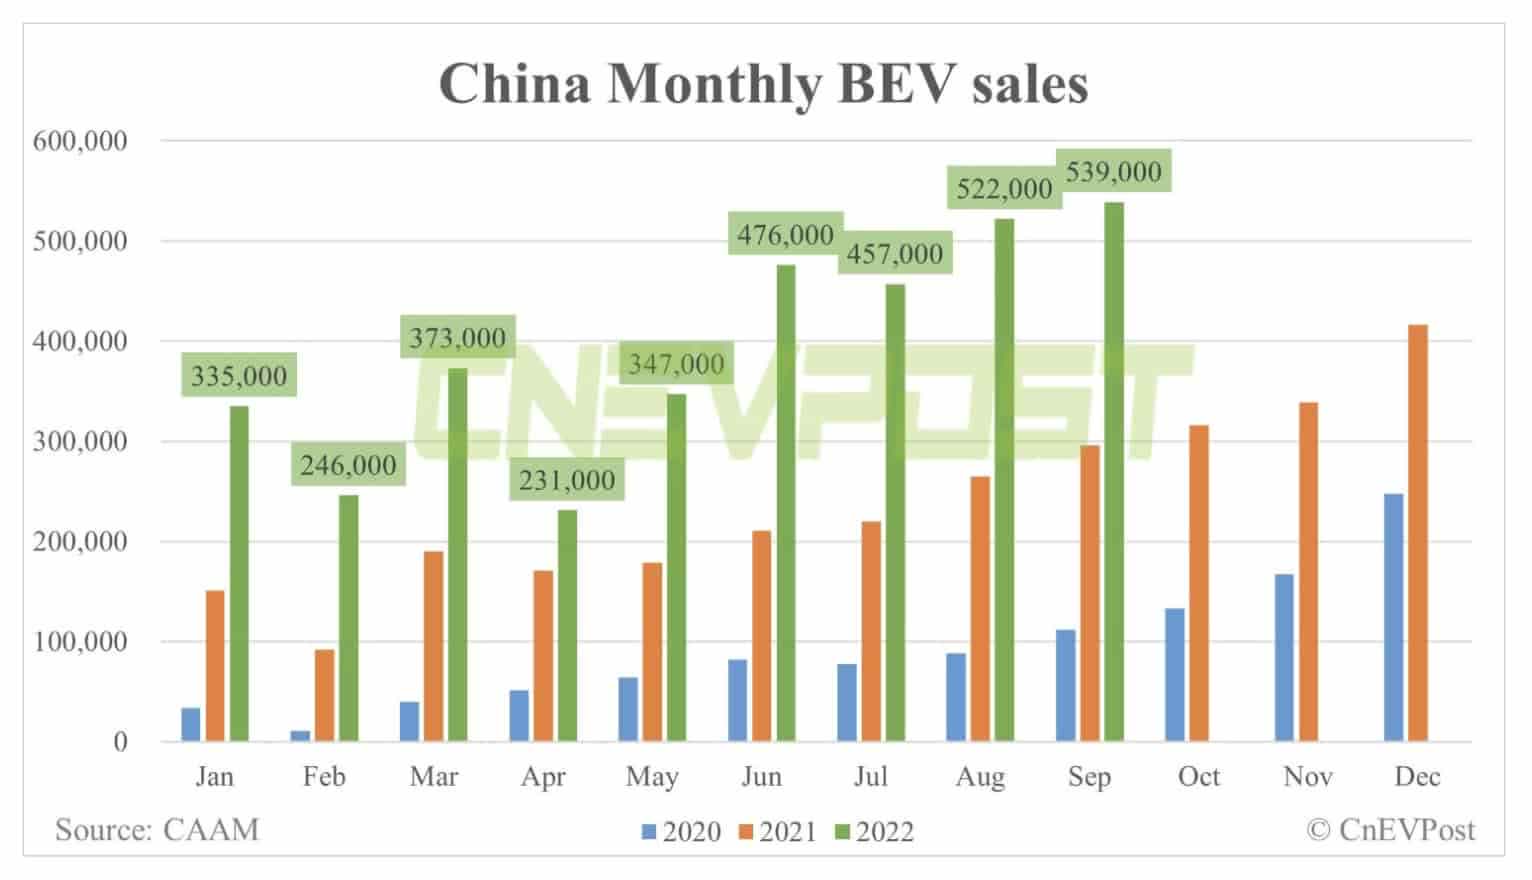
As we saw above, Tesla is ahead of BYD on a global level but BYD dominates in China. Citing a tweet from @heydave7, Teslarati shows that Tesla delivered about 120,000 cars in China during 3Q22:
Tesla China Deliveries (Teslarati)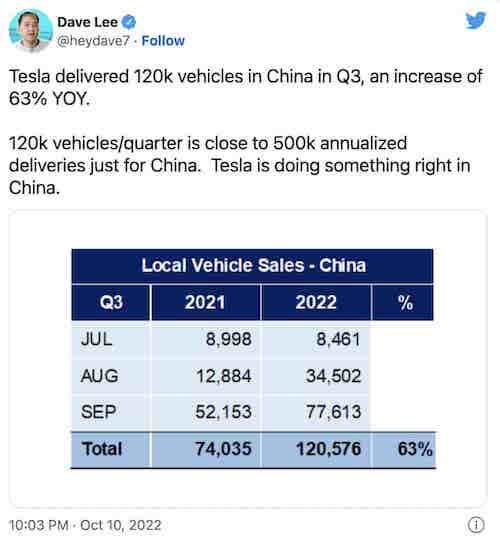
Another serious player with BEVs in China on a unit basis is the SAIC GM (GM) Wuling but their mini cars are apples and oranges in many respects. For example, Fiat Group World shows that the Wuling Mini EV looks kind of like a golf cart relative to the Tesla Model Y. Also, WIRED reports that the profit on each Wuling Hongguang Mini EV is just $14:
Wuling Mini Size Comparison (Fiat Group World)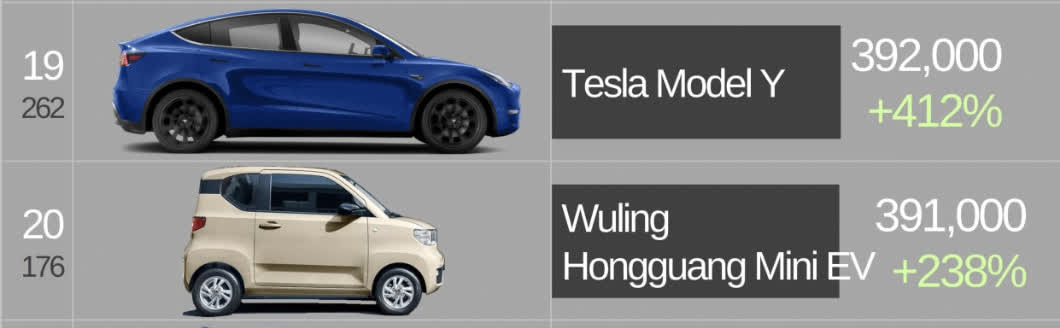
As we see from the picture above, the Wuling Mini is much smaller than other BEVs. Here is a comparison with the BYD Han and the Tesla Model Y with respect to length in mm:
4,980 mm BYD Han per Electric Vehicle Specs
4,751 mm Tesla Model Y per Tesla
2,920 mm Wuling Mini per Chinapev.com
The Wuling mini numbers are still noteworthy despite the considerations above. GM reports that the Wuling Hong Guang MINIEV had sales of over 108,000 units in the third quarter.
Per EV-volumes, BYD’s 1H22 BEV sales in green were already strong before the record third quarter. The growth from 1H21 to 1H22 for SAIC GM Wuling and others is modest compared to what we’ve seen for BYD:
Global EV Sales (EV-volumes)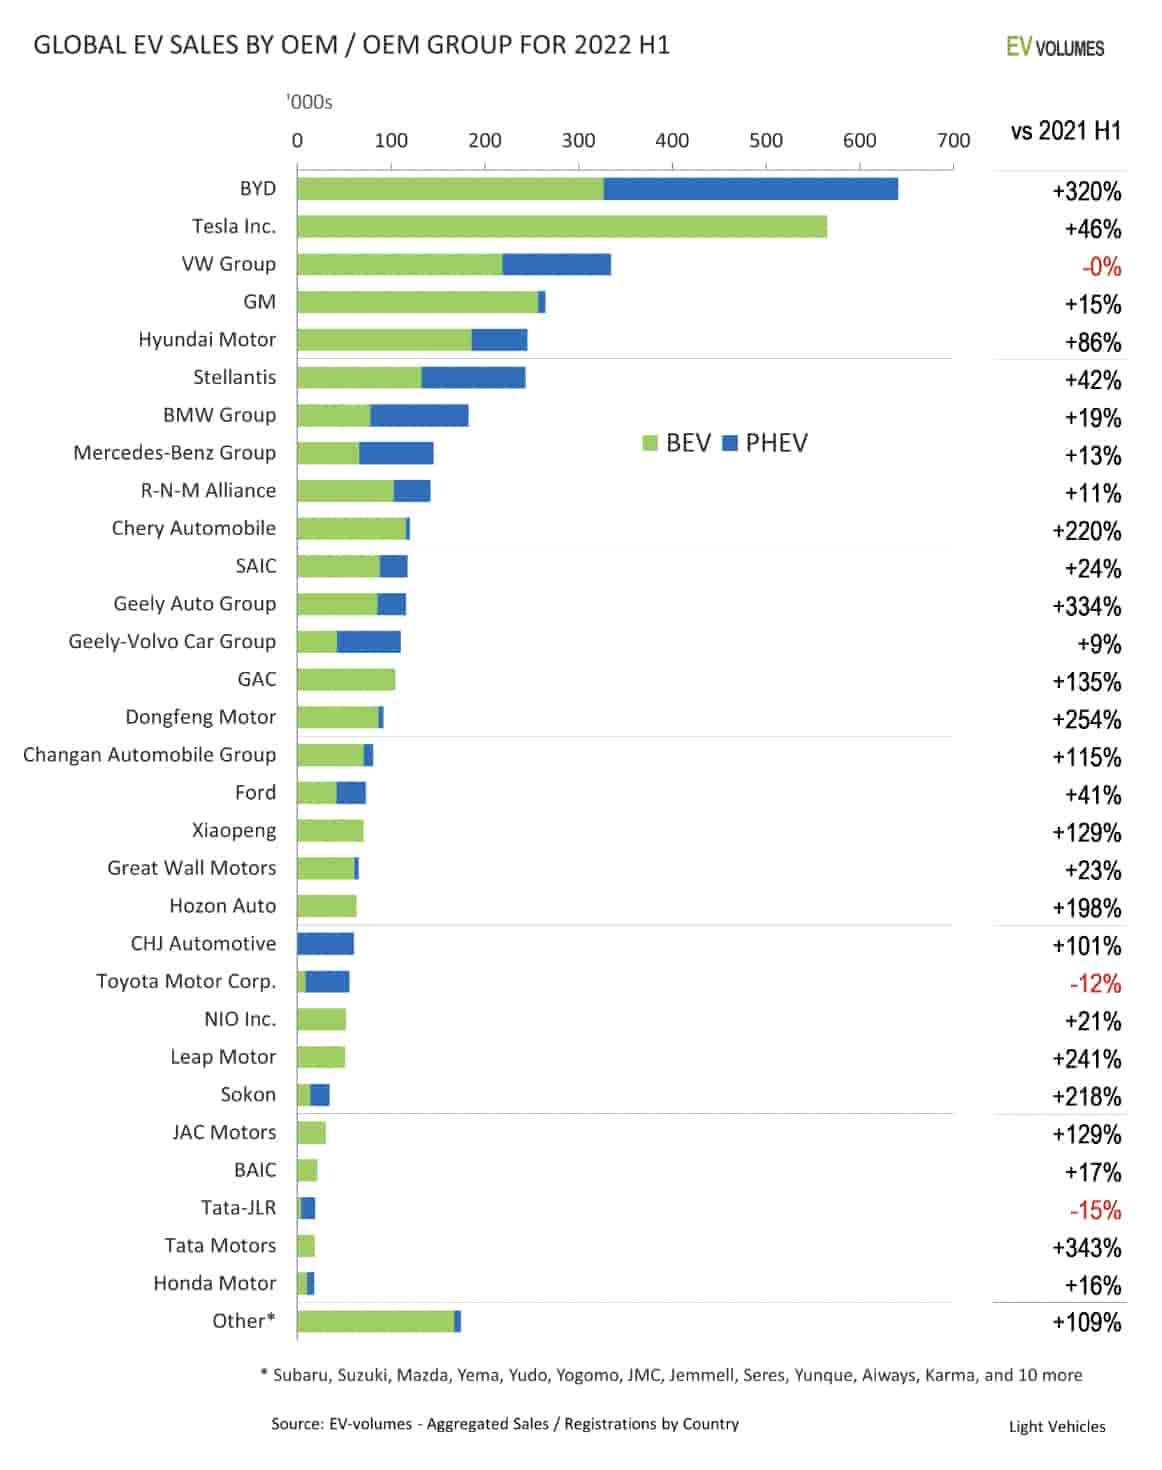
BYD Stock Valuation
Looking at the 3Q22 estimated results, BYD expects 9M22 earnings to shareholders to be RMB 9,100 million to RMB 9,500 million relative to RMB 2,443.11 million for 9M21. Earnings to shareholders after deducting nonrecurring profit or loss are expected to be RMB 8,100 million to RMB 8,800 million for 9M22 relative to RMB 886.41 million for 9M21.
This means trailing-twelve-month (“TTM”) earnings to shareholders should be RMB 9,702 million to RMB 10,102 million. We arrived at this range with a little addition which is 9M22 + FY21 – 9M21 or RMB 9,100 million + RMB 3,045 million – RMB 2,443 million to RMB 9,500 million + RMB 3,045 million – RMB 2,443 million. Note that the FY21 figure comes from the 2021 annual report. I like using the midpoint which is about RMB 9.9 billion which is nearly $1.4 billion. Earnings are expected to climb over the years so it’s hard to say what such a business is worth today.
We know the market cap was about $100 billion at the end of 2021. This is because the Berkshire Hathaway (BRK.A) (BRK.B) letter to shareholders in the 2021 annual report says that their BYD position was $7,693 million at the end of the year. BYD’s 2021 annual report says Berkshire’s 225 million H shares represented 7.73% of BYD’s capital at the end of 2021. Doing a little algebra, $7.7 billion * 100/7.73 comes to about $100 billion. Yahoo finance shows that BYDDY closed at $67.50 on December 31st.
A June 2021 Seeking Alpha article gives us more data points with respect to the market cap. Citing Citi, the article notes that the BYDDY ADR has a 2:1 ratio to regular shares. In other words, 2 BYDDY ADRs represent 1 regular share. Combining A shares with their H share equivalents, BYD’s 2022 interim report shows a total of 2,911,142,855 shares. We divide this in two and then multiply by the October 25th BYDDY share price of $47.34 to get a market cap of $69 billion. Knowing that the $69 billion is about 30% lower than the $100 billion range of the end of 2021, we can do a sanity check and see that the share price is down about 30% from the end of 2021 as well.
I don’t know if Mr. Market is right about this valuation or not. I’m sure some investors are polemical given the high P/E ratio of 50 or $69 billion/$1.4 billion.
Be the first to comment