

Torsten Asmus/iStock via Getty Images
By Bill Zox, CFA, John McClain, CFA, and Jack Parker, CFA
Peak inflation, peak bearishness, peak hawkishness… investors have become obsessed with calling peaks. Let’s hope we have reached a peak in calling peaks. However, some peaks are more important than others.
Peak inflation is a step toward returning inflation to the 2% range but, assuming we have seen peak inflation, the hard work is still ahead of us. Peak bearishness is a function of mass psychology, which can change on a moment’s notice.
Peak hawkishness bears some relationship to the point at which high yield bonds start to rapidly make up the underperformance incurred during the earlier stages of a Federal Reserve (Fed) rate hike cycle compared to leveraged loans.
While we may not have reached peak hawkishness yet, that indicator is only one part of the story. Our more nuanced and holistic view of the cycle, beyond just peak hawkishness, leads us to believe that high yield’s outperformance relative to leveraged loans over the last several months is likely to continue. So, we will plant our stake in the ground and call the peak in loan outperformance compared to high yield.
Loans Shine in the Early Stages of Fed Hiking Cycle Until Focus Shifts Elsewhere
As a Fed hiking cycle nears, the focus turns to how high the federal funds rate may go, and money typically rushes into loans. The simple – and we believe simplistic – analysis is that rising front-end Treasury yields reduce the value of fixed-rate high yield bonds but have little impact on floating-rate loans.
In recent years, loans have had brief periods of outperformance over high yield during this phase. However, as soon as investors began to focus on something other than Fed rate hikes, money came rushing out of loans, and high yield made up the underperformance within a couple of quarters.
High Yield Has Dominated Loans over the Long Term and in Most Periods
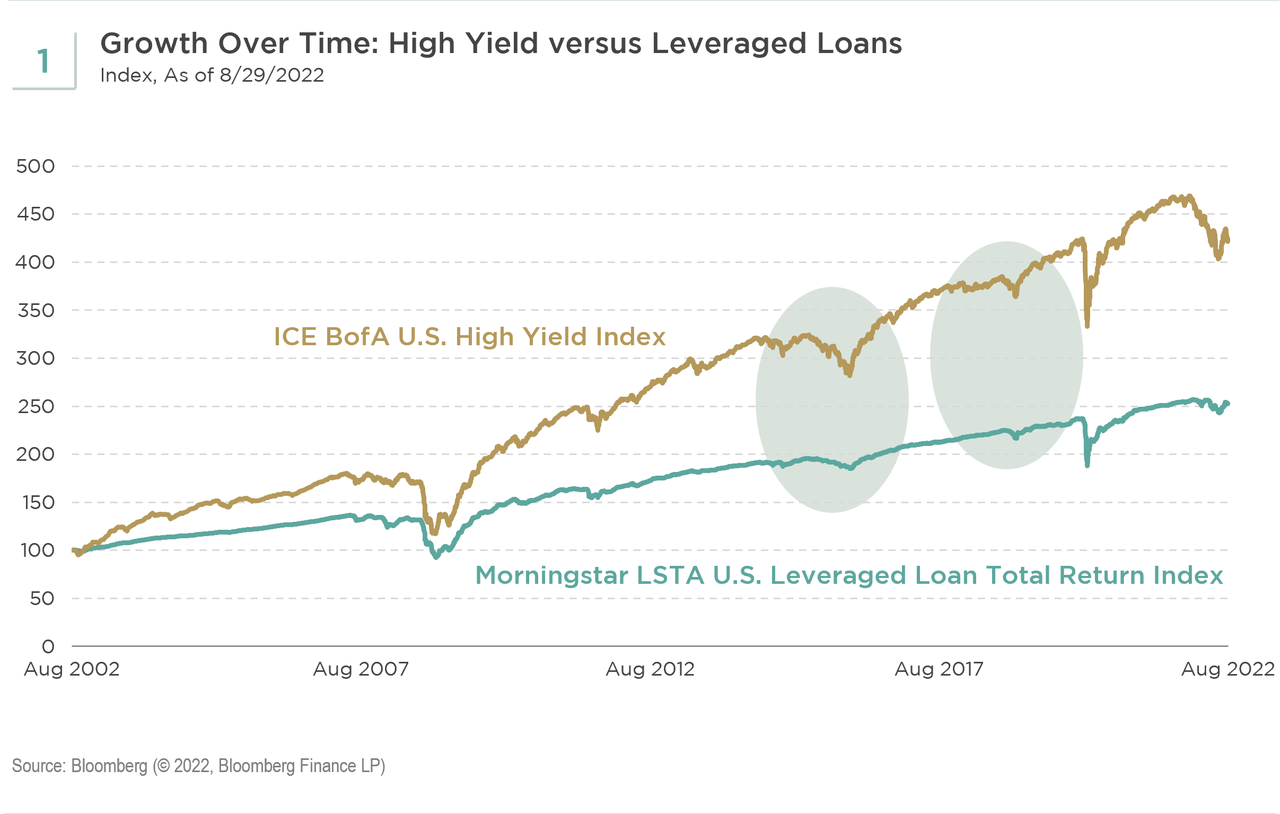
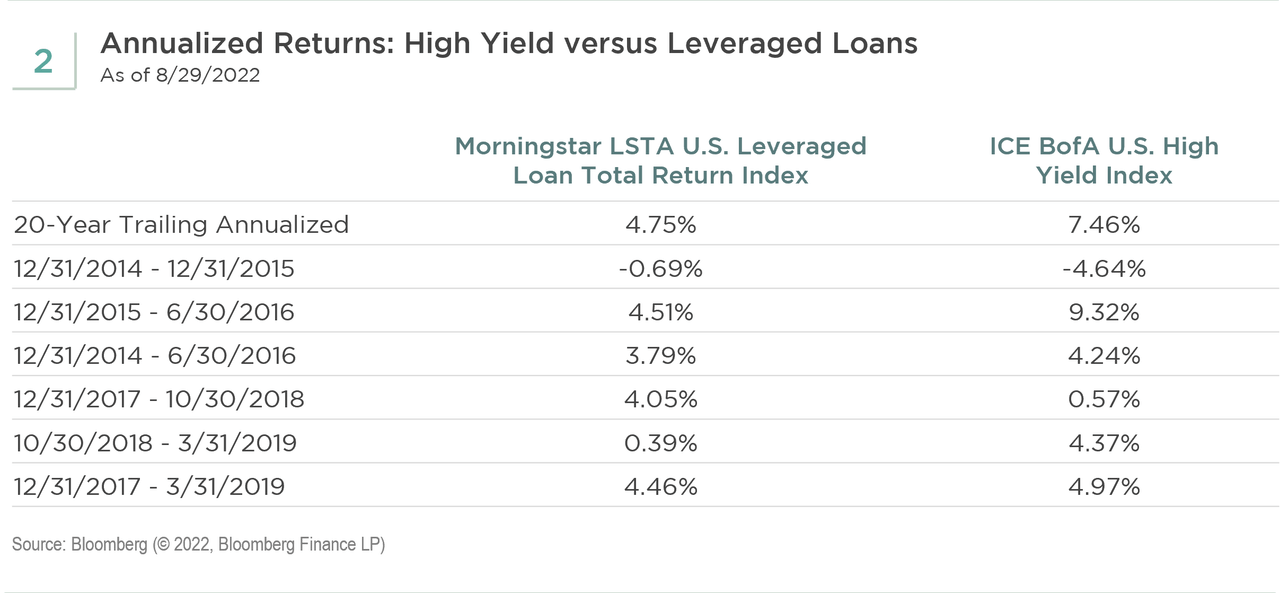
Let us start with some history. High yield has generated much higher returns than loans over long periods of time even though loans had comparable drawdowns during the Global Financial Crisis (GFC) and the COVID bear market. High yield has outperformed loans by about 275 basis points per year for the trailing 20 years (see Figure 1 and 2).
High Yield Made Up Underperformance Compared to Loans in a Couple of Quarters
In 2018, loans outperformed high yield by about 350 basis points through October 30. By the end of the first quarter of 2019, high yield made up all of that underperformance and more. This was the end of a rate hike cycle.
Through October 2018, the market was discounting quarterly rate hikes. Over the next two months, the market stopped discounting any further rate hikes and started to contemplate a rate cut.
Inflation was low, and higher interest rates were pressuring the economy and financial assets. Around the end of 2018, the Fed pivoted to a much more dovish stance, but loans had already peaked relative to high yield two months earlier over increased concerns that Fed policy was too tight.
In 2015, loans outperformed high yield by about 400 basis points. This was the beginning of the rate hike cycle. After a year and a half of consternation, the first hike came in December 2015. The focus, however, quickly shifted to credit quality rather than rising rates.
This time the outperformance of loans compared to high yield peaked when high yield bottomed on February 11, 2016. High yield more than caught up by the end of June 2016 as the recovery came into focus and rate hikes receded into the background. By the end of the second quarter of 2016, high yield more than made up all the underperformance.
Four Phases of the Leveraged Finance Cycle
We see four phases to the performance of loans versus high yield around a Fed hiking cycle:
Phase 1: Rates rise to interest rate floors on loans
The first phase runs from the time the market starts to anticipate rate hikes until any interest rate floors on the loans are eclipsed. For example, if the reference rate is zero, and every loan has a 75 basis points interest rate floor, the loan interest rate does not float higher on the first 75 basis points of interest rate hikes.
This was the issue in 2015. Even though the rate hike cycle began in December 2015, it was 15 months before the federal funds rate reached 75 basis points and two years before it reached 150 basis points.
Phase 2: Loan rates float higher, but interest coverage is still adequate
The second phase is when loan interest rates are floating higher in conjunction with rising rates, but borrowers still have adequate interest coverage to justify their credit spreads. The investors benefit from higher interest rates, and the borrowers are strong enough to handle the higher interest payments.
Phase 3: Higher rates constrict borrowers
In the third phase, loan interest rates continue to float higher, but the borrowers’ interest coverage declines to a point that their credit spreads are too narrow. This situation could be a result of higher interest expense and also declining earnings as higher rates negatively impact the economy.
Phase 4: The start of rate cuts is more detrimental to loans
The fourth phase begins when the Fed starts to cut the federal funds rate. This phase can be particularly difficult for loans as investors are faced with declining interest income at the same time that credit quality is deteriorating.
While the credit quality of high yield bonds is also under pressure in phase four because the interest payments are fixed, they do benefit from the lower federal funds rate.
Depending on the nature of the cycle and how forward-looking the market is, peak hawkishness can occur during any of the four phases. We believe an understanding of the four phases is more helpful than a narrow focus solely on peak hawkishness.
Loan Outperformance Was Dramatic through June 16, but Has Started to Reverse
This year, loan outperformance compared to high yield was close to 1,000 basis points at its peak on June 16. Since then, high yield has outperformed loans by about 120 basis points. In retrospect, June 16 was probably not peak hawkishness but the point at which the market became more focused on the third and fourth phases of the cycle.
In recent days, loans have outperformed again as the market has been discounting more rate hikes, but we believe this reversal presents an even better opportunity to shift from loans to high yield.
To return inflation to the 2% area, it is clear that phase three is likely in the near future. The question then becomes how high yield will compare to loans in the third and fourth phases of the cycle and on an absolute basis.
High Yield Credit Quality Is Much Higher than Loans
The common misconception is that the loan market is higher quality than the high yield market because loans are typically secured while high yield bonds are more often unsecured. We believe that perception ignores important changes to the two markets in recent years. We expect loan default rates to be higher than high yield bond default rates in the next recession.
As shown in Figure 3 below, over the last ten years, high yield credit quality improved significantly, with the market becoming much more concentrated in BB-rated securities – over 50% of the index is currently BB-rated. Meanwhile, leveraged loan credit quality has deteriorated to become much more of a B-rated market, with less than 25% of the index rated BB.
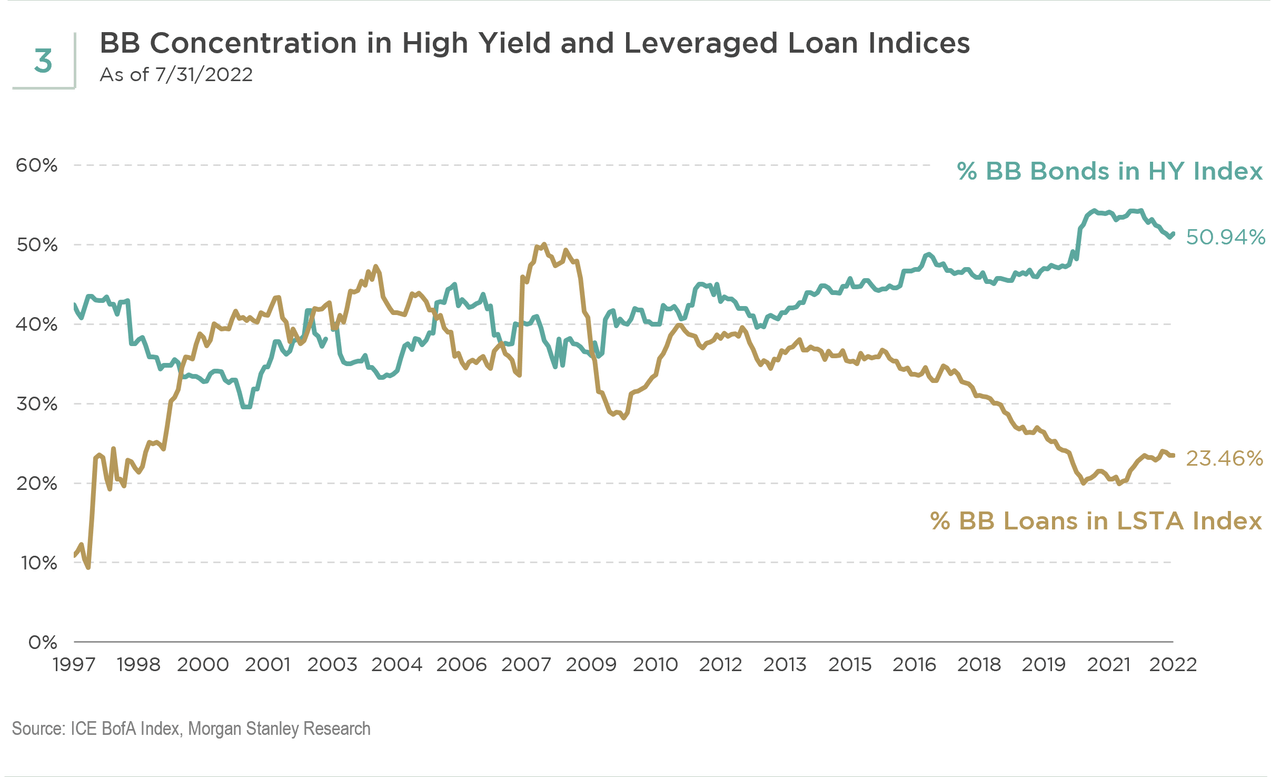
Based on history, we put the range of BB defaults during a recession as 1-3%, trending toward or even below the low end of that range over the last 20 years. In contrast, we use a range of 10-15% for B defaults in a recession.
Furthermore, we believe the high yield market has migrated to larger businesses that more often have publicly traded equities while the loan market generally is comprised of smaller businesses with privately owned equity. Private equity is a larger player in the loan market and especially adept at shifting value away from lenders and bond holders.
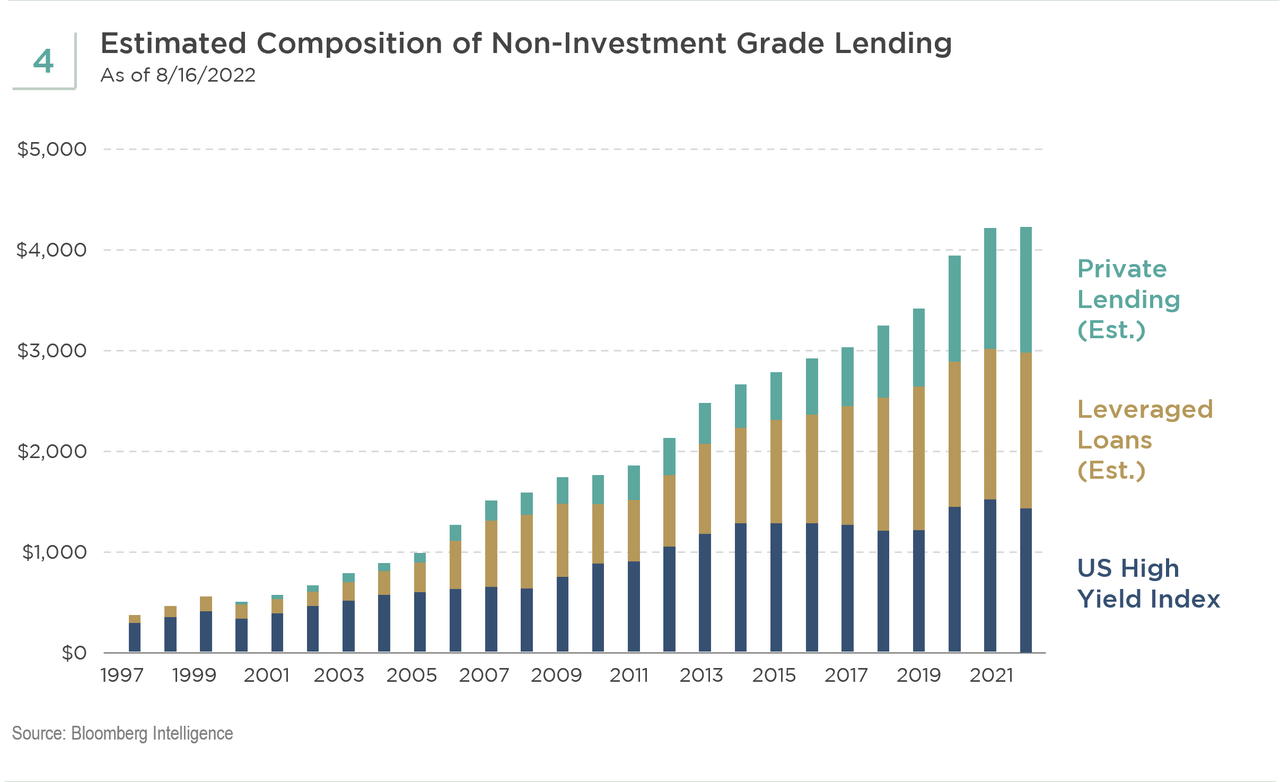
Figure 4 below shows the growth and composition of the leveraged finance market over time. In the early 2000s recession, high yield was the dominant part of the market. Since that time, loans and private credit have become much larger parts of the market.
We believe the stronger credits, meaning those that are generally larger, better managed businesses with more conservative capital structures and better access to capital, have migrated to the high yield market while the weaker credits are more often in the loan and private credit markets.
High Yield Credit Quality Is Much Higher than in Prior Cycles
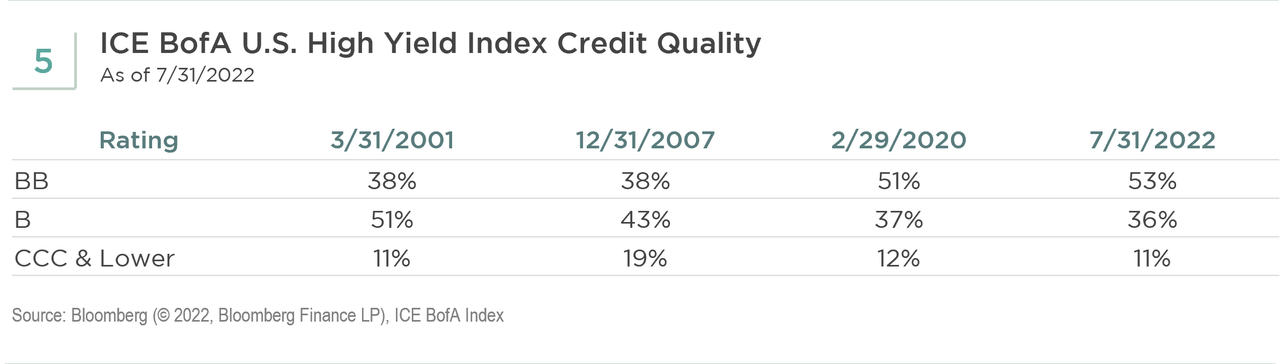
High yield also has become much more of a BB-rated market compared to its own history (see Figure 5). During the GFC, BB-rated bonds were 38% of the high yield index compared to 53% today.
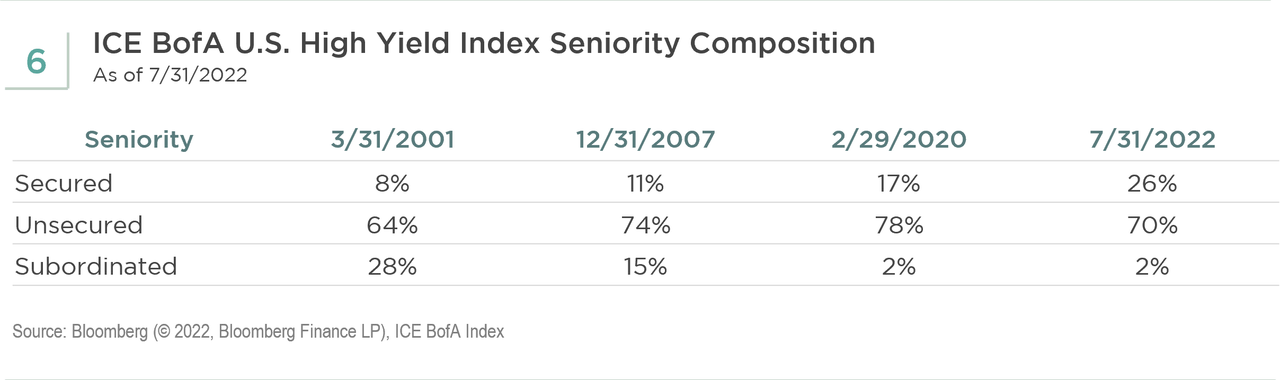
High yield seniority also has improved dramatically over time. Subordinated bonds were 28% of the market heading into the 2001 recession and 15% heading into the 2008 recession. Now, subordinated bonds account for only 2%. Secured bonds were 8% to 11% of the market prior to the 2001 and 2008 recessions, respectively, but are now 26%.
We Would Exit Loans and Leg into High Yield
In our last blog post, “High Yield Is Not a Meme Stock,” we made the case for why we believe a 700-basis point spread in high yield today may be equivalent to a 900-basis points spread in prior cycles. We have even more conviction in that judgment today.
In late June and early July, the high yield spread was just below 600 basis points, and the yield-to-worst was just below 9%. First, these levels attracted capital to the high yield market from non-U.S. institutional investors and dislocation credit funds. Then, money began to exit loans at an accelerating pace, some of which entered the high yield market.
We are not calling a bottom in the high yield market. However, we continue to believe that it is compelling compared to loans and that it makes sense to leg into high yield on an absolute basis. While we are closer to a 500-basis points spread and 8.5% yield-to-worst today, we recommend for many investors a meaningful allocation to high yield at these levels with room to add if yields approach 9% and 10%.
In recent days, it seems that risk assets, like stocks and leveraged credit, prefer a dovish Fed to a hawkish Fed. We prefer the opposite. The more convinced we are that the Fed will return inflation to the 2% area on a sustained basis, the more confident we are in the long-term merits of high yield.
If investors wait for too much certainty before allocating to high yield, they risk missing a substantial part of the move. That is why we believe legging in is the best strategy to overcome any concerns around timing while still capturing the opportunity in high yield.
Editor’s Note: The summary bullets for this article were chosen by Seeking Alpha editors.
Be the first to comment