

Kirill Gorshkov/iStock via Getty Images
Recently, I discussed the natural gas-prone, locally condensate-rich, Montney resource play in Canada, to identify the most promising stocks for investors interested in the energy sector, as represented by SPDR S&P Oil & Gas Exploration & Production ETF (NYSEARCA:XOP).
Since then, a lot of readers have asked me about which oil-prone plays I like in the country. The hottest oil play is certainly the Clearwater heavy oil play in central-northern Alberta. Clearwater was briefly mentioned in a recent article on Headwater Exploration Inc. (HWX.TSX)(OTCPK:CDDRF); however, the play is so important that it deserves a dedicated treatment and in-depth analysis.
Below, I present an overview on what the Clearwater play is, why it is so profitable and growth-potent, which companies operate there, and how an investor may maintain an advantageous exposure to it.
The Clearwater formation
The Clearwater Formation is part of the famous Manville Group in Western Canada. Clearwater conformably overlies the McMurray oil sands and is conformably overlain by the Grand Rapids Formation, according the Manville stratigraphic system of Alberta Geological Survey (Fig. 1).
- The Clearwater Formation, in part correlated with the Spirit River Formation in the Peace River area, is of Lower Cretaceous Albian age (from ~113.0 ± 1.0 million years ago to 100.5 ± 0.9 million years ago).
- The Bluesky Formation conformably underlying the Spirit River Formation in the Peace River area is thought to be equivalent to the Wabiskaw Member in the lower part of the Clearwater Formation.
- Nearly complete specimens of plesiosaurs, ichthyosaurs and ankylosaur were discovered from the formation during previous oil sand mining.
Fig. 1. Schematic stratigraphy of the Manville Group, with the Clearwater Formation and equivalent Spirit River Formation highlighted along with the McMurray oil sands (Laurentian Research modified after Alberta Geological Survey)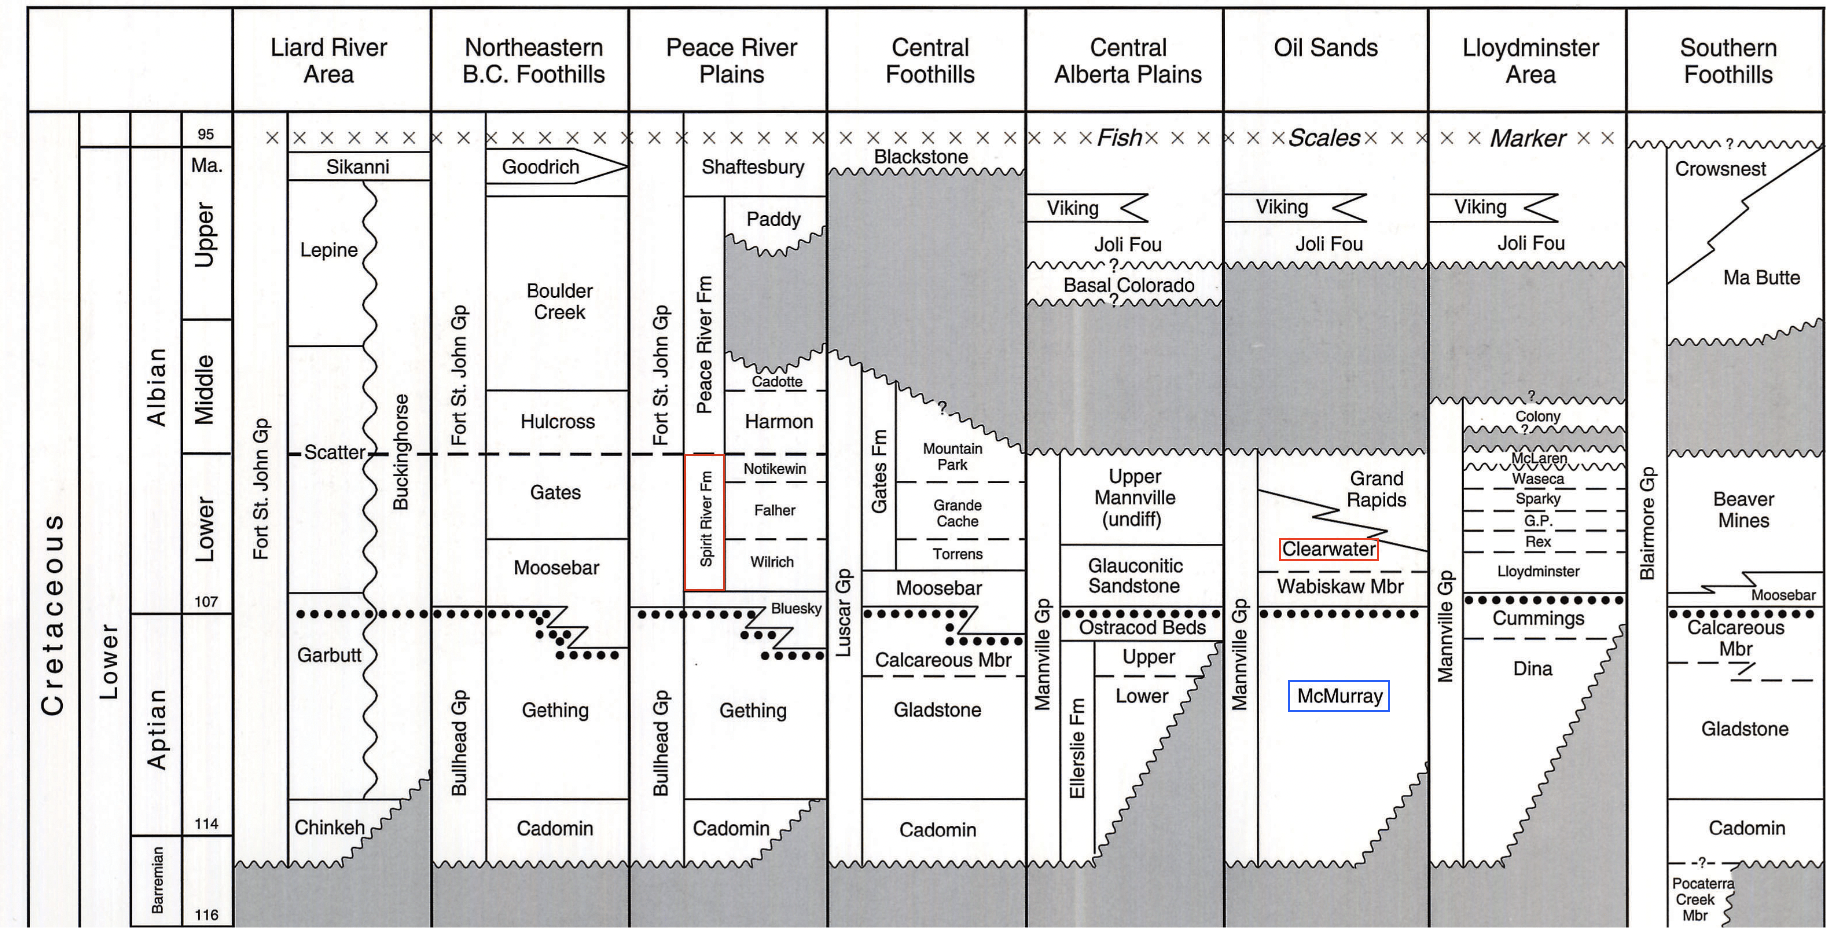
The Clearwater Formation consists of shales and sandstones deposited in a range of settings, including marginal marine, shallow marine, and non-marine environments. While impermeable shales providing a trapping mechanism for the underlying McMurray oil sands, the sandstone units in the Clearwater Formation – the Wabiskaw Member included – contain heavy oil resources.
- The reservoir-quality sandstones in the Clearwater Formation were initially bypassed by operators when they targeted deeper zones such as the Wabiskaw Member. Mud logging indicated the presence of hydrocarbons in Clearwater but the rock does not respond well to open-hole wireline logging, making the pay zone hard to identify.
The Clearwater Formation occurs subsurface in northeastern and central Alberta, along the southwestern margin of the Peace River, Athabasca and Cold Lake oil sands (Fig. 2).
Fig. 2. A map showing the distribution of Peace River, Athabasca, and Cold Lake oil sands in northern Alberta, Canada, with approximate extent of the cold-flowable Clearwater play (Laurentian Research modified after Shahin E. Dashtgard)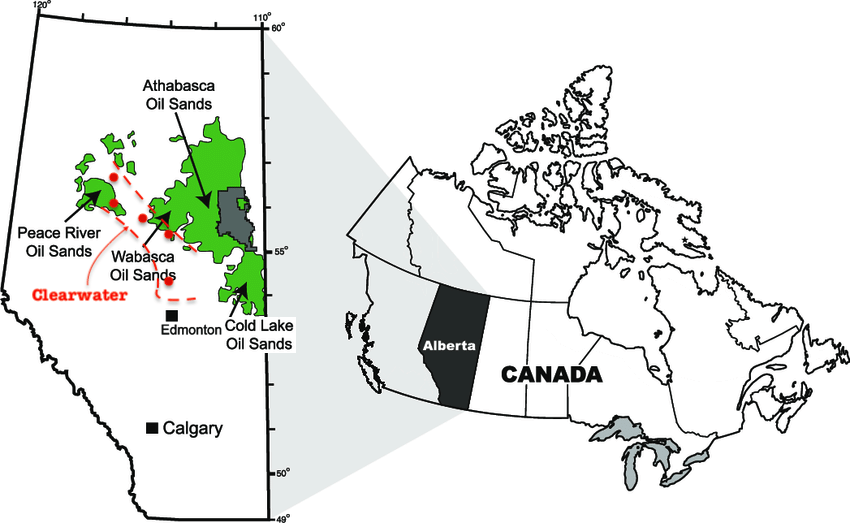
The Clearwater play stretches for some 400km from Jarvie via Marten Hills to Golden. The core Clearwater play appears to be located in the Marten Hills area, with the net pay thinning toward Nipisi in the west and Golden-Gift-Cadotte further in the northwest, and toward Jarvie and Ukalta in the southeast (Fig. 3).
Fig. 3. A map of Clearwater net pay (left) and its location in the Cretaceous Western Interior Seaway (right) (Modified after Headwater Exploration and Canadian Science Publishing)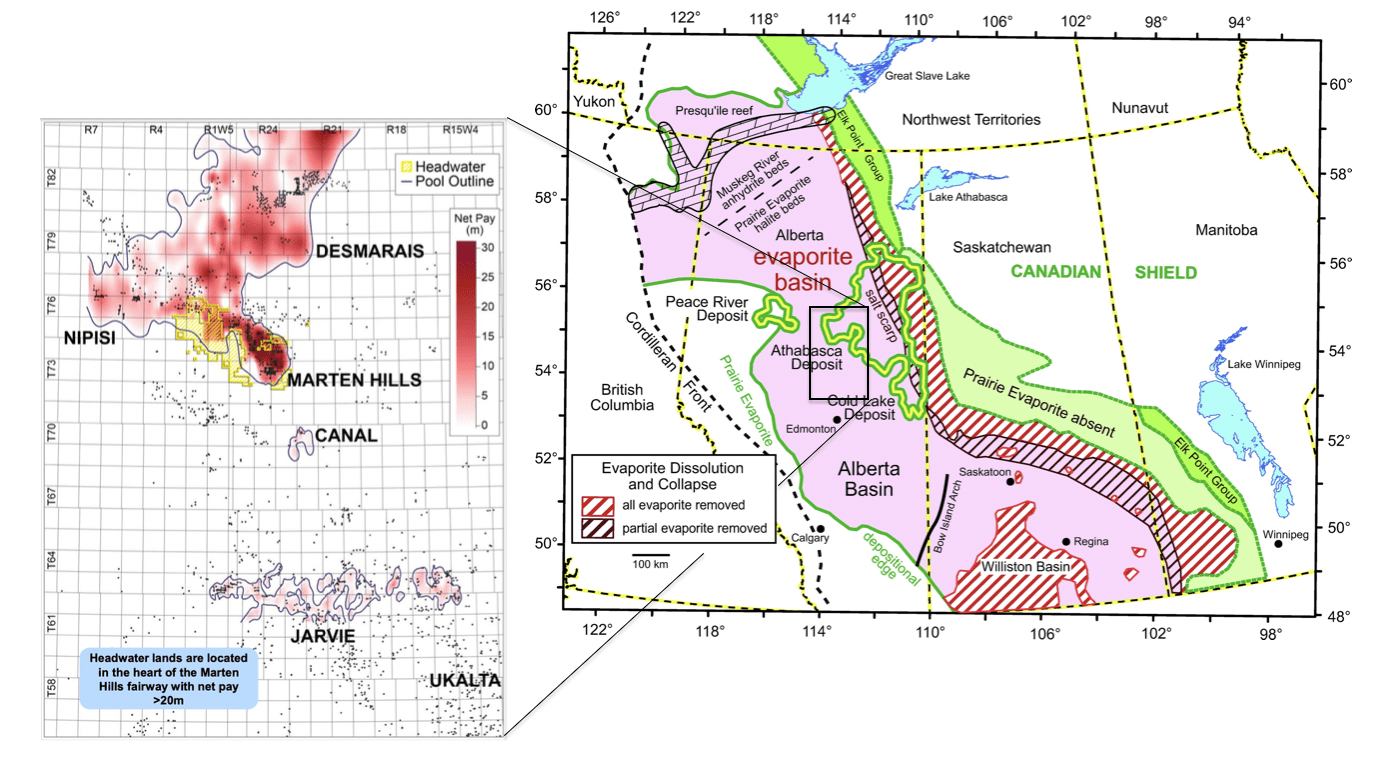
Developing Clearwater
Since late 2016, Clearwater has quickly emerged as the most exciting oil play in Canada, thanks to its rich oil resources and superior economics. A portion of the Clearwater play in the Marten Hills and Nipisi areas contains at least 4.96 billion barrels of in-place heavy (14-24° API) oil, assuming an average net pay of 12m, 22% porosity and 40% water saturation, according to petroleum consultancy Canadian Discovery Ltd. It is still the early days in the exploration and development of the expansive play; however, production data gathered so far are extremely encouraging.
Clearwater can be produced from multilateral wells, with 4-8 lateral sections at shallow depths (600-850m) that produce from one production string, in un-fracked open-hole cold flow from relatively highly permeable (1-900 mD) reservoirs characterized by low and stable water cut.
- In other words, operators do not need to hydraulically fracture the horizontal sections; neither do they need to use secondary heating technologies commonly used in oil sand production, such as steam-assisted gravity drainage (aka SAGD) or cyclic steam stimulation (aka CSS), to heat up the reservoir to flow the heavy oil.
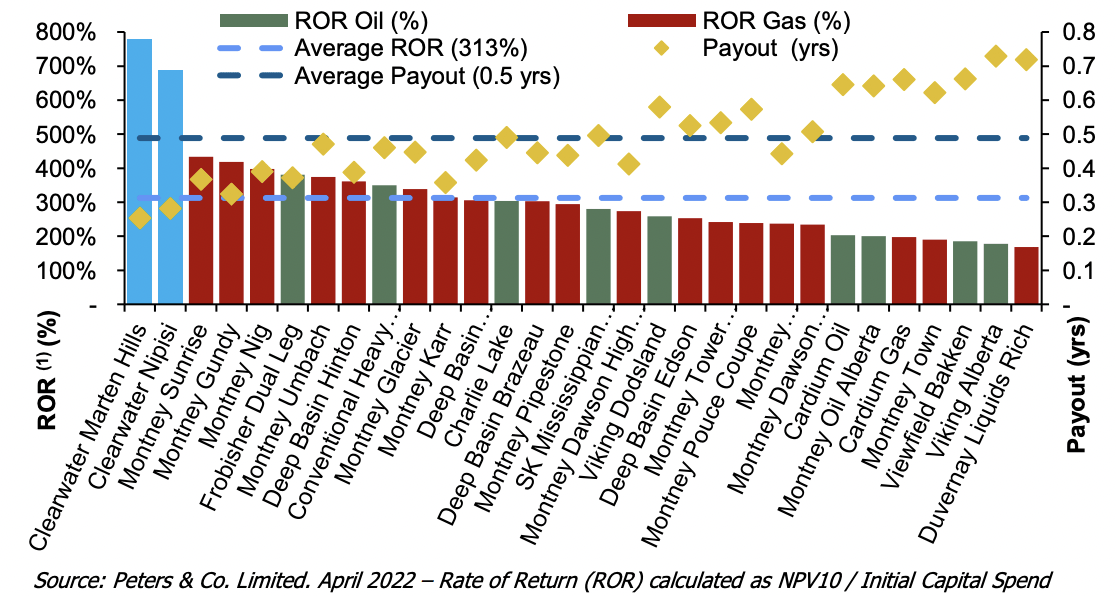
- Therefore, Clearwater wells can be drilled and completed at very low costs ($1.2-1.7 million for an array of multi-laterals), thus helping keep capital expenditures low. As a matter of fact, Clearwater emerges as the most profitable resource play in North America, boasting sub-US$20/boe half-cycle breakeven and ~0.5-year payout (Fig. 4) and an average RoR in excess of 300% (Fig. 5).
Fig. 4. The payout period and half-cycle breakeven of resource plays in North America (Tamarack Valley Energy) Fig. 5. RoR of Clearwater as compared with other North American resource plays (Rubellite Energy)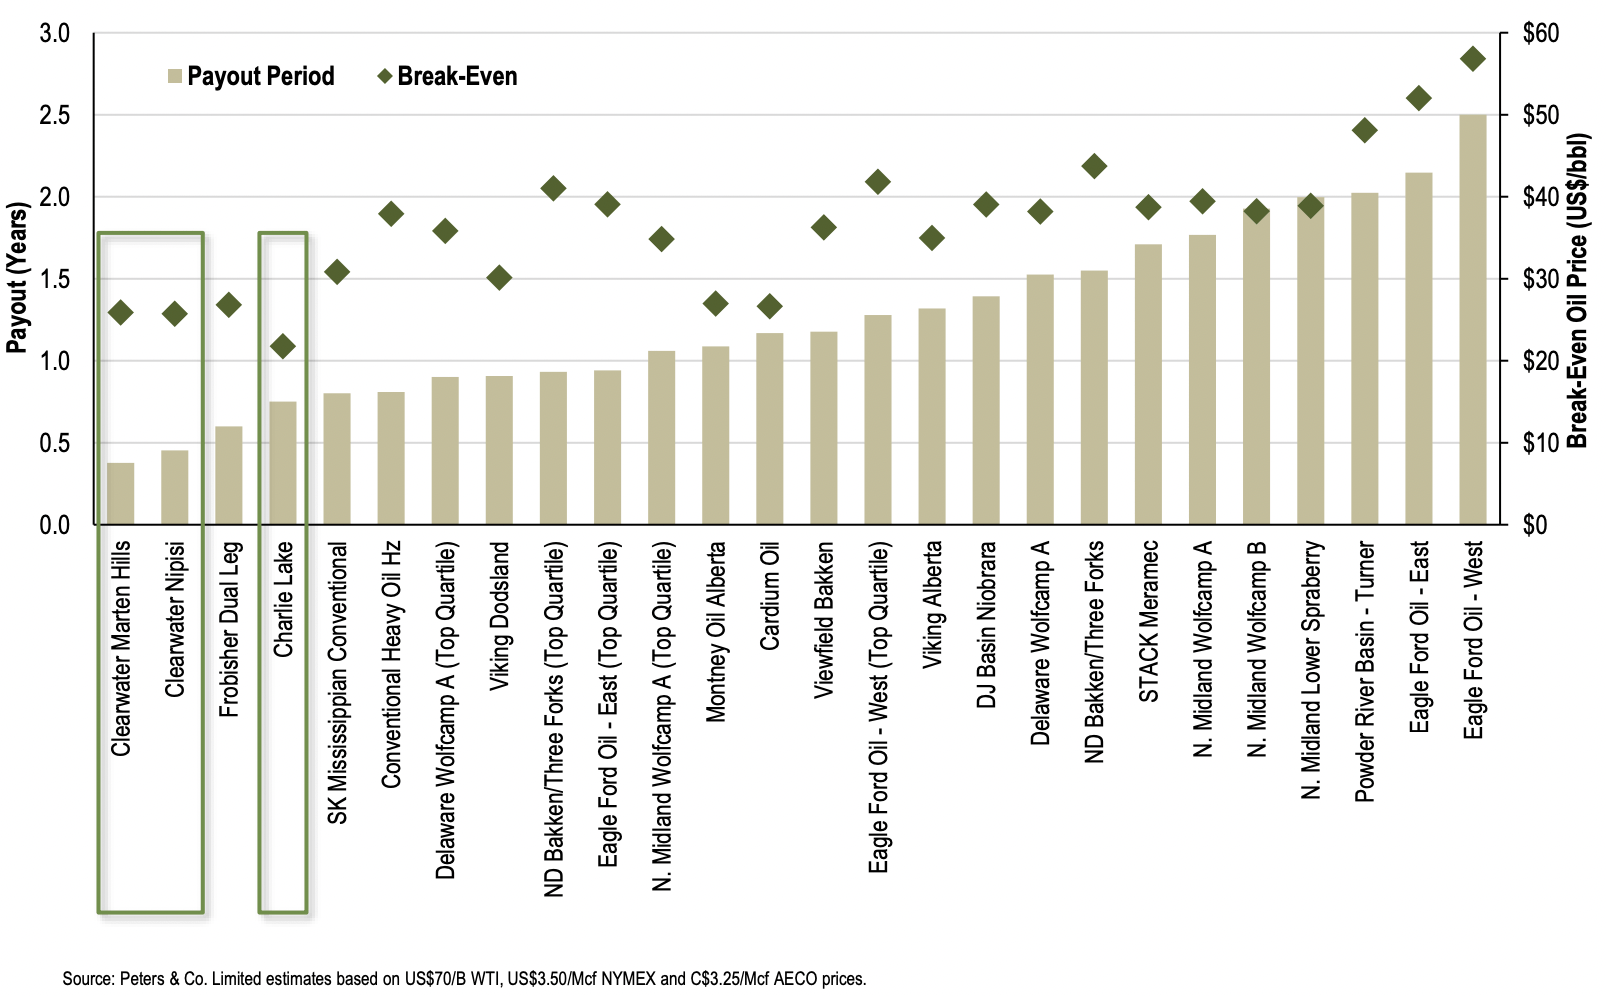
- Furthermore, operators including Headwater and Tamarack Valley Energy Ltd (TVE.TSX)(OTCPK:TNEYF) began to show that waterflood, an enhanced oil recovery (or EOR) technique, can materially reduce gas-oil-ratio (or GOR) and increase the recovery factor.
Competitive landscape
The Clearwater play can be divided into four operating areas: the core Marten Hills area; the Nipisi area to the west of the core area; the Golden-Peavine-Reno area in the northwest; and the Jarvie-Perryvale-Ukalta area in the southeast (Fig. 6).
Fig. 6. A map showing the landholding situation along the Clearwater fairway, Central and Northern Alberta, Canada (Tamarack Valley Energy)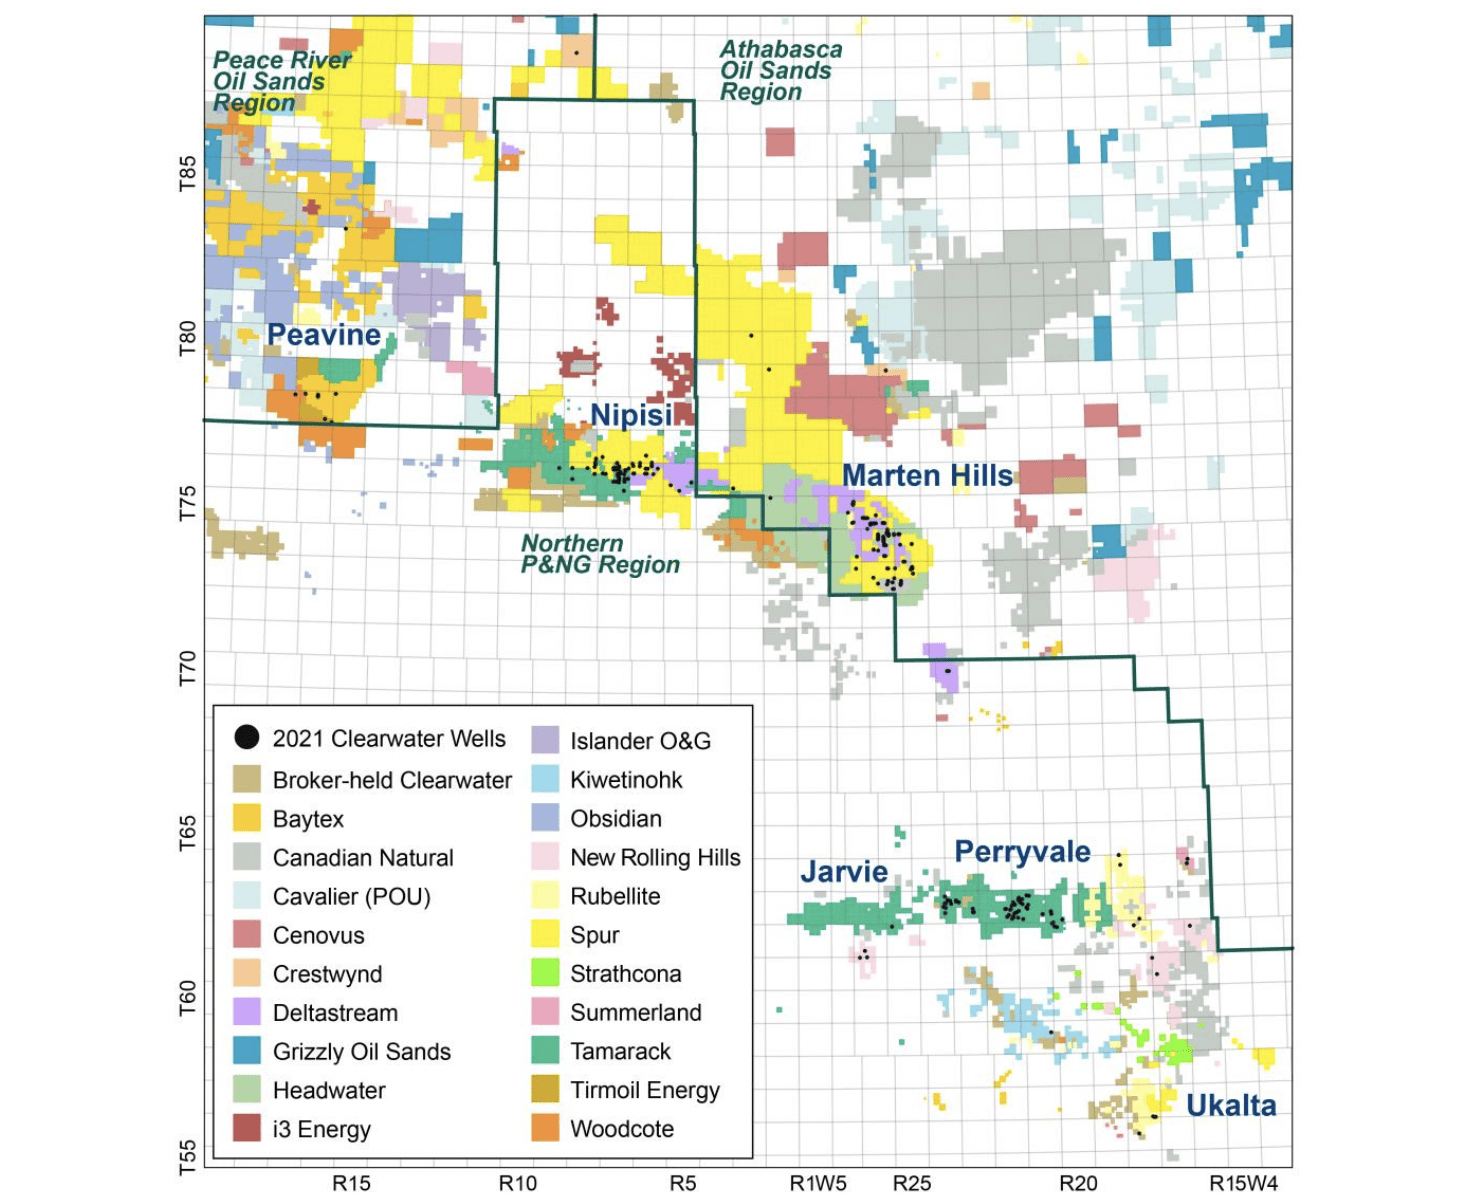
As of mid-2022, there are ~20 operators in the Clearwater play, including:
- Private operators Spur Petroleum Ltd. and Deltastream Energy Corp., which are major landholders especially in the Marten Hills, Nipisi, Cadotte, Golden, Canal and Jarvie areas;
- Headwater, which acquired on November 9, 2020, Cenovus Energy Inc. (CVE)’s clearwater properties in the Marten Hills area for C$100 million. As of May 2022, Headwater holds >400 net sections, including 270 sections in the core Marten Hills, 98 wholly-owned sections of unburdened land in the Greater Peavine area (Shadow, Peavine, Seal), and 5.5 wholly-owned sections in Utikima Lake (Fig. 7).
Fig. 7. A map highlighting the landholdings of Headwater Exploration in the Clearwater play (Headwater Exploration)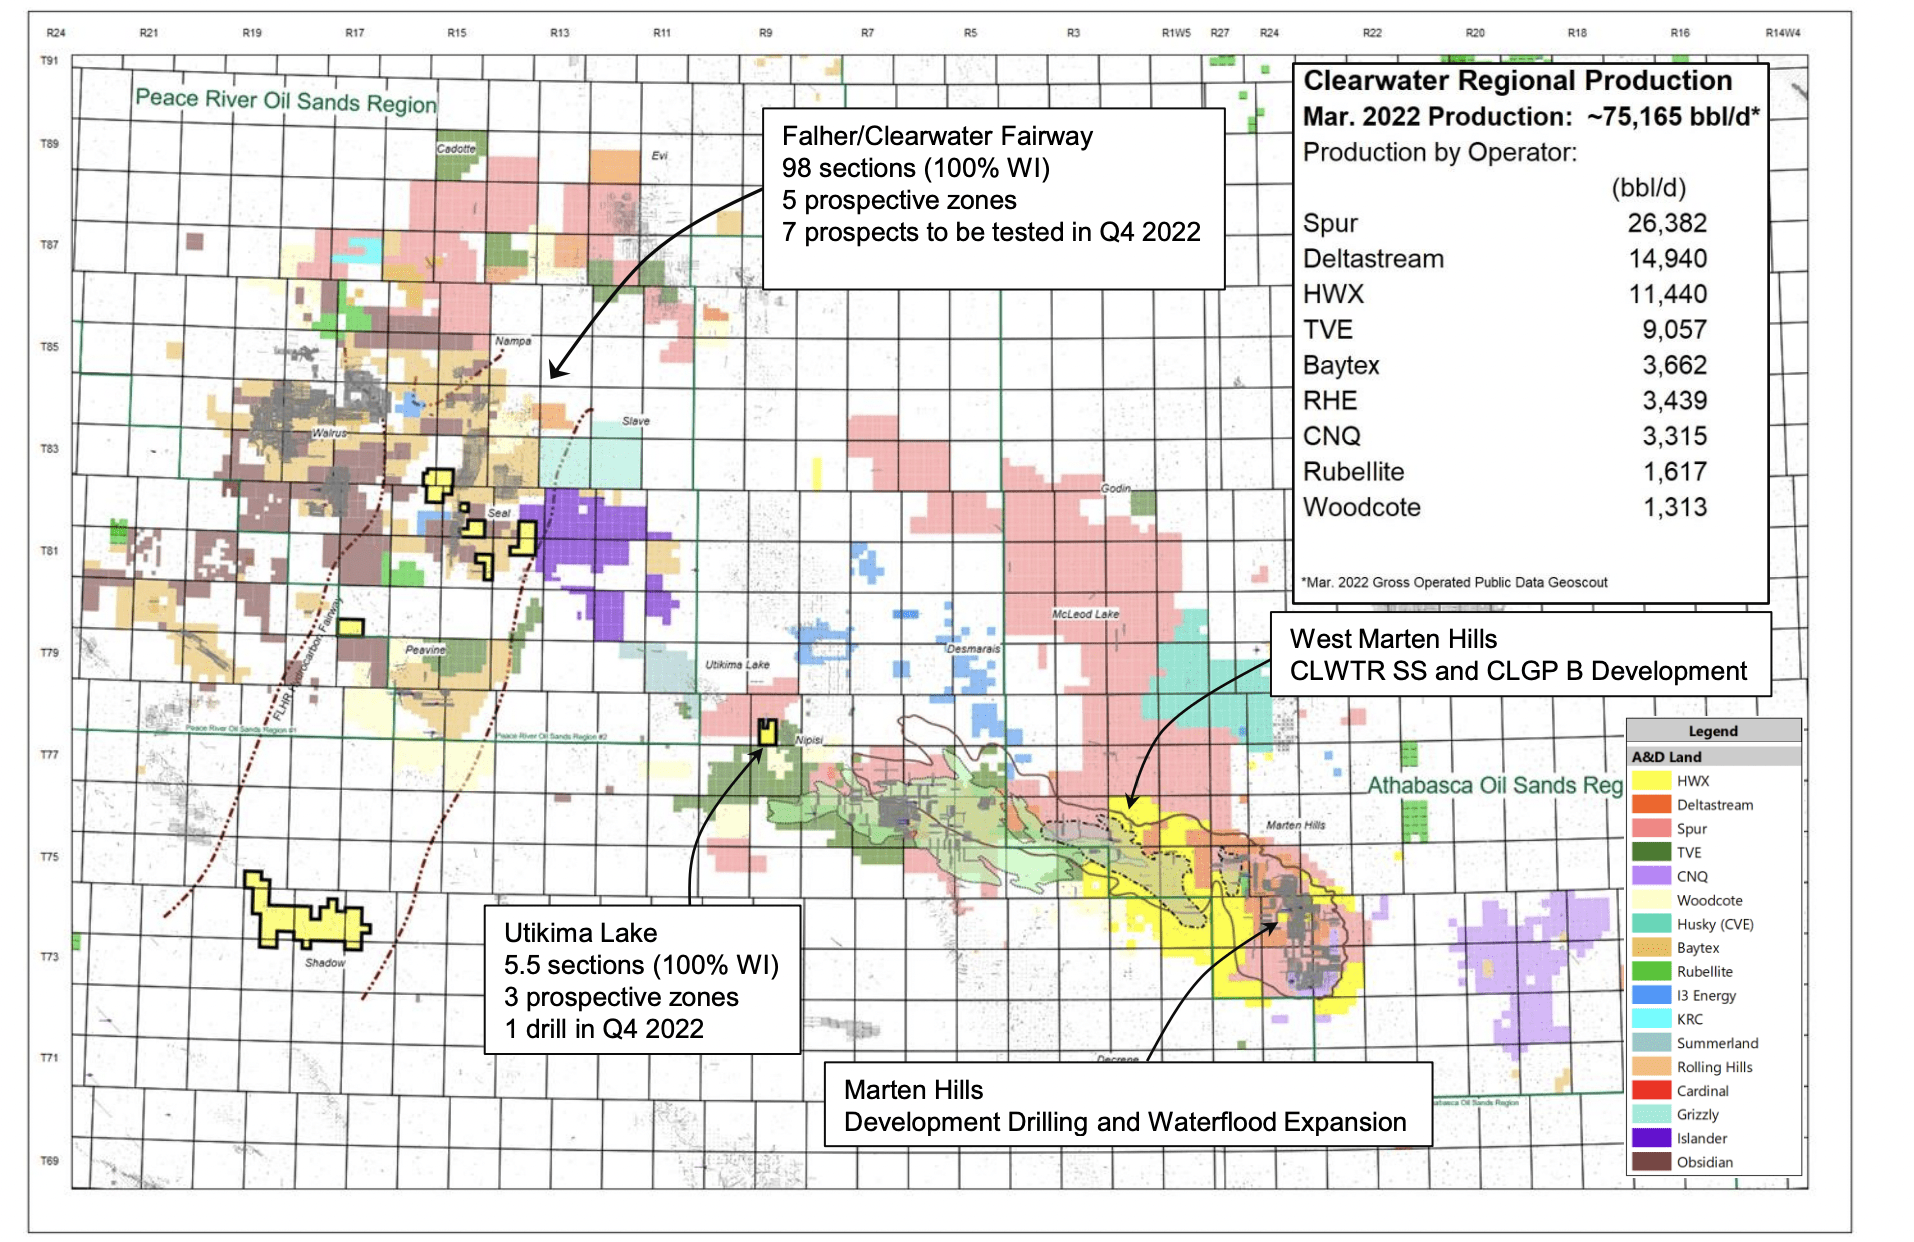
- Tamarack Valley Energy, which has 322 net sections in South Clearwater (Jarvie, Perryvale and Ukalta), 162.3 net sections in Nipisi acquired in December 2020 from Woodcote Oil Corp. and Highwood Oil Company Ltd., 38.4 net sections in West Marten Hills, and 70.5 net section in conjunction with the Peavine Metis Settlement strategic land arrangement, for a total of 593.2 net sections (Fig. 6).
- Baytex Energy Corp. (OTCPK:BTEGF), which holds 560 net sections in the Greater Peavine area, with >125 prospective for Spirit River-Bluesky heavy oil production (Clearwater equivalent), and 50 sections de-risked with potential for >200 locations pending further success (Fig. 8). The company executed two strategic land agreements with Peavine Métis Settlement, acquiring 80 contiguous sections. Although Baytex drew a lot of attention with high flow rates in Clearwater wells, Peavine currently contributes only 17% of its total production.
Fig. 8. The landholding of Baytex in the Greater Peavine area of the Clearwater play (Baytex)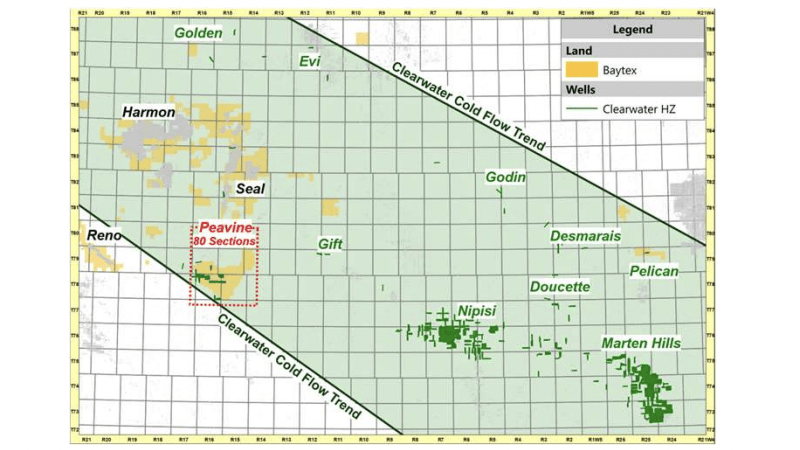
- Rubellite Energy Inc. (RBY.TSX-V)(OTCPK:RUBLF), a July 2021 spun-off from Perpetual Energy Inc. (OTCPK:PMGYF). Perpetual still keeps the upside in the Clearwater pure-play through an option to purchase 4 million common shares of Rubellite within 5 years. Rubellite owns 272.9 net sections including 131.8 net sections in Figure Lake (in the Jarvie area), 34 net sections in Ukalta, 1.5 net sections in Marten Hills, and 105.7 net sections in the north (Fig. 9). CEO Sue Riddell Rose is one of the insiders who collectively own some 34.6% of the Rubellite stock; she and Tourmaline Oil Corp. (OTCPK:TRMLF) CEO Michael Rose are one of the power couples in Calgary.
Fig. 9. A map showing the Clearwater acreage held by Rubellite Energy (Rubellite Energy)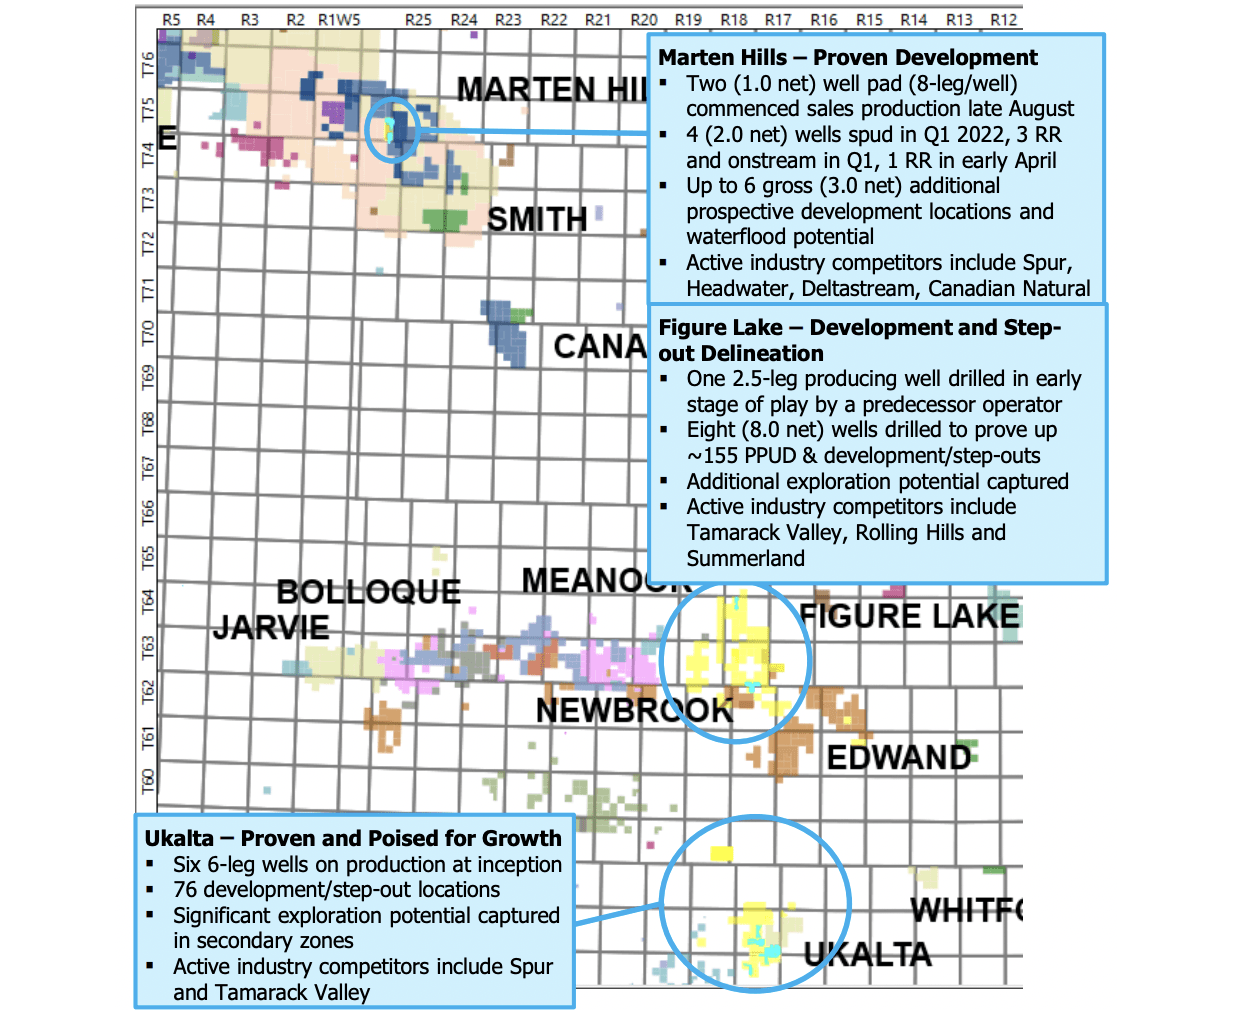
- Lastly, Canadian Natural Resources Ltd. (CNQ) holds quite a lot acreage in Clearwater although it may not move the needle for the behemoth. Even Cardinal Energy (OTCPK:CRLFF) has a tiny 3-section landholding in the Nipisi area, where a four-well pad are planned for 2022 (Fig. 6).
Stock screening
As I explained in a recent interview, E&P stocks can be effectively compared by examining their profitability per unit of production as defined below:
E*/[Production] = {[Realized price] – [OpEx] – [F&D]} X {1 + g}, where OpEx is the full-cycle operating expenses, F&D is the cost to find and develop one barrel equivalent of oil and gas reserves, and g is the production growth rate… The above equation makes it possible to compare different oil and gas businesses using concrete operational parameters.
Price realization
Headwater was able to realize C$95.06/boe after hedging effects in the 1Q2022. Rubellite realized only C$67.57/bo thanks to a one-time hedging loss of C$3.3 million or C$29.02/boe; prior to hedging effects, Rubellite sold its Clearwater heavy oil at C$96.61/bo. Tamarack Valley realized C$76.17/boe due to its sizable natural gas and NGL production elsewhere (Table 1).
Table 1. Realized price and costs of Headwater Exploration, Tamarack Valley Energy and Rubellite Energy, the 1Q2022 actual and 2022 guidance (Laurentian Research based on Seeking Alpha and company financial filings)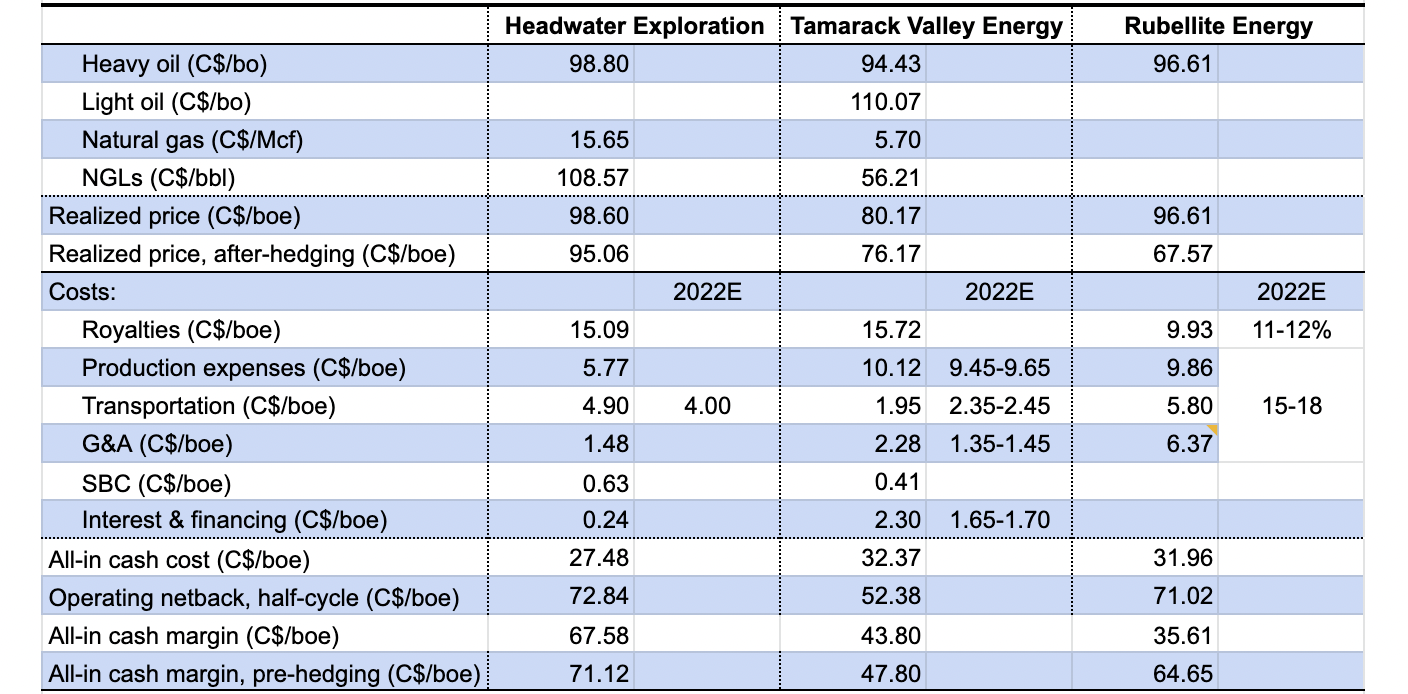
Cash costs
The 1Q2022 all-in cash costs were C$27.48/boe for Headwater, C$31.96/bo for Rubellite, and C$32.37/boe for Tamarack Valley. Unit cash costs are supposed to decline as the operators scale up their Clearwater operations, offset by any impact of inflation:
- From the 4Q2020 to 1Q2022, Headwater managed to cut production expenses from C$7.92/boe to C$5.77/boe, and G&A from C$4.64/boe to C$1.48/boe. Transportation costs varied between C$8.68/boe and C$4.90/boe as the company alternated between shut-in over the summer and reopening in the winter of the McCully gas field; however, as the Clearwater production increases, McCully output will become relatively insignificant, thus further driving down transportation cost, with 2022 transportation cost guided toward C$4.00/boe.
- I expect the unit costs of Rubellite to drop significantly in the foreseeable future. Between production, transportation and G&A, the company guided toward a C$4-7/boe cost reduction from the 1Q to full-year 2022. Since its spin-off, Rubellite has been sharing with Perpetual employees, office and information technology-related G&A costs under a management and operating services agreement; according to the agreement, Rubellite paid C$2.78/bo to Perpetual in the 1Q2022 for technical and administrative services on a relative production split basis.
- Tamarack Valley guided toward slightly lower cash cost in 2022.
Margins
Prior to accounting for hedging, Headwater achieved a cash margin of C$72.12/boe, Rubellite C$64.65/bo and Tamarack Valey C$47.80/boe in the 1Q2022.
Capital costs
The F&D costs still show a lot of variability because the Clearwater play is still in the phase of early exploration/appraisal to core-area development, and infrastructure in much of the trend is still being built.
Given the Clearwater reservoirs are so richly endowed, shallow-occurring and of low and stable water cut, and considering they can be drilled and completed at low capital costs, it is natural to expect the F&D costs to drop significantly as the Clearwater play matures. The application of waterflood may end up significantly increasing the recovery factor and further lowering the F&D costs.
- Headwater had a 2021 F&D costs of C$20.43/boe and C$13.92/boe on the 1P and 2P reserve basis, respectively.
- Tamarack Valley had a three-year average F&D costs of C$16.33/boe and C$14.71/boe on the 1P and 2P reserve basis, respectively. However, it is unclear how much of the costs are attributable to its exposure to the Clearwater play.
- Rubellite had a 2P F&D costs of C$11.28/bo.
Table 2. Reserves of Headwater Exploration, Tamarack Valley Energy and Rubellite Energy (Laurentian Research based on data sourced from Seeking Alpha and company financial filings)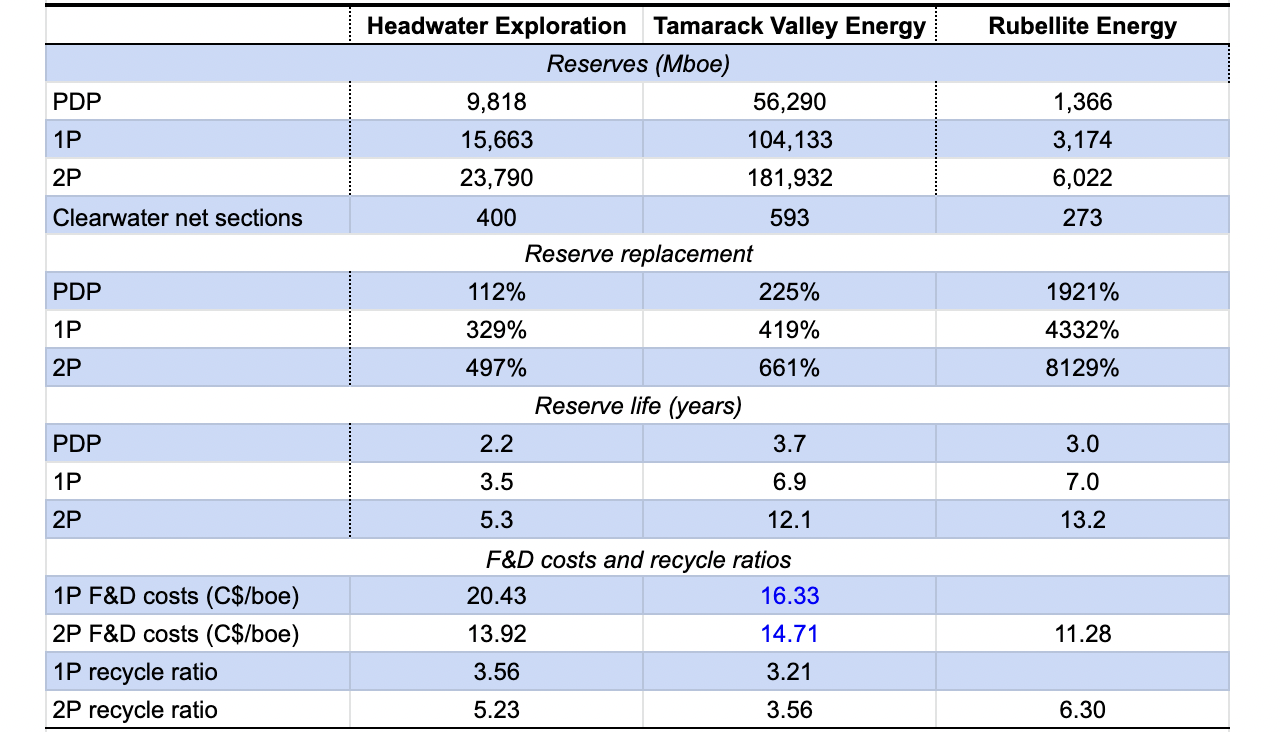
Thanks to the high operating netback, the Clearwater participants were able to post recycle ratios of 3.2 – 6.3X.
Growth
All Clearwater participants have an aggressive capital program in 2022 (Table 3):
- Headwater expanded its 2022 capital budget to C$230 million, looking to grow production by 75.8%, to exit 2022 at 16,500 boe/d. The company plans to spend an additional amount of C$30 million on road and drilling pad construction in 2022, setting the stage for continued production expansion in 2023 and beyond.
- Tamarack Valley plans to spend C$280-300 million this year, up by 52% from one year ago, expecting to achieve 34.5% production growth.
- Rubellite will spend nearly twice as much capital in 2022, and will grow production by some 288% from its current small base.
Table 3. Production and production growth of Headwater Exploration, Tamarack Valley Energy and Rubellite Energy, shown with the 2021 CapEx and 2022 capital budget (Laurentian Research based on data sourced from Seeking Alpha and company financial filings)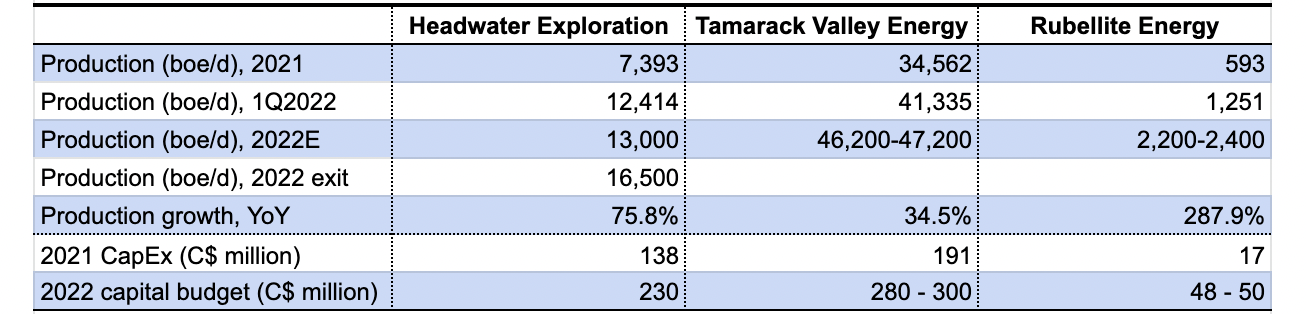
The announced goals of production growth are well supported by reserve replacement and reserve growth (Table 2; Table 4).
- Headwater replaced 112% of the PDP, 329% of 1P, and 497% of 2P reserves depleted due to production. It grew PDP reserves by 96%, 1P reserves by 65%, and 2P reserves by 82%.
- Tamarack Valley replaced 225% of PDP, 419% of 1P, and 661% of 2P reserves depleted due to production. It grew PDP reserves by 39%, 1P reserves by 63%, and 2P reserves by 64%.
- 2021 was Rubellite’s first year as a stand-alone operator. I believe it will post impressive numbers in reserve replacement and growth in 2022.
- The PDP reserve life, 1P reserve life and 2P reserve life for the Clearwater operations may seem short. However, as exploring and developing go on in the next few years, I believe the Clearwater operators will beef up reserves significantly.
Table 4. Reserve growth of Headwater Exploration, Tamarack Valley Energy and Rubellite Energy from year-end 2020 to year-end 2021 (Laurentian Research based on data sourced from Seeking Alpha and company financial filings)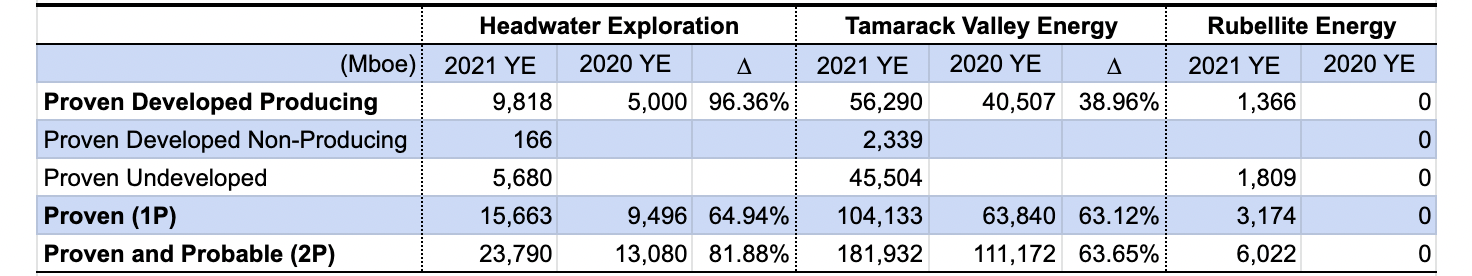
Integrating the operational parameters
An examination of the two pure-play Clearwater participants seems to suggest that the profitability per unit of production for a typical Clearwater operation, prior to accounting for production growth, comes to C$53-54 for each boe of production. With production growth considered, the profitability per unit of production reaches C$94-207/boe (Table 5).
- As Clearwater matures, OpEx and F&D costs are supposed to decline, offsetting inflation and keeping the pre-growth profitability per unit of production elevated.
Table 5. An assessment of Clearwater participants using key operating parameters (Laurentian Research based on data sourced from Seeking Alpha and company financial filings)
Valuation and risk
Operation-wise, the Clearwater and equivalent formations vary wildly in pay zone thickness and reservoir properties across the 400km trend. High variability in well productivity has been observed. Water flood pilot tests may not generate outcome as favorable as expected even though the initial results are encouraging.
Excited by the incredible economics and breath-taking growth, investors bid up stocks with exposure to Clearwater to giddy levels. The market accords these three stocks a level of valuation comparable to that of the super-majors (Table 6).
Table 6. Net asset value of select Clearwater participants, as compared with respective market cap as of July 28, 2022 (Laurentian Research based on data sourced from Seeking Alpha and company financial filings)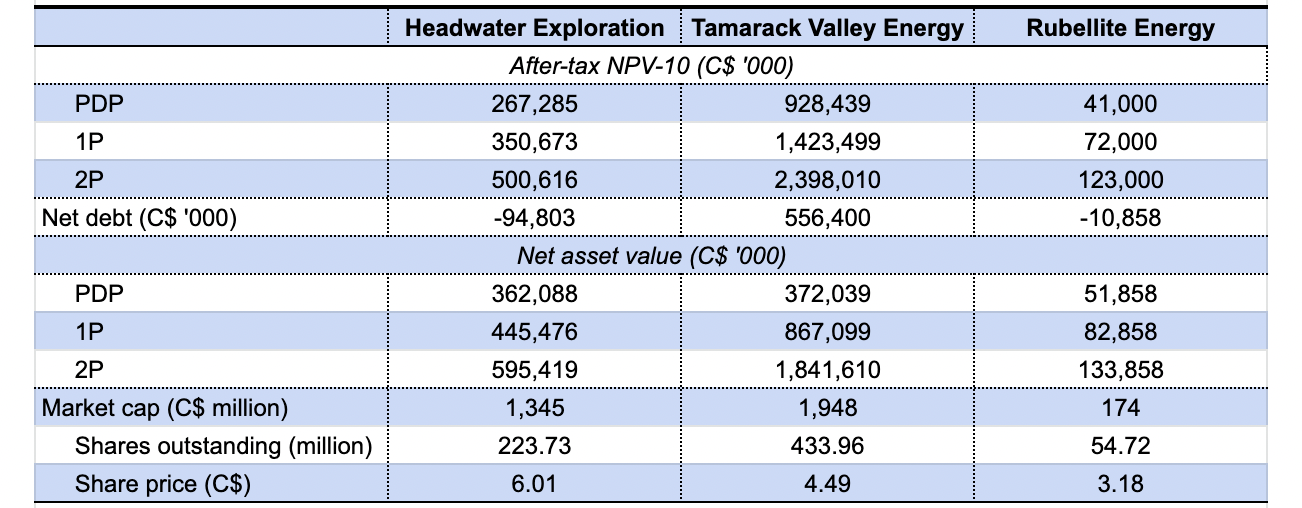
Clearwater players certainly deserve a lofty valuation, in view of (1) the superior economics; (2) the expected benefit of economies of scale, (3) the yet-to-develop acreage, and (4) the enormous upside to be reaped from waterflood. The uncertainty lies in the prospectivity of the acreage assembled by each player and the ability of each management team to execute.
Fortunately, the selloff that swept through the entire energy sector since June 2022 has led to more reasonable valuation (Fig. 10).
Fig. 10. Stock chart of Headwater Exploration, Rubellite Energy, and Tamarack Valley Energy (Laurentian Research modified after Seeking Alpha and Barchart)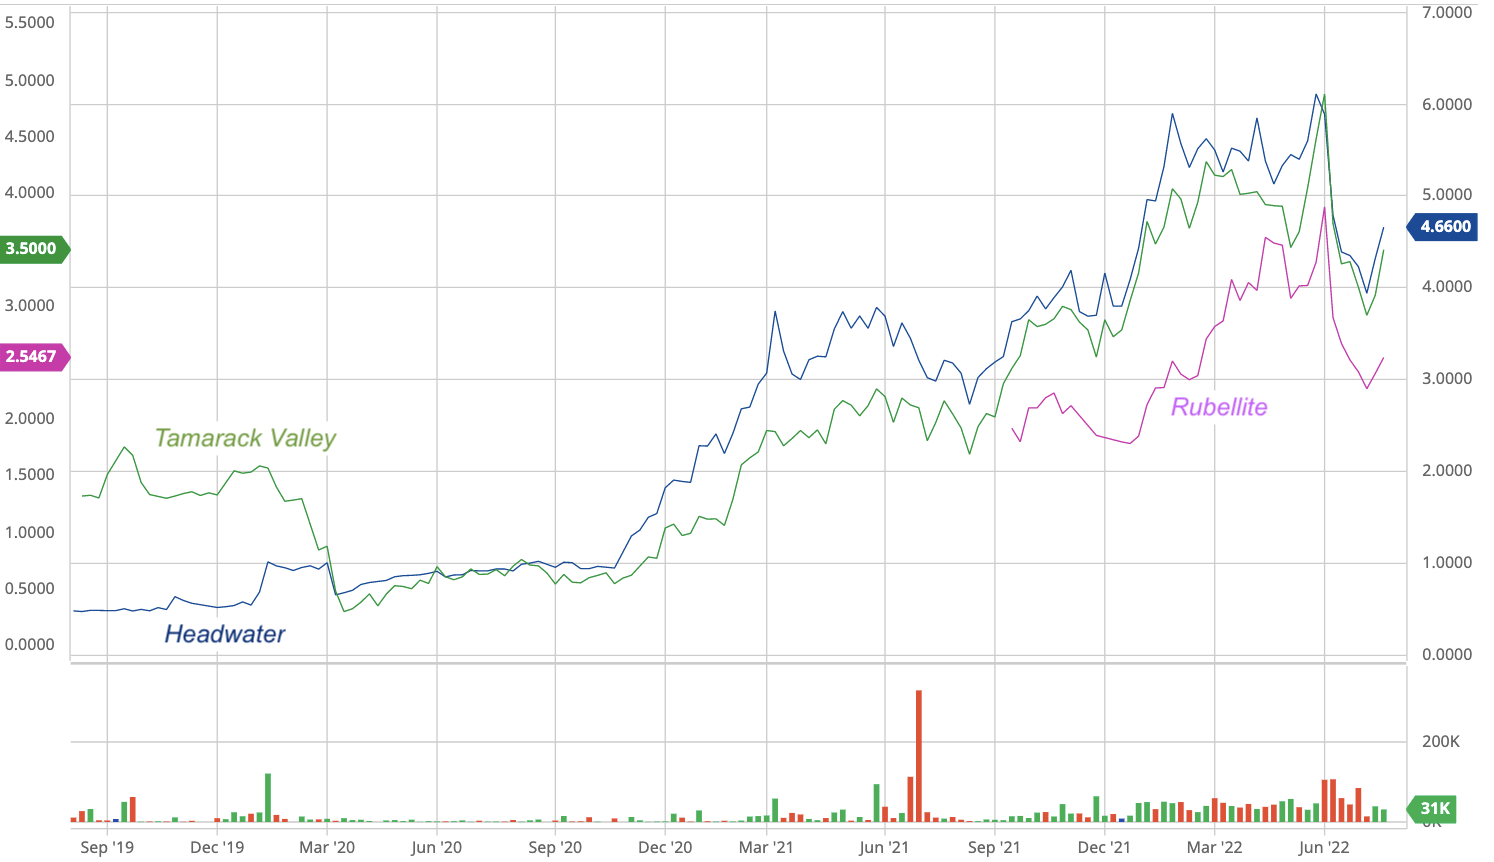
Investor takeaways
Thanks to the shallow reservoirs that can be produced from open-hole multilateral wells in an unstimulated, unheated fashion, the Clearwater play turns out to be extremely economical albeit with regional variations.
The exploration and development of the heavy oil play are still in the early days, with enormous growth potential going forward for investors to benefit from.
After over five years of land grab, a handful of publicly-traded operators emerge as significant landholders. Based on our in-depth analysis, I particularly like mid-cap pure-play Headwater Exploration, which holds acreage in the core areas of the Clearwater play, and micro-cap Rubellite Energy, which holds big upside potential.
Be the first to comment