klenger
There are a few different definitions of the “Santa Rally,” but in this article, we will use the most accepted. This refers to stock market gains in the last five trading days of a year plus the first two trading days of the following year (Wikipedia). Therefore, the “Santa Rally” is about the performance of the stock market in 7 days, as just defined.
The first question to ask is: What is the win rate of this calendar effect?
Note that all metrics of the performance of market patterns are random variables with possibly unknown distributions. As a result, the moments, such as the mean and standard deviation, may not exist. The empirical mean and standard deviation can change over time. The same is true for the success rate and other parameters.
We can determine the win rate with a backtest of this calendar effect. We use data from S&P 500 Index (SPX) from 1943 to 2022 for this purpose. Although the index is not tradable, it is useful for backtesting purposes. If we use the SPDR S&P 500 Trust ETF (SPY), the available data for the backtest is limited to between 1993 and 2022.
Backtest results for the “Santa Rally” calendar effect
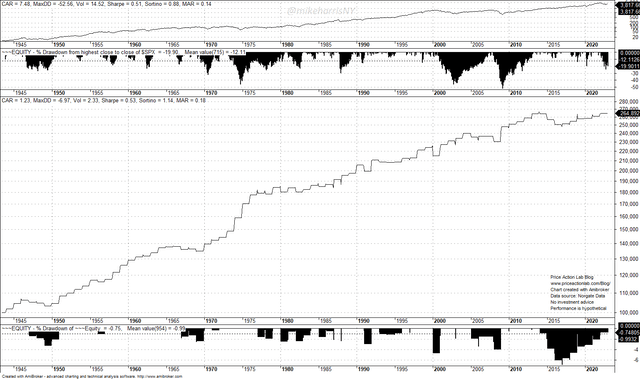
The chart below shows the equity curve of the calendar effect (in log scale) along with statistics, including the performance of buying and holding the index in the backtest period.
Backtest Results of the Santa Rally Calendar Effect in S&P 500 from 1943 to 2022 (Price Action Lab Blog – Norgate Data)
The annualized return of this calendar effect is 1.23% at a 7% maximum drawdown in December 2016. The win rate is 77.22%, with a total of 79 trades.
The win rate appears high, but it depends on the objectives. The win rate is the percentage of winning trades in the period of the backtest. In this particular case, it means that 77.22% of the trades, or 61 from the 79, were profitable. It also means that 22.78% of the trades were unprofitable.
For someone looking for a pattern for a one-time bet, in my opinion, the win rate is low because a 22.78% probability of loss is high. A win rate of 77.22% is high enough if someone intends to repeatedly trade this pattern in the future or has already started doing that, since this calendar effect has an average trade gain of 1.27%. In other words, the win rate for a one-time bet is low, in my opinion.
Additional information disqualifies the “Santa Rally” as a price action anomaly. This is the fact that buying and holding the S&P 500 Index (SP500) in December has outperformed the calendar effect.
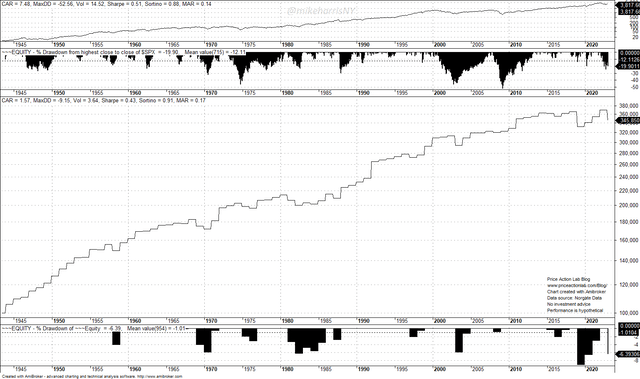
Backtest of buying and holding the S&P 500 in December
Backtest Results for December in S&P 500 from 1943 to 2022 (Price Action Lab Blog -Norgate Data)
The equity curve for buying and holding the index in December looks similar to that of the “Santa Rally” calendar effect. However, the annualized return is higher at 1.57% at a 9.15% maximum drawdown in 2018.
Ignoring the “Santa Rally” and just buying and holding the index has generated a higher annualized return by 35 basis points. In this case, there are also 79 trades, the win rate is 76.25%, and the average trade (December average return) is 1.62%.
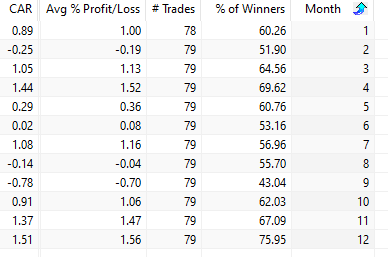
December has been historically the strongest month in the stock market.
Monthly Return Statistics For the S&P 500, 1944 – 2022 (Price Action Lab Blog – Norgate Data)
The last column is the Month, starting with January (1) and ending in December (12). CAR is the annualized return. December shows an average gain of 1.56% at a 75.95% win rate. April (4) has been the next most profitable month, with an average gain of 1.52% and a 69.62% win rate. December has the largest average gain and also the highest win rate.
Monthly statistics are random variables and can change in the future. There may be some technical reasons stocks go up in the last month of the year, as presented on some websites, including speculation by retail and portfolio rebalancing. But these are hypotheses that cannot be proven. Probably, for a speculator, small options bet in a “Santa Rally” is justified, but for investing purposes, buy and hold has better odds of higher performance for December.
Conclusion
The “Santa Rally” in equities has historically a high win rate, but not high enough to justify one-time bets. In the long term, gains in the last 5 trading days of a year and the first two of the following year may be a winning strategy but it has not outperformed the simpler buying and holding strategy in December. Variations of the pattern are possible that will boost the returns, but then data-mining bias and over-fitting may become an issue.


Be the first to comment