

zorazhuang
Background
For those who are interested in John and Jane’s full background, please click the following link here for the last time I published their full story. The details below are updated for 2022.
- This is a real portfolio with actual shares being traded.
- I am not a financial advisor and merely provide guidance based on a relationship that goes back several years.
- John retired in January 2018 and now only collects Social Security income as his regular source of income.
- Jane officially retired at the beginning of 2021, and she is collecting Social Security as her only regular source of income.
- John and Jane have decided to start taking draws from the Taxable Account and John’s Traditional IRA to the tune of $1,000/month each. These draws are currently covered in full by the dividends generated in each account.
- John and Jane have other investments outside of what I manage. These investments primarily consist of minimal-risk bonds and low-yield certificates.
- John and Jane have no debt and no monthly payments other than basic recurring bills such as water, power, property taxes, etc.
I started helping John and Jane with their retirement accounts because I was infuriated by the fees their previous financial advisor was charging them. I do not charge John and Jane for anything that I do, and all I have asked of them is that they allow me to write about their portfolio anonymously in order to help spread knowledge and to make me a better investor in the process.
Generating a stable and growing dividend income is the primary focus of this portfolio, and capital appreciation is the least important characteristic. My primary goal was to give John and Jane as much certainty in their retirement as I possibly can because this has been a constant point of stress over the last decade.
Dividend Decreases
No stocks in Jane’s Traditional or Roth IRA paid a decreased dividend during the month of June.
Dividend And Distribution Increases
Three companies paid increased dividends/distributions or a special dividend during the month of June in the Traditional and Roth IRAs.
International Business Machines
IBM continues to be the dividend stock that investors love to hate. For years the concern has been a slow but steady drop off in revenue which has resulted in pressure on corporate earnings and ultimately limited the ability to grow its dividend. The most recent increase is a perfect example of the problem that this has created with the average three-year dividend growth rate coming in at less than 2.5% while the 10-year average dividend growth rate comes in at 8.17%. This is a problem for a tech company like IBM which is why it currently yields a whopping 4.61% and explains why the share price has been stagnant for so long. The acquisition of Red Hat (“RHT”) appears to have given IBM a new sense of relevance in the hybrid cloud platform. Another positive is that the company has been able to deleverage since the acquisition of RHT with debt levels closing in on the same level prior to the RHT acquisition.
We have sold shares of IBM at $140/share and higher over the last year but view stock as a buy under $130/share (I prefer under $125/share). With the current position carrying an average cost basis of $122/share, we do not plan on selling any shares in the near future.
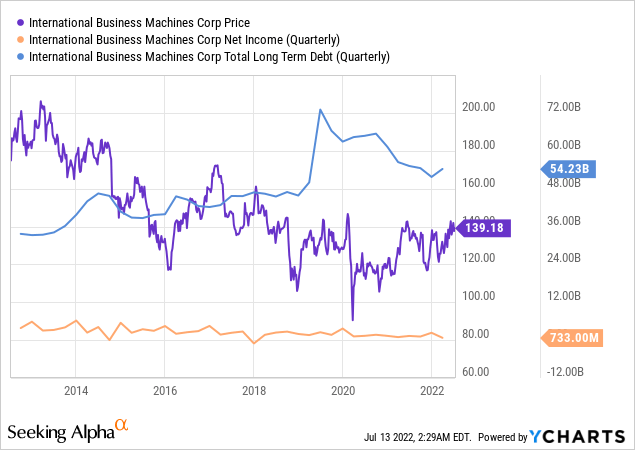
The dividend was increased from $1.64/share per quarter to $1.65/share per quarter. This represents an increase of .6% and a new full-year payout of $6.60/share compared with the previous $6.56/share. This results in a current yield of 4.61%% based on the current share price of $139.18.
LyondellBasell
It’s not every day that a company raises its dividend and offers a massive special dividend payout at the same time. The awesome announcement was accompanied by the following statement:
“LyondellBasell established new records for cash generation in 2021 and we have a strong outlook for our company. Capital returns have always been an important component of LyondellBasell’s value proposition for shareholders. 2022 will mark our 12th consecutive year of regular dividend growth. The combination of today’s special and quarterly dividends returns $2.1 billion to shareholders. As the incoming CEO, I would like to make it very clear that I support the continuation of our balanced and disciplined capital allocation strategy with both dividends and share repurchases playing a central role.”
We sold shares prior to the dividend announcement as the stock pushed its 52-week-high. The 25 shares we sold were at $108.35/share and were used to reduce the exposure the position had to high-cost shares that had been purchased at around $115/share. We have since added 20 shares back at a major discount and plan to add more. Analyst downgrades have been common in the news but I see a Strong Buy under $90/share and enjoy locking in the 5%+ yield in the meantime.
LyondellBasell – FastGraphs – July (FastGraphs)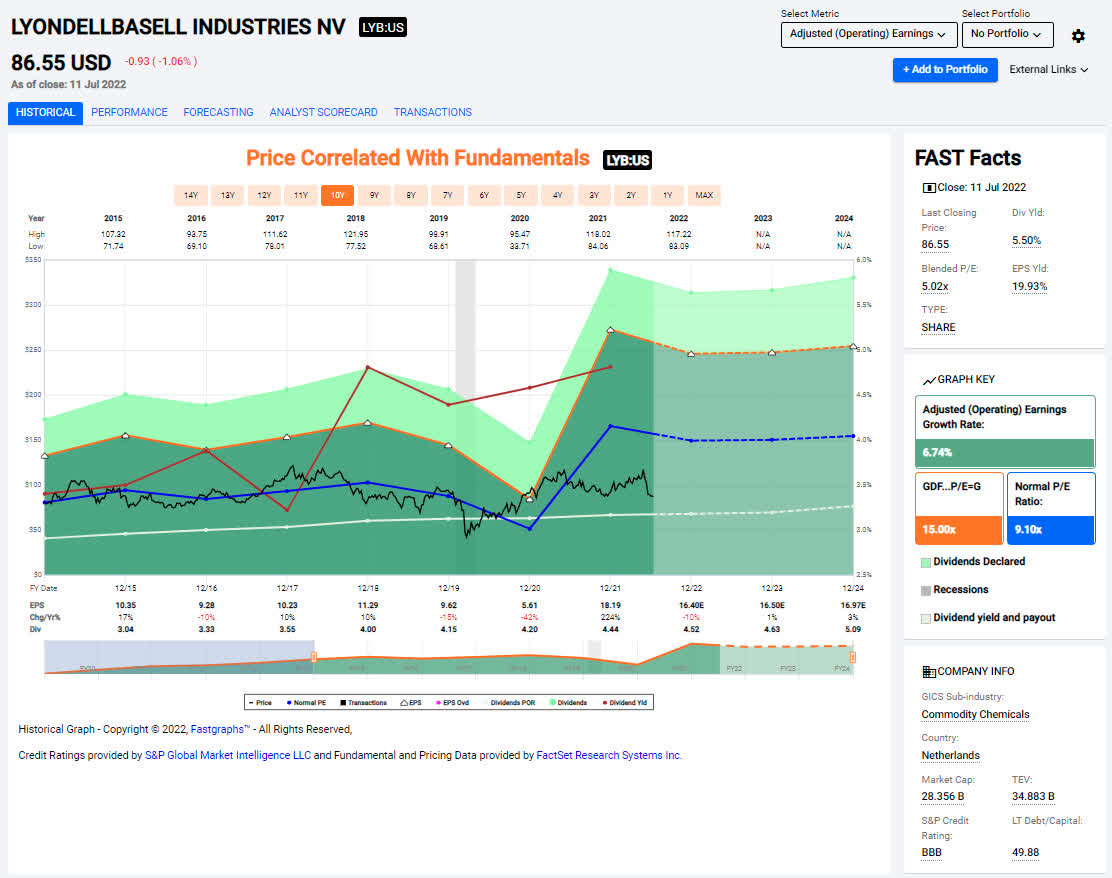
The dividend was increased from $1.13/share per quarter to $1.19/share per quarter. This represents an increase of 5.3% and a new full-year payout of $4.76/share compared with the previous $4.52/share. This results in a current yield of 5.29% based on the current share price of $85.93.
LYB paid a special dividend of $5.20/share which was paid on June 13th, 2022.
Main Street Capital
Q2-2022 earnings will be coming out in less than a month and I expect it will demonstrate many of the strengths that made Q1-2022 push record levels in multiple metrics. Q1-2022 recorded interest income of $59.4 million compared to $43.5 million in Q1-2021 and we expect this number to continue improving due to the fact that most of MAIN’s portfolio is variable rate and therefore increases its income when the Federal Reserve raises rates. Another important indicator is the net asset value per share of $25.89/share and is up from $25.59/share in the previous quarter. MAIN’s management is top-notch and has always been consistently shareholder friendly and focused on long-term results.
Although the NAV continues to climb, shares are not cheap by any means. The recent pullback into the $34/share range represented a buying opportunity and we nibbled a little too early when it dropped below $40/share. We a hesitant to add too much more exposure to MAIN so we will be looking for a price under $35/share. For those who prefer to follow the dividend yield metric I would say a yield close to 7% would be the best/most opportunistic entry point. Other than COVID, this does not happen often so buyers need to be prepared to act when the opportunity arises.
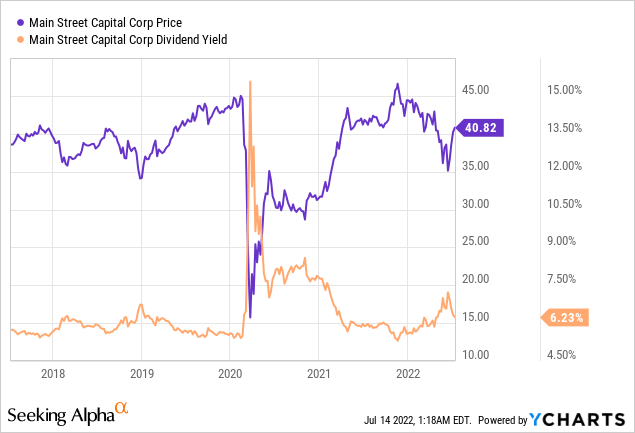
MAIN paid a special dividend of $.075/share which was paid on June 30th, 2022.
Retirement Account Positions
There are currently 39 different positions in Jane’s Traditional IRA and 23 different positions in Jane’s Roth IRA. While this may seem like a lot, it is important to remember that many of these stocks cross over in both accounts and are also held in the Taxable Portfolio.
Below is a list of the trades that took place in the Traditional IRA during the month of June.
Traditional IRA – June – Trades (Charles Schwab)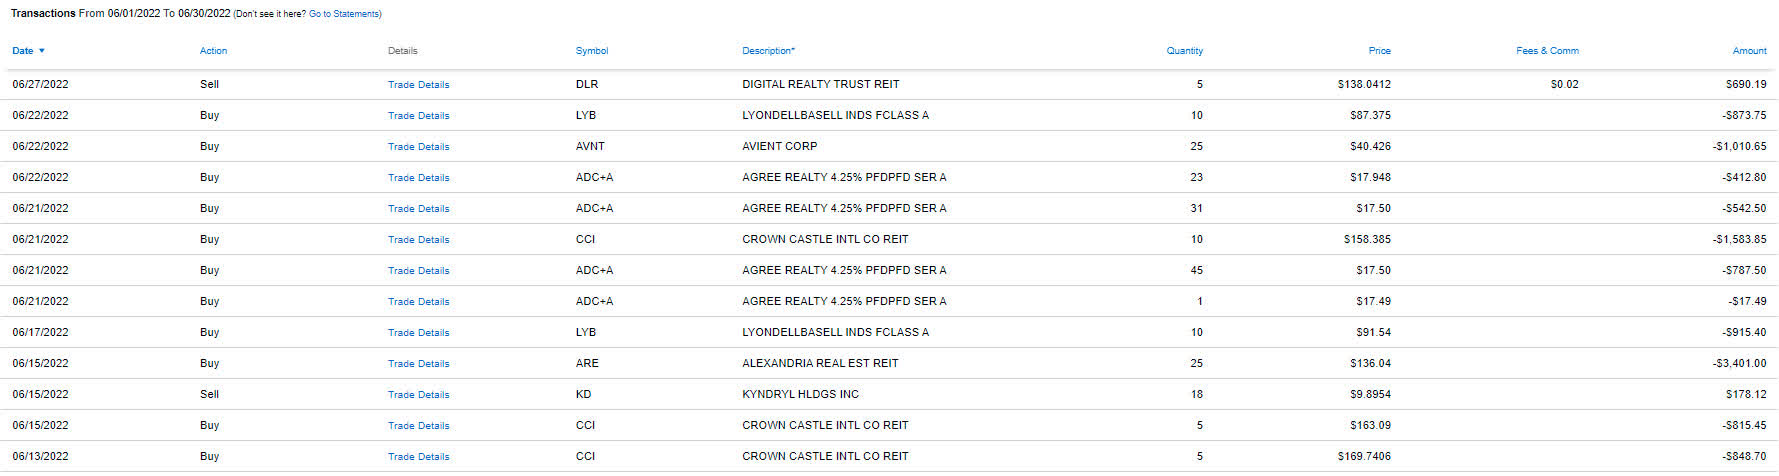
Below is a list of the trades that took place in the Roth IRA during the month of June.
Roth IRA – June – Trades (Charles Schwab)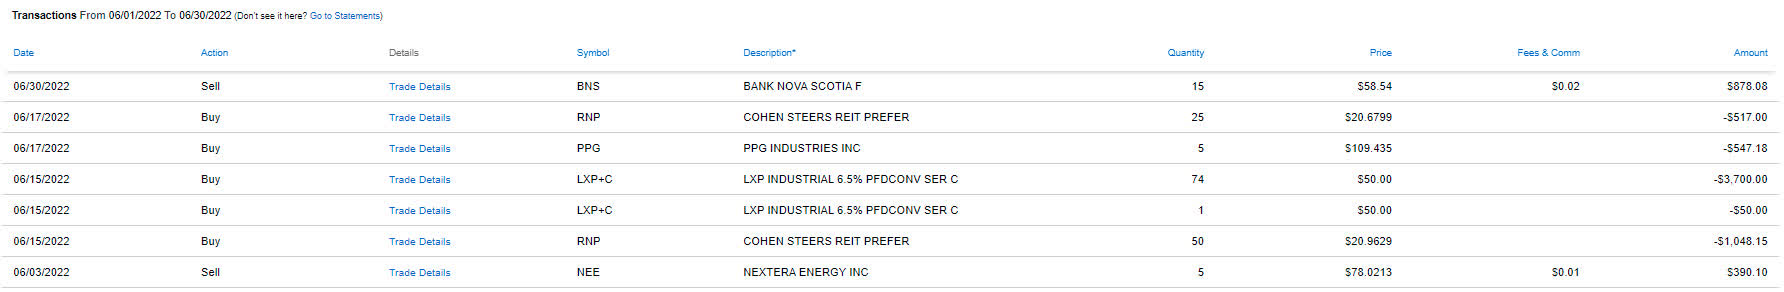
Agree Realty Preferred Series A
This awesome monthly dividend payer has a current share price that is too high for us to consider adding more. I really like Agree Realty’s (ADC) portfolio but again its share price is too high to justify adding common shares at this point in time. Funny enough, the reason that I found out about the company’s preferred shares was due to comments that was left on a previous portfolio update for John’s retirement accounts. At a PAR price of $25, ADC.PRA trades at a yield of 4.25% which isn’t compelling in the current rate environment at the time of purchase shares, we were able to buy all portions of the position for less than $18/share or a yield close to 6%. Additionally, if the shares are held to term and they are called for the PAR price of $25 this will result in a gain of seven dollars/share or a total of $700 in capital gains. We plan to continue adding to this position as long as shares remain attractive.
Alexandria Realty
Alexandria Realty (ARE) is another new position in Jane’s Traditional IRA that was entered into at $136/share and is off its high of $225/share in January 2022. ARE’s 10-year average P/AFFO is approximately 25.5X and currently trades at a P/AFFO of 23.2X. The last time ARE treated at a discount to its average P/AFFO was during COVID and then for only a brief period of time at the end of 2018/early 2019. For those looking for a compelling article reviewing ARE’s situation I would recommend reading Dane Bowler’s article Alexandria Is Life Science Growth At An Office Discount.
Alexandria Real Estate – July (FastGraphs)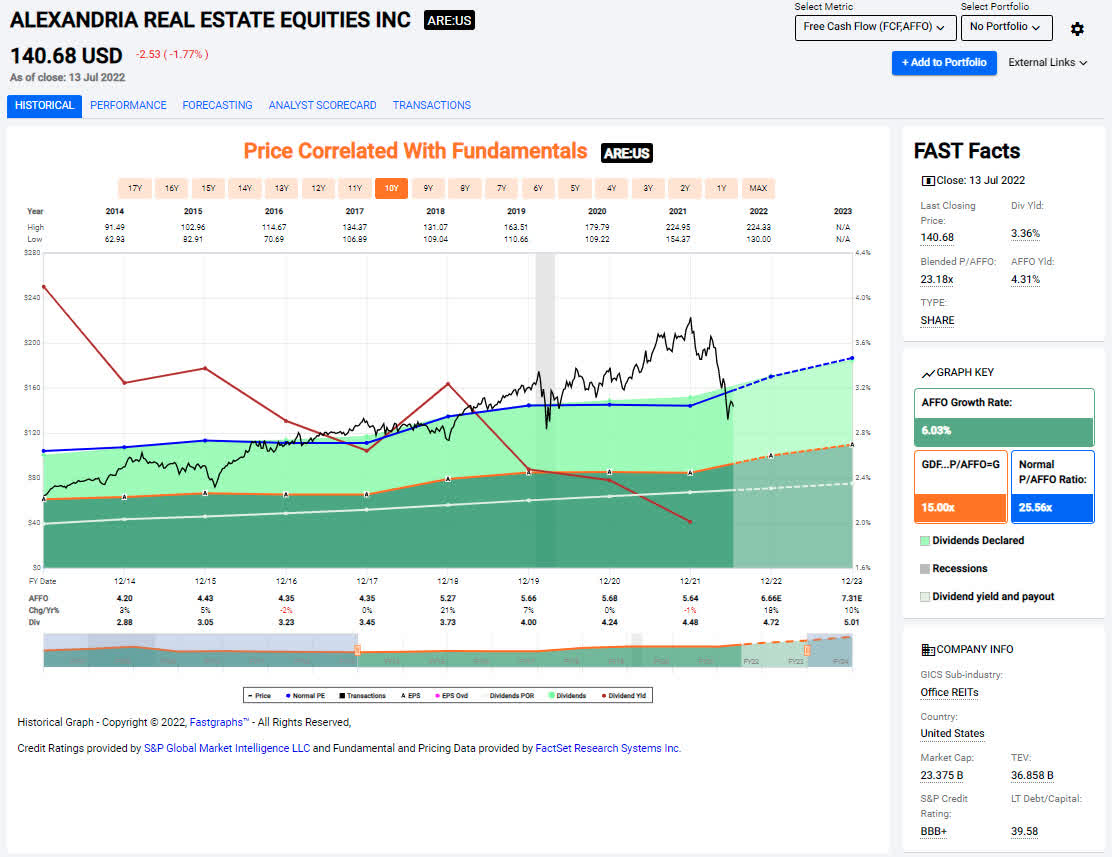
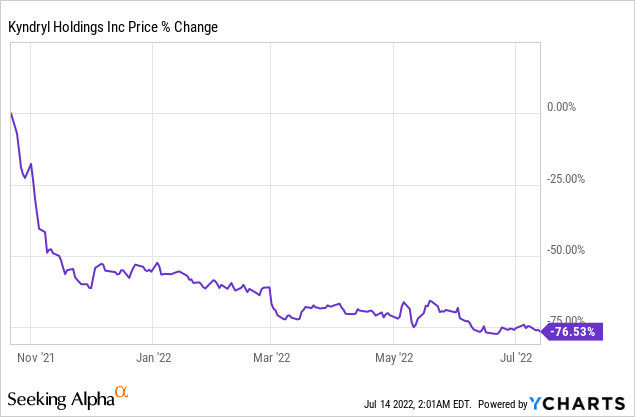
Kyndryl Holdings
We originally held on to Kyndryl Holdings (KD) after it was spun off from IBM. Simply put, the stock has performed terribly and with a whopping total of 18 shares we felt it was time to say goodbye to this company. KD does not provide any dividends and with its speculative growth potential it doesn’t have a place in Jane’s portfolio over the long-term.
Lexington Preferred Series C
LXP.PC typically trades above its PAR value of $50/share. Whenever the stock drops to (or in some cases below) $50/share I try to purchase some because it is a solid income investment with a 6.5% yield. These shares are what we refer to as non-callable preferred shares which give all the benefits of preferred stock with no set redemption date. The price of these shares have been steady even when LXP’s business model was in question (the company has made a significant transition over the last five years and now focuses on industrial real estate).
If anyone has questions about the other traits that took place in either of the Traditional IRA or Roth IRA feel free to ask in the comment section and I will be happy to discuss those trades.
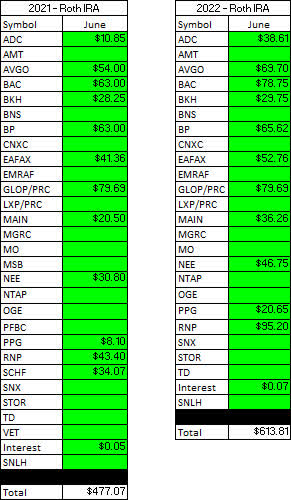
June Income Tracker – 2021 Vs. 2022
Income for the month of June was up significantly year-over-year for Jane’s Traditional IRA and up considerably for the Roth IRA. The average monthly income for the Traditional IRA in 2022 is expected to be up about 11.3% based on current estimates (this is up from 5.3% in May due to LYB’s special dividend) and the Roth IRA is looking to grow by 5.3%. This means the Traditional IRA would generate an average monthly income of $1,543.26/month and the Roth IRA would generate an average income of $623.97/month. This compares with 2021 figures that were $1,386.13/month and $592.61/month, respectively.
SNLH = Stocks No Longer Held – Dividends in this row represent the dividends collected on stocks that are no longer held in that portfolio. We still count the dividend income that comes from stocks no longer held in the portfolio even though it is non-recurring.
All images below come from Consistent Dividend Investor, LLC. (Abbreviated to CDI).
Traditional IRA – 2021 V 2022 – June Dividends (CDI) Roth IRA – 2021 V 2022 – June Dividends (CDI)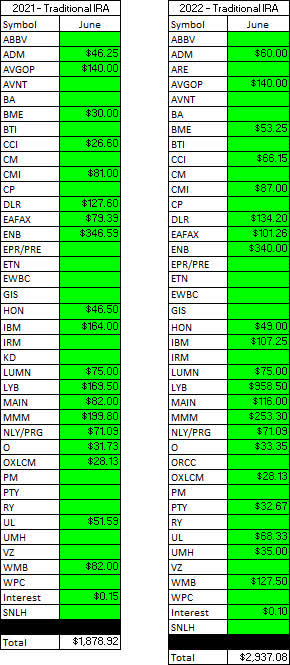
Here is a graphical illustration of the dividends received on a monthly basis for the Traditional and Roth IRAs.
Retirement Projections – 2022 – June – Monthly Dividends (Bar Graph) (CDI)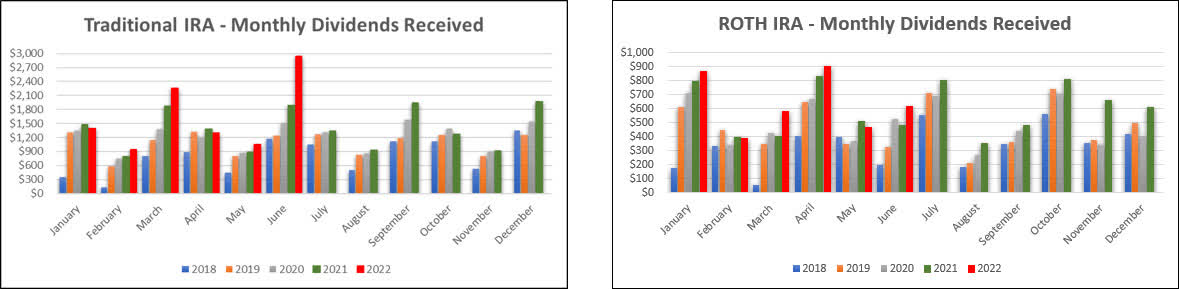
The table below represents the actual full-year results for 2022 and the prior year.
Retirement Projections – 2022 – June (CDI)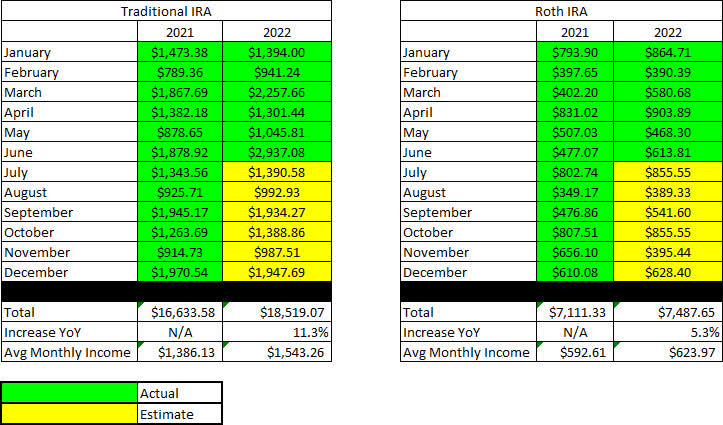
Below is an expanded table that shows the full dividend history since inception for both the Traditional IRA and Roth IRA.
Retirement Projections – 2022 – June – 5 YR History (CDI)
I have included line graphs that better represent the trends associated with Jane’s monthly dividend income generated by her retirement accounts. The images below represent the Traditional IRA and Roth IRA, respectively.
Retirement Projections – 2022 – June – Monthly Dividends (CDI)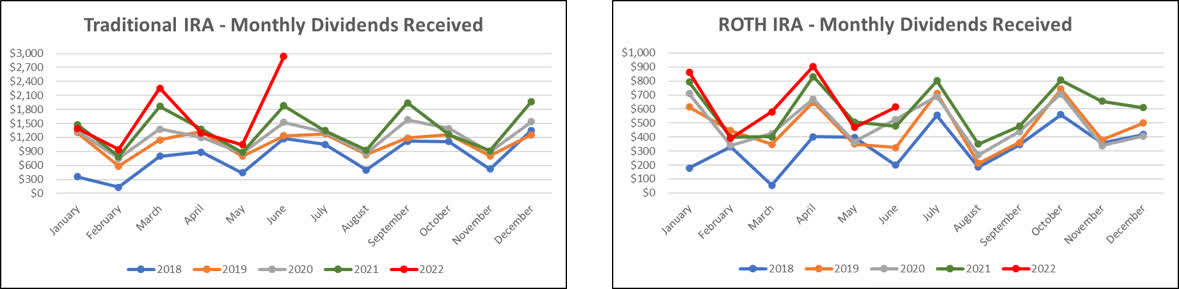
Here is a table to show how the account balances stack up year over year (I previously used a graph but believe the table is more informative).
It is worth noting that with John and Jane Retired, there will be no additional contributions to these accounts. In fact, they have already begun to take regular distributions from the Taxable Account and John’s Traditional IRA.
Retirement Account Balances – 2022 – June (CDI)
The next images are the tables that indicate how much cash Jane had in her Traditional and Roth IRA Accounts at the end of the month as indicated on their Charles Schwab statements.
Retirement Projections – 2022 – June – Cash Balances (CDI)
The next image provides a history of the unrealized gain/loss at the end of each month in the Traditional and Roth IRAs going back to the beginning in January of 2018.
Retirement Projections – 2022 – June – Unrealized Gain-Loss (CDI)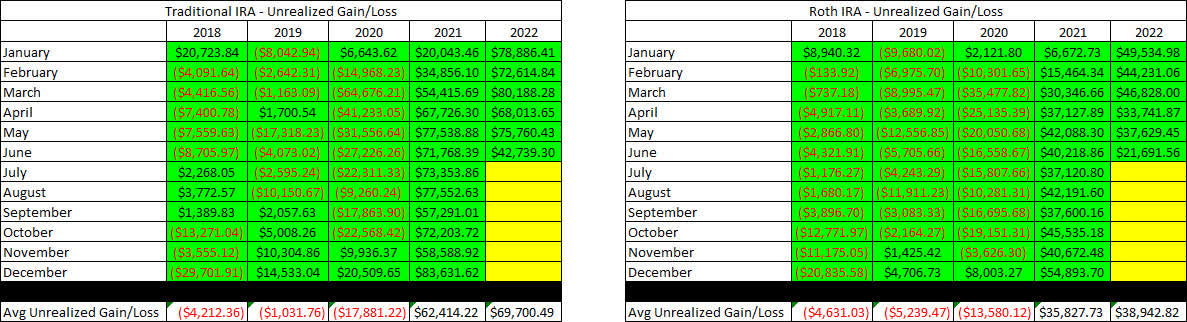
I like to show readers the actual unrealized gain/loss associated with each position in the portfolio because it is important to consider that in order to become a proper dividend investor, it is necessary to learn how to live with volatility. The market value and cost basis below are accurate at the market close on July 13th.
Here is the unrealized gain/loss associated with Jane’s Traditional and Roth IRAs.
Traditional IRA – 2022 – June – Gain-Loss (CDI) Roth IRA – 2022 – June – Gain-Loss (CDI)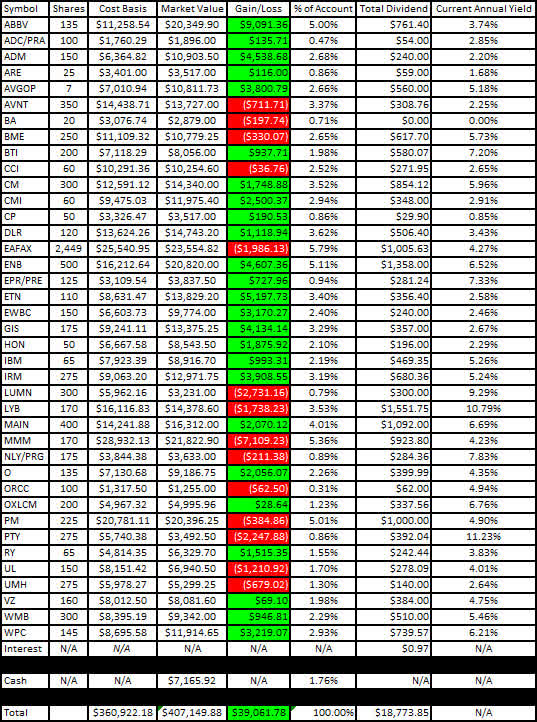

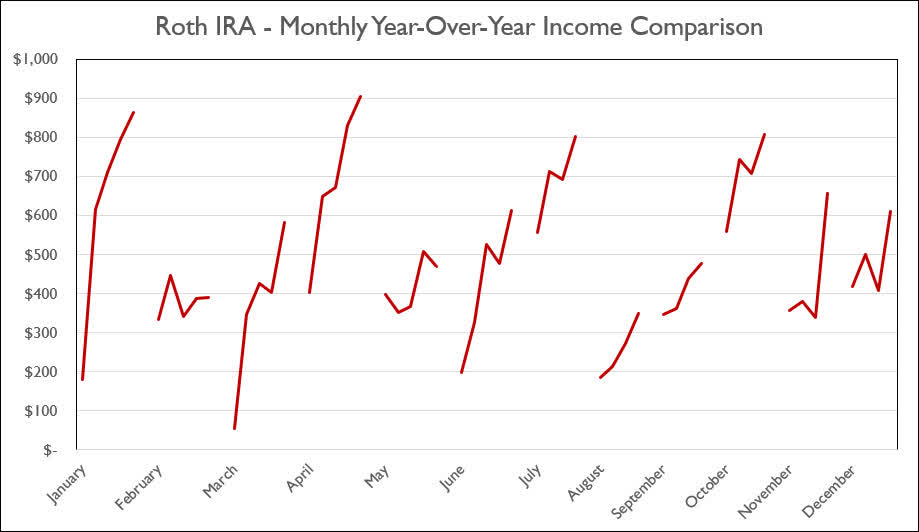
The last two graphs show how dividend income has increased, stayed the same, or decreased in each respective month on an annualized basis. I believe that the graph will continue to become more valuable as more years of data become available (with the fifth year of data being added, we can really see the trajectory of the income change for each month).
Traditional IRA – 2022 – June – Monthly Year-Over-Year Comparison (CDI) Roth IRA – 2022 – June – Monthly Year-Over-Year Comparison (CDI)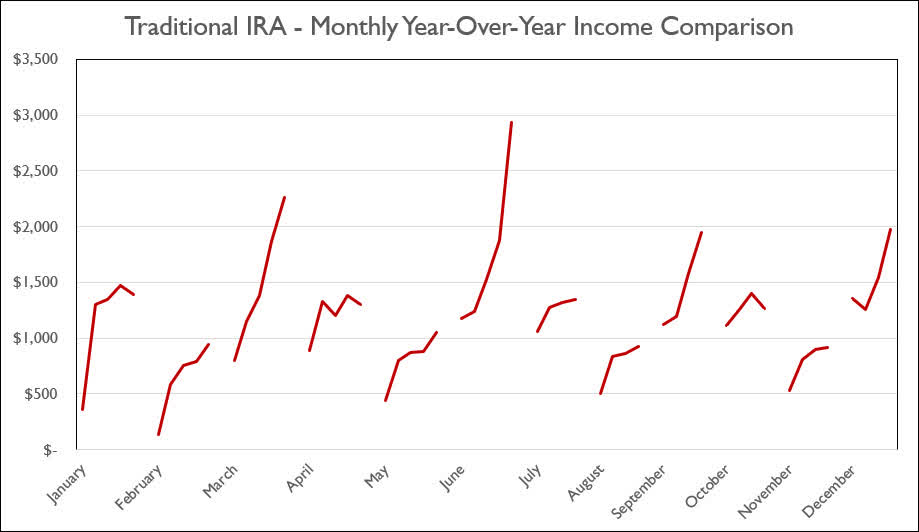
Conclusion
June was a rough month for account balances but the special dividends and increases were more than enough to compensate for this temporary drop in account value. In addition to this, readers can see a significant amount of trades which has allowed us to rotate capital from certain sectors and reduce exposure to certain positions while building positions in other positions that we consider to be undervalued.
June Articles
I have provided the link to the June 2022 Taxable Account below.
The Retirees’ Dividend Portfolio: John And Jane’s June Taxable Account Update
In Jane’s Traditional and Roth IRAs, she is currently long the following mentioned in this article: AbbVie (NYSE:ABBV), Agree Realty (NYSE:ADC), Agree Realty Preferred Series A (ADC.PRA), Archer-Daniels-Midland (NYSE:ADM), Broadcom (NASDAQ:AVGO), Avient (NYSE:AVNT), Broadcom Preferred Series A (NASDAQ:AVGOP), Boeing (NYSE:BA), Bank of America (NYSE:BAC), Black Hills Corp. (NYSE:BKH), BlackRock Health Sciences Trust (NYSE:BME), Bank of Montreal (NYSE:BMO), Bank of Nova Scotia (NYSE:BNS), BP (NYSE:BP), British American Tobacco (NYSE:BTI), Canadian Imperial Bank of Commerce (NYSE:CM), Cummins (NYSE:CMI), Concentrix (NASDAQ:CNXC), Digital Realty (NYSE:DLR), Eaton Vance Floating-Rate Advantage Fund A (MUTF:EAFAX), Enbridge (NYSE:ENB), EPR Properties Preferred Series E (NYSE:EPR.PE), Eaton Corporation (NYSE:ETN), Emera Inc. (OTCPK:EMRAF), East West Bancorp (NASDAQ:EWBC), General Mills (NYSE:GIS), GasLog Partners Preferred C (NYSE:GLOP.PC), Honeywell (NASDAQ:HON), International Business Machines (NYSE:IBM), Iron Mountain (NYSE:IRM), Lexington Realty Preferred Series C (NYSE:LXP.PC), Lumen Technologies (NYSE:LUMN), LyondellBasell (NYSE:LYB), Main Street Capital (NYSE:MAIN), McGrath RentCorp (NASDAQ:MGRC), 3M (NYSE:MMM), Altria (NYSE:MO), Annaly Capital Preferred Series G (NYSE:NLY.PG), NextEra Energy (NYSE:NEE), NetApp (NASDAQ:NTAP), Realty Income (NYSE:O), OGE Energy Corp. (NYSE:OGE), Oxford Lane Capital Corp. 6.75% Cum Red Pdf Shares Series 2024 (NASDAQ:OXLCM), Philip Morris (NYSE:PM), PPG Industries (NYSE:PPG), PIMCO Corporate & Income Opportunity Fund (PTY), Cohen & Steers REIT & Preferred Income Fund (NYSE:RNP), Royal Bank of Canada (NYSE:RY), TD SYNNEX Corp. (NYSE:SNX), STORE Capital (NYSE:STOR), Toronto-Dominion Bank (NYSE:TD), Unilever (NYSE:UL), UMH Properties (UMH), Verizon (NYSE:VZ), Williams Companies (NYSE:WMB), W. P. Carey (NYSE:WPC).
Be the first to comment