

Deagreez
Can you guess the best industry to have invested in over the past 100 years? You might think something to do with technology, like Apple (AAPL). Or maybe a consumer discretionary world-beater like Amazon (AMZN). Or Microsoft (MSFT)?
Ploutos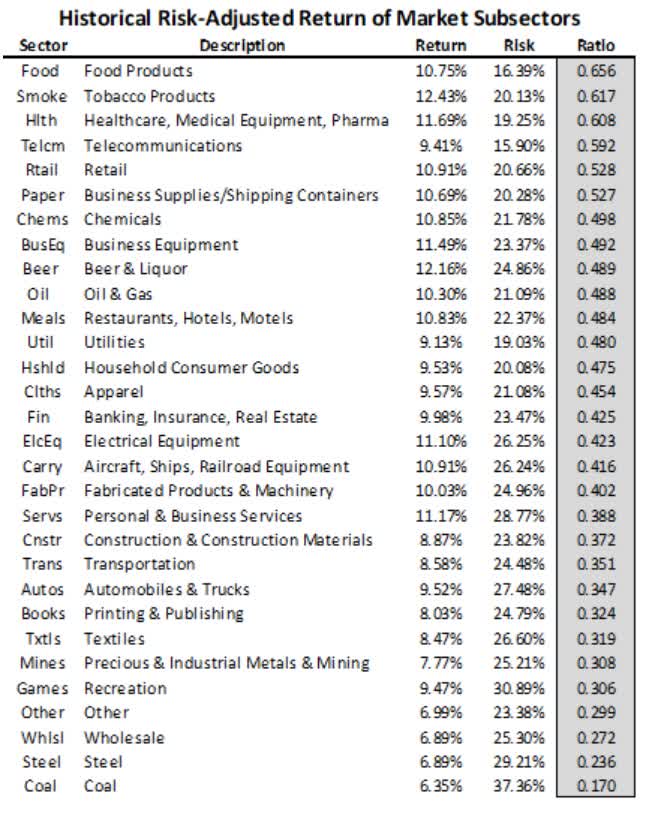
The answer is tobacco which has delivered an incredible 12.4% return over the last 96 years.
- 76,882X increase
- 4,646X adjusted for inflation.
The best performing stock? Altria Group, Inc. (MO), up 173,000X, adjusted for inflation.
Adjusted for volatility, that’s the second best risk-adjusted return of any industry.
How can that be? Haven’t smoking rates been falling since the 1950s? They have indeed.
Didn’t the government ban tobacco advertising on TV in 1970? Yup.
In 2000 they banned smoking on planes.
Starting in 1995, states started banning smoking in restaurants.
In 1998 the Master Settlement Agreement, after 46 states’ Attorney Generals sued big tobacco, resulted in the industry having to pay $206 billion over the next 25 years (through 2023).
And in recent years, several countries, including the entire EU, have banned menthol cigarettes, by far the most popular kind.
Throughout all this, tobacco blue-chips like Philip Morris International Inc. (NYSE:PM), Altria, and British American Tobacco p.l.c. (BTI), have done what all world-beater blue-chips have done throughout history: adapt and overcome any and all challenges.
Today, I wanted to highlight Philip Morris’s most recent move to pivot away from tobacco entirely to a smoke-free future. One in which big tobacco turns into big nicotine and is viewed as no more “evil” than big alcohol is today.
Let’s take a look at the most important things income investors need to know about PM’s plans for a smoke-free future, including the good, bad, and wonderful.
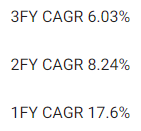
That includes how PM has the potential for life-changing and generational wealth building 10X, 100X, and 2,200X inflation-adjusted returns over the next 30, 60, and 100 years, respectively.
The Bad News About Philip Morris
Let’s start with the bad news first.
PM Gets A Quality Downgrade
- Negative outlook credit ratings from Swedish Match acquisition
- Moody’s poor risk management rating
- elevated payout ratios in the next few years due to acquisition
- safety score falls 1% below very safe levels
There are many ways to measure safety and quality, and I factor in pretty much all of them.
The Dividend Kings’ overall quality scores are based on a 269-point model that includes the following:
-
Dividend safety
-
Balance sheet strength
-
Credit ratings
-
Credit default swap medium-term bankruptcy risk data
-
Short and long-term bankruptcy risk
-
Accounting and corporate fraud risk
-
Profitability and business model
-
Growth consensus estimates
-
Management growth guidance
-
Historical earnings growth rates
-
Historical cash flow growth rates
-
Historical dividend growth rates
-
Historical sales growth rates
-
Cost of capital
-
GF Scores
-
Morningstar business model uncertainty score
-
Long-term risk-management scores from Moody’s, MSCI, Morningstar, FactSet, S&P, Reuters’/Refinitiv, and Just Capital
-
Management quality
-
Dividend-friendly corporate culture/income dependability
-
Long-term total returns (a Ben Graham sign of quality)
-
Analyst consensus long-term return potential
It includes over 1,000 fundamental metrics, including the 12 rating agencies we use to assess fundamental risk.
-
credit and risk management ratings make up 41% of the DK safety, and quality model
-
dividend/balance sheet/risk ratings make up 82% of the DK safety and quality model
How do we know that our safety and quality model works well?
During the two worst recessions in 75 years, our safety model showed 87% of blue-chip dividend cuts, the ultimate baptism by fire for any dividend safety model.
How does PM score on our comprehensive safety and quality models?
PM Dividend Safety
| Rating | Dividend Kings Safety Score (192 Point Safety Model) | Approximate Dividend Cut Risk (Average Recession) | Approximate Dividend Cut Risk In Pandemic Level Recession |
| 1 – unsafe | 0% to 20% | over 4% | 16+% |
| 2- below average | 21% to 40% | over 2% | 8% to 16% |
| 3 – average | 41% to 60% | 2% | 4% to 8% |
| 4 – safe | 61% to 80% | 1% | 2% to 4% |
| 5- very safe | 81% to 100% | 0.5% | 1% to 2% |
| PM | 80% | 1.0% | 2.10% |
| Risk Rating | Low-Risk (70th industry percentile risk-management consensus) | A Negative Outlook rating = 0.66% 30-year bankruptcy risk | 15% OR LESS Max Risk Cap Recommendation |
Long-Term Dependability
| Company | DK Long-Term Dependability Score | Interpretation | Points |
| Non-Dependable Companies | 20% or below | Poor Dependability | 1 |
| Low Dependability Companies | 21% to 59% | Below-Average Dependability | 2 |
| S&P 500/Industry Average | 60% (60% to 69% range) | Average Dependability | 3 |
| Above-Average | 70% to 79% | Very Dependable | 4 |
| Very Good | 80% or higher | Exceptional Dependability | 5 |
| PM | 80% | Exceptional Dependability | 5 |
Overall Quality
| PM | Final Score | Rating |
| Safety | 80% | 4/5 Safe |
| Business Model | 80% | 3/3 Wide And Stable Moat |
| Dependability | 80% | 5/5 Exceptional |
| Total | 80% | 12/13 Super SWAN Dividend King |
| Risk Rating | 4/5 Low-Risk | |
| 20% OR LESS Max Risk Cap Rec |
10% Margin of Safety For A Potentially Good Buy |
PM is the 253rd highest quality company on the DK 500 Masterlist.
How significant is this? The DK 500 Master List is one of the world’s best watchlists, including
- every dividend aristocrat (S&P companies with 25+ year dividend growth streaks)
- every dividend champion (every company, including foreign, with 25+ year dividend growth streaks)
- every dividend king (every company with 50+ year dividend growth streaks)
- every foreign aristocrat (every company with 20+ year dividend growth streaks)
- every Ultra SWAN (wide moat aristocrats, as close to perfect quality companies as exist)
- 40 of the world’s best growth stocks
In other words, even among the world’s best companies, PM is higher quality than 49% of them, similar in quality to such aristocrats and Super SWANs as:
- Caterpillar (CAT): Ultra SWAN dividend aristocrat
- Roper Technologies (ROP): Super SWAN dividend aristocrat
- General Dynamics (GD): Super SWAN dividend aristocrat
- McDonald’s (MCD): Super SWAN dividend aristocrat
- Eli Lilly (LLY): Super SWAN.
PM Credit Ratings
| Rating Agency | Credit Rating | 30-Year Default/Bankruptcy Risk | Chance of Losing 100% Of Your Investment 1 In |
| S&P | A Negative Watch | 0.60% | 166.7 |
| Fitch | A Negative Watch | 0.60% | 166.7 |
| Moody’s | A2 (A equivalent) Negative Watch | 0.60% | 166.7 |
| Consensus | A Negative Watch | 0.60% | 166.7 |
(Source: S&P, Fitch, Moody’s)
Rating agencies are not too pleased with PM’s mostly debt-funded $16 billion acquisition of Swedish Match.
- negative outlook = 33% chance of a downgrade
- a negative watch means a rating is under review for a likely downgrade (emphasis added):
Philip Morris International ‘A’ Ratings Placed On CreditWatch Negative On Announced Offer To Acquire Swedish Match AB
The negative CreditWatch placement reflects our view that there is an increased likelihood that we could lower the rating on PMI by one notch. PMI proposed acquisition of Swedish Match assumes a total consideration of about $16 billion, to be paid fully in cash. Under our base case scenario–accounting for the proposed transaction–we expect PMI’s S&P Global Ratings-adjusted debt to EBITDA (pro forma) in 2022 to be about 3.0x, up from 1.9x in 2021. For subsequent years, we then expect a gradual deleveraging trend, with adjusted leverage remaining in the 2.5x-3.0x range. The deleveraging trend is supported by recurring and healthy annual free operating cash flow (FOCF) reported in the range of $9.0 billion-$9.5 billion (after capital expenditure and working capital requirements), although most of this will be used for dividend payments, with an estimated annual cash-out of about $8.0 billion, growing progressively each year. Positively, the company announced the suspension of its share buyback program which began in July 2021.” – S&P
Fitch and Moody’s provided the same rationale about increased leverage due to the deal.
- the downgrade is limited to one notch
- A- stable = 2.5% 30-year bankruptcy risk
- still the strongest balance sheet in the industry
The Good News About Philip Morris
Why is PM buying Swedish Match?
Swedish Match is the global market leader in oral nicotine products, with a strong presence in the U.S. (64% of its sales in 2021) and Scandinavia. The transaction would primarily allow PMI to accelerate its smoke-free sales target, expand into the large and profitable U.S. market, and accelerate the expansion of oral nicotine outside existing markets.” – S&P
This deal makes strategic sense for PM, which is working on a smoke-free future where it sells zero cigarettes and just reduced-risk products and medical vaporizers.
Swedish Match Is A Growth Powerhouse
(Source: FactSet Research Terminal)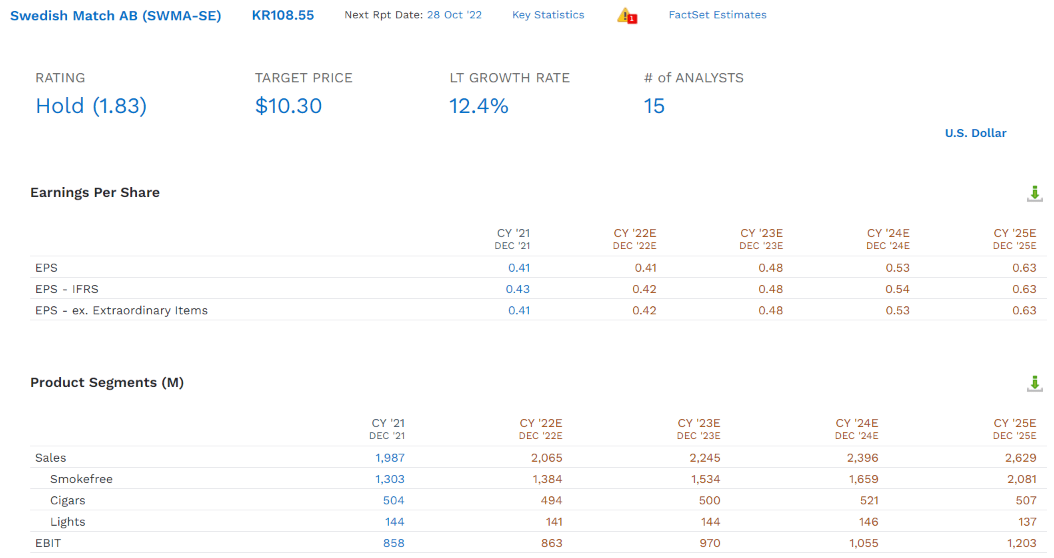
Swedish Match is expected to grow earnings at 12.4% over time and will immediately boost PM’s sales by about 5%.
- PM is paying 8.1X EV/EBITDA for Swedish Match, a very attractive price
- some Swedish Match shareholders are upset and trying to block the deal because it’s too cheap
(Source: PM investor presentation)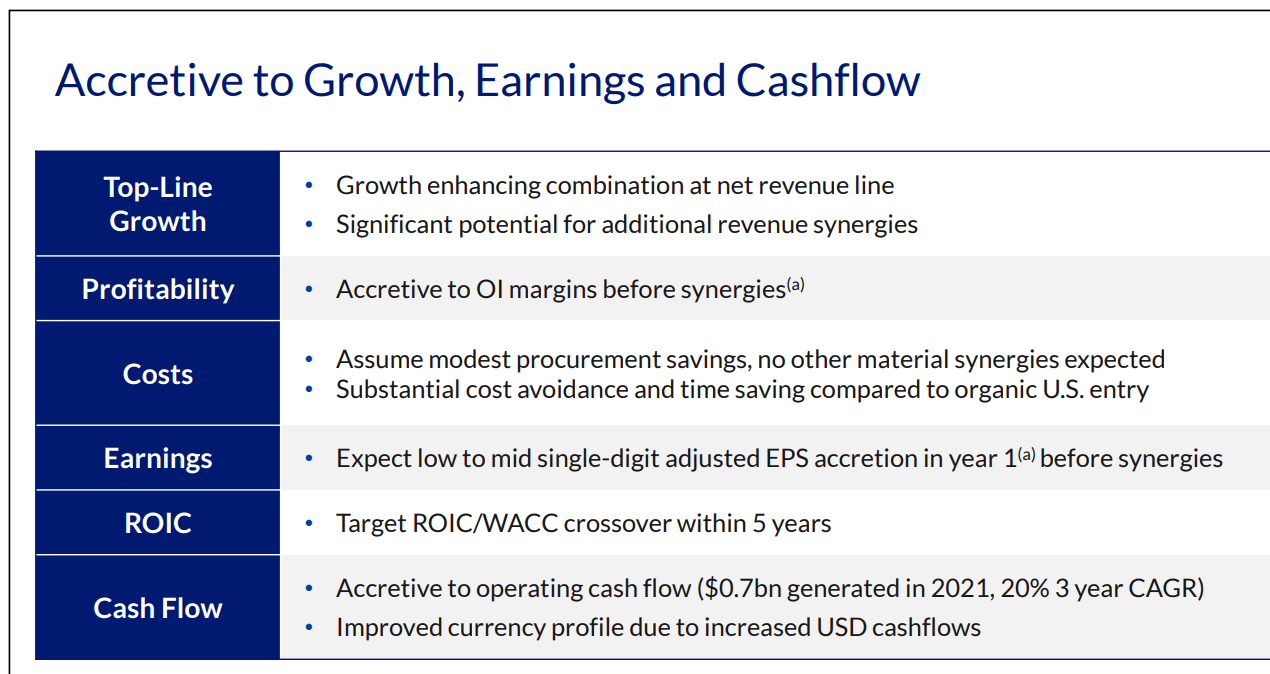
PM says this deal will instantly boost EPS and margins, and that’s before potential cost cutting.
- expected to close Q4 2022
(Source: PM investor presentation)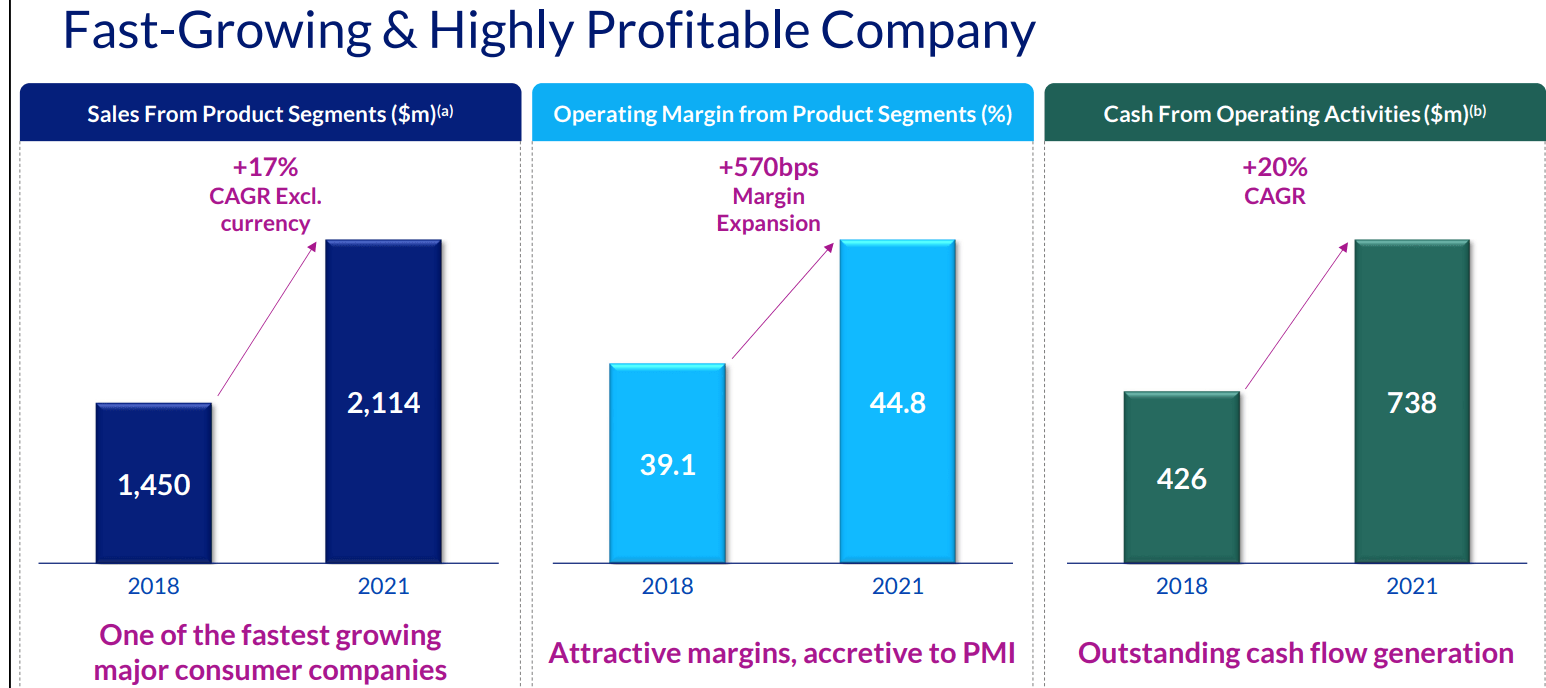
Swedish Match is growing sales at 17% annually, and margins are expanding rapidly.
(Source: PM investor presentation)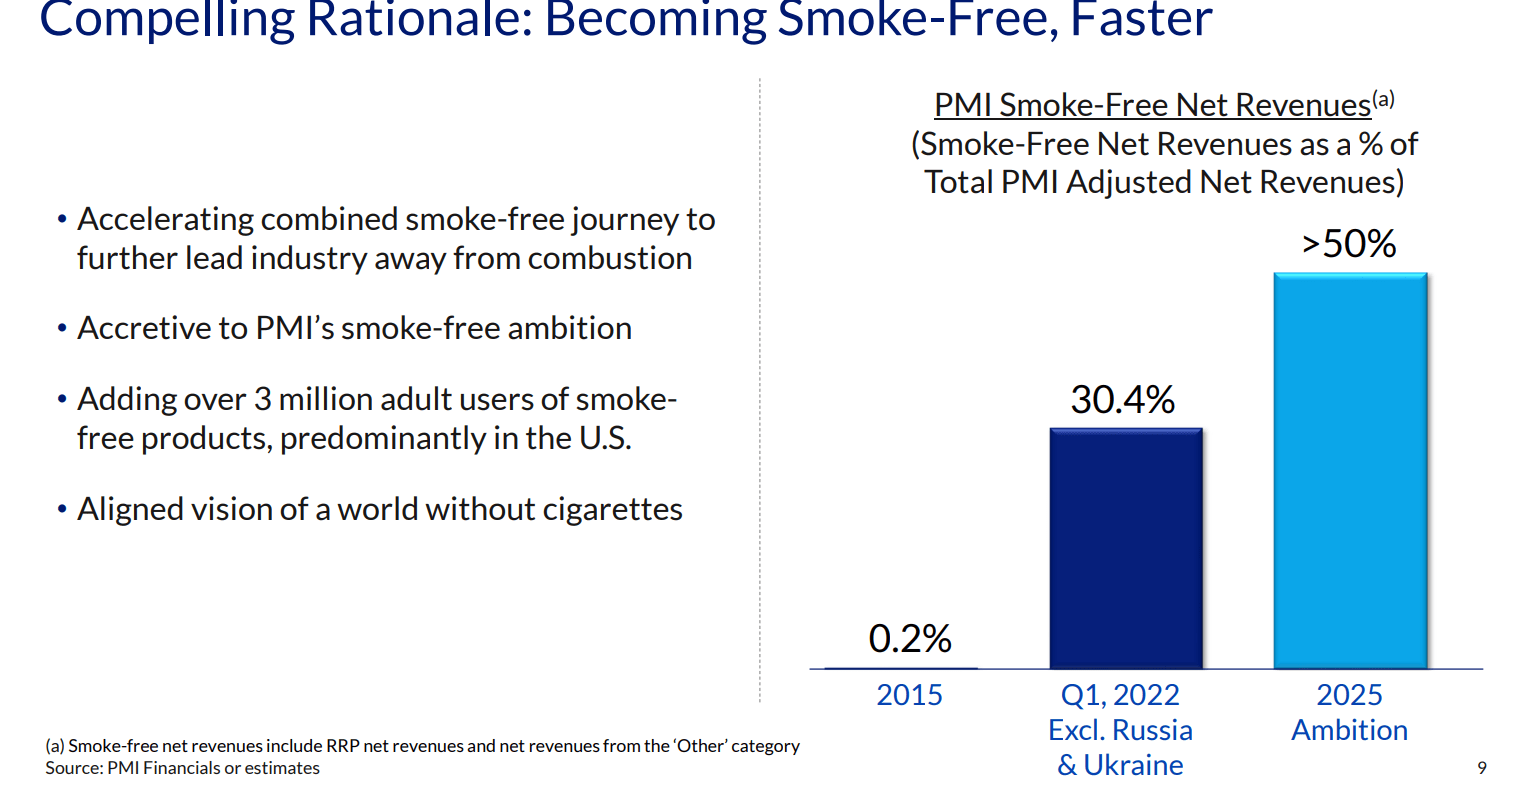
Once PM buys Swedish Match, it will be getting 30% of sales from reduced-risk products, well on its way to the goal of 50+% by 2025.
- 3 million new RRP users is approximately a 15% increase overnight
(Source: PM investor presentation)
PM has the strongest RRP portfolio in the industry after this acquisition.
- though BTI is #1 in global vaping and growing RRPs at 50% per year
- PM is the industry leader but losing market share to BTI
- thus the reason it’s buying Swedish Match
PM believes oral nicotine pouches will grow 30% to 40% CAGR over the next five years.
- 3.7X to 5.4X
- to $7.4 billion to $10.8 billion global market ($2 billion today)
For context, PM’s 2023 sales are expected to be $31 billion.
- with 50% global market share (less than Swedish Match has now) in 5 years, this could add about $5 billion to PM’s bottom line
- 15% sales boost Vs. 2023 levels
(Source: PM investor presentation)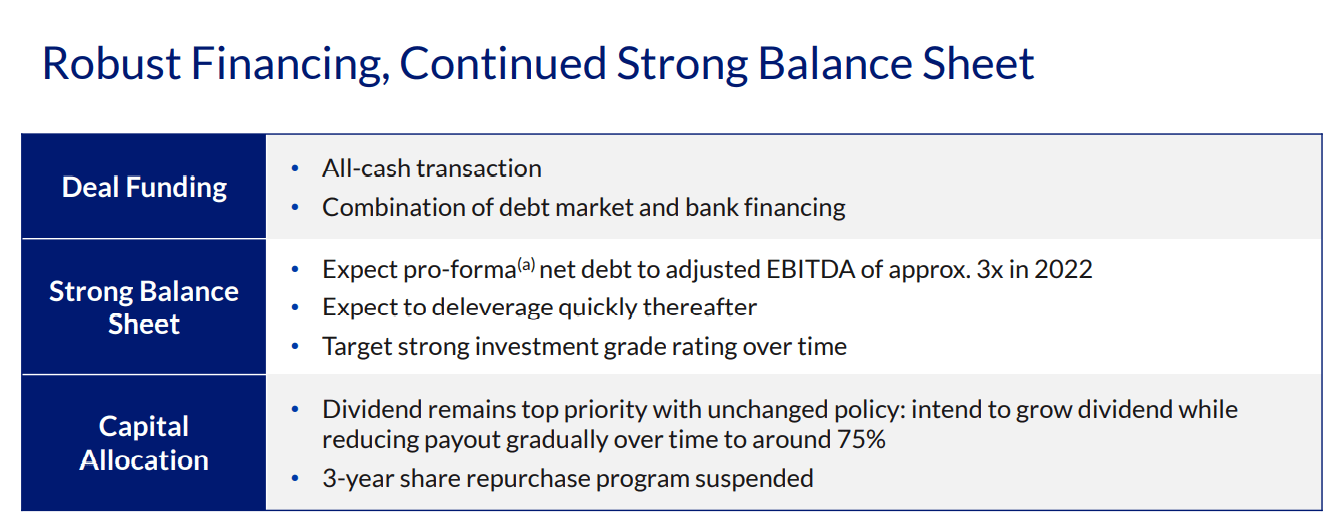
PM has suspended its buyback and remains committed to a long-term 75% payout ratio for its dividend.
- it’s going to be at least until 2025 or 2026 before PM can achieve that
- mostly due to the Ukraine invasion hurting RRP growth (20% of RRPs from Ukraine and Russia)
- not this acquisition
Credit Default Swaps: The Bond Market Has Already Priced In A Downgrade
(Source: FactSet Research Terminal)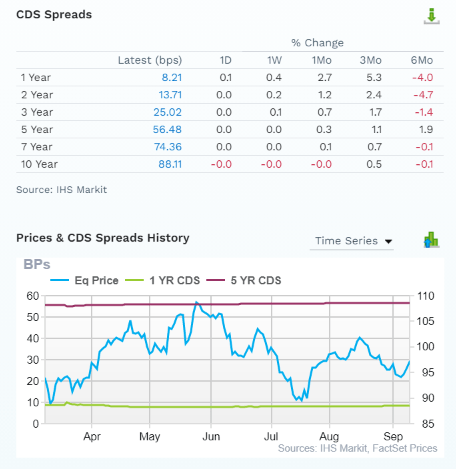
Credit default swaps are insurance policies bond investors take out against default and trade daily on the open market.
- they represent the real-time fundamental risk assessment of the most risk-averse investors in the world
- the “smart money” on Wall Street
PM’s default risk has remained steady over the last six months, while the price has been volatile.
- bond investors ignore stock prices and focus on fundamental risk
- so should long-term income growth investors
The bond market is pricing in a 2.6433% 30-year default risk, consistent with A- credit ratings to which all three agencies are planning to downgrade PM.
- fundamental risk rising from 0.6% to 2.5%
- a 4X increase
- but still low in absolute terms
- a 1 in 40 chance of losing all your money if you buy PM today
PM Leverage Consensus Forecast (Not Accounting For Swedish Match Acquisition)
| Year | Debt/EBITDA | Net Debt/EBITDA (3.0 Or Less Safe According To Credit Rating Agencies) |
Interest Coverage (8+ Safe) |
| 2021 | 2.29 | 1.61 | 21.48 |
| 2022 | 2.10 | 1.71 | 21.32 |
| 2023 | 1.98 | 1.59 | 22.55 |
| 2024 | 1.74 | 1.36 | 26.01 |
| Annualized Change | -8.64% | -5.54% | 6.59% |
(Source: FactSet Research Terminal)
Because of its industry-leading balance sheet, PM has the financial flexibility to take on $16 billion in debt.
PM Balance Sheet Consensus Forecast
| Year | Total Debt (Millions) | Cash | Net Debt (Millions) | Interest Cost (Millions) | EBITDA (Millions) | Operating Income (Millions) |
| 2021 | $33,105 | $5,888 | $23,310 | $628 | $14,486 | $13,488 |
| 2022 | $28,105 | $4,818 | $22,846 | $583 | $13,375 | $12,430 |
| 2023 | $27,772 | $4,861 | $22,261 | $577 | $13,992 | $13,012 |
| 2024 | $26,585 | $4,911 | $20,690 | $547 | $15,253 | $14,229 |
| 2025 | NA | $4,622 | NA | NA | NA | $16,231 |
| Annualized Growth | -7.05% | -5.87% | -3.90% | -4.50% | 1.73% | 4.74% |
(Source: FactSet Research Terminal)
PM is going into this deal with a rapidly de-leveraging balance sheet and steadily growing cash flows.
- Swedish Match’s 2023 consensus EBITDA is $1.03 billion
- 2023 consensus debt/EBITDA after the deal closes 2.91X
- just as rating agencies expect
- PM has suspended buybacks and will focus on de-leveraging in the coming years
The Wonderful News About Philip Morris
Why might you want to buy PM today?
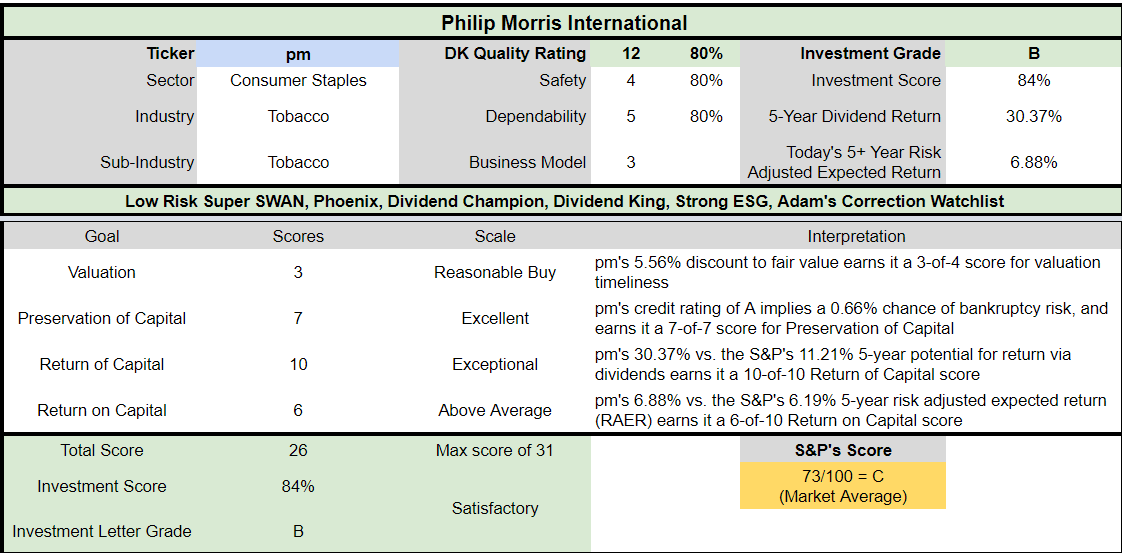
Reasons To Potentially Buy Philip Morris International Today
| Metric | Philip Morris International |
| Quality | 80% 12/13 SWAN (Sleep Well At Night) Dividend King |
| Risk Rating | Low |
| DK Master List Quality Ranking (Out Of 500 Companies) | 253 |
| Quality Percentile | 50% |
| Dividend Growth Streak (Years) | 53 |
| Dividend Yield | 5.20% |
| Dividend Safety Score | 80% Safe |
| Average Recession Dividend Cut Risk | 1.0% |
| Severe Recession Dividend Cut Risk | 2.1% |
| S&P Credit Rating |
A- Stable Outlook (accounting for downgrades) |
| 30-Year Bankruptcy Risk | 2.50% |
| Consensus LT Risk-Management Industry Percentile | 70% Good, Low Risk |
| Fair Value | $102.77 |
| Current Price | $97.06 |
| Discount To Fair Value | 6% |
| DK Rating |
Potentially Reasonable Buy |
| PE | 16.6 |
| Cash-Adjusted PE | 12.7 |
| Historical PE Range | 16.5 to 17.5 |
| LT Growth Consensus/Management Guidance |
5.1% |
| 5-year consensus total return potential |
7% to 11% CAGR |
| Base Case 5-year consensus return potential |
9% CAGR (10% better than the S&P 500) |
| Consensus 12-month total return forecast | 18% |
| Fundamentally Justified 12-Month Return Potential | 11% |
| LT Consensus Total Return Potential | 10.3% |
| Inflation-Adjusted Consensus LT Return Potential | 8.1% |
| Consensus 10-Year Inflation-Adjusted Total Return Potential (Ignoring Valuation) | 2.17 |
| LT Risk-Adjusted Expected Return | 7.03% |
| LT Risk-And Inflation-Adjusted Return Potential | 4.81% |
| Conservative Years To Double | 14.97 |
(Source: DK Zen Research Terminal)
Philip Morris 2024 Consensus Total Return Potential
(Source: FAST Graphs, FactSet Research)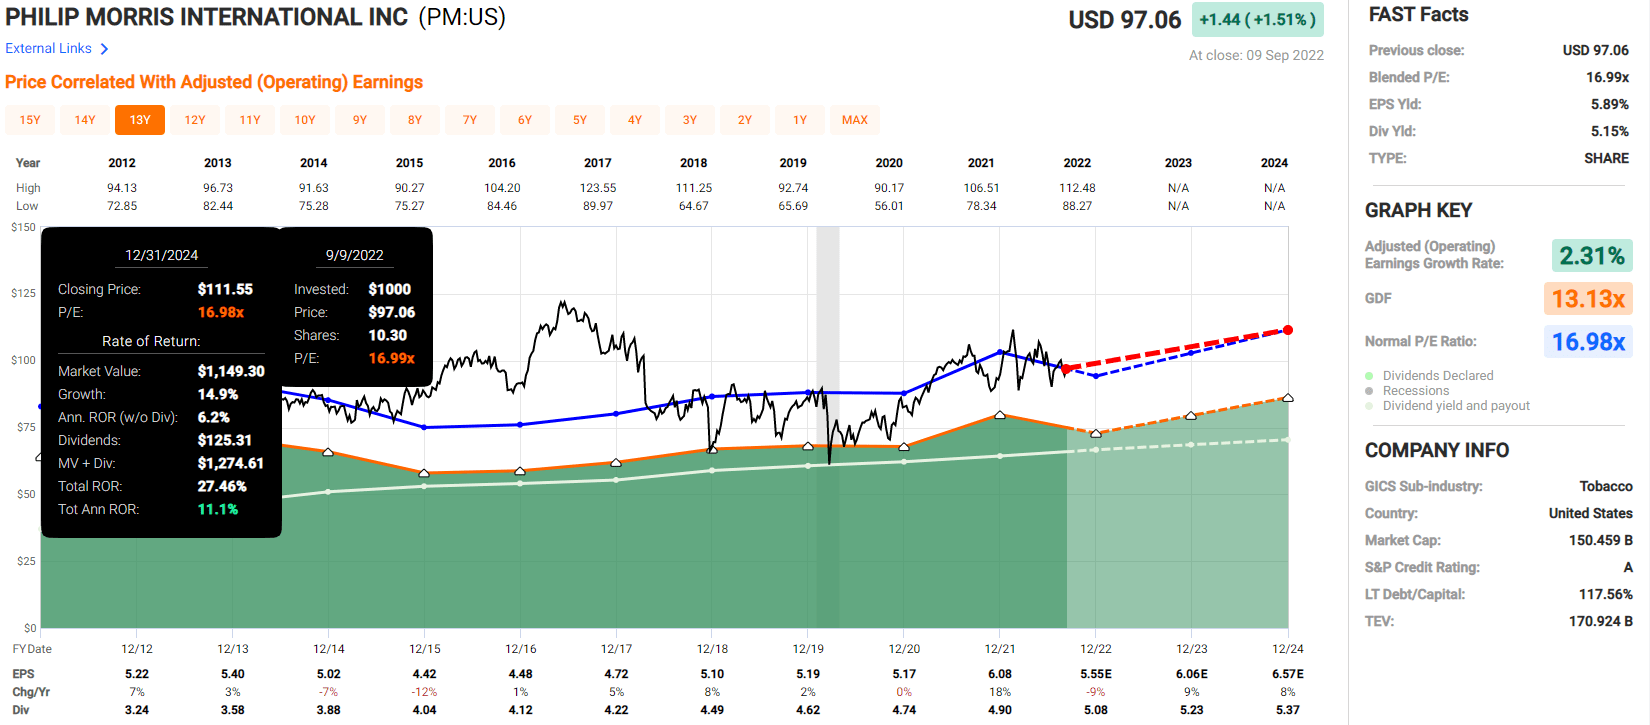
Philip Morris 2027 Consensus Total Return Potential
(Source: FAST Graphs, FactSet Research)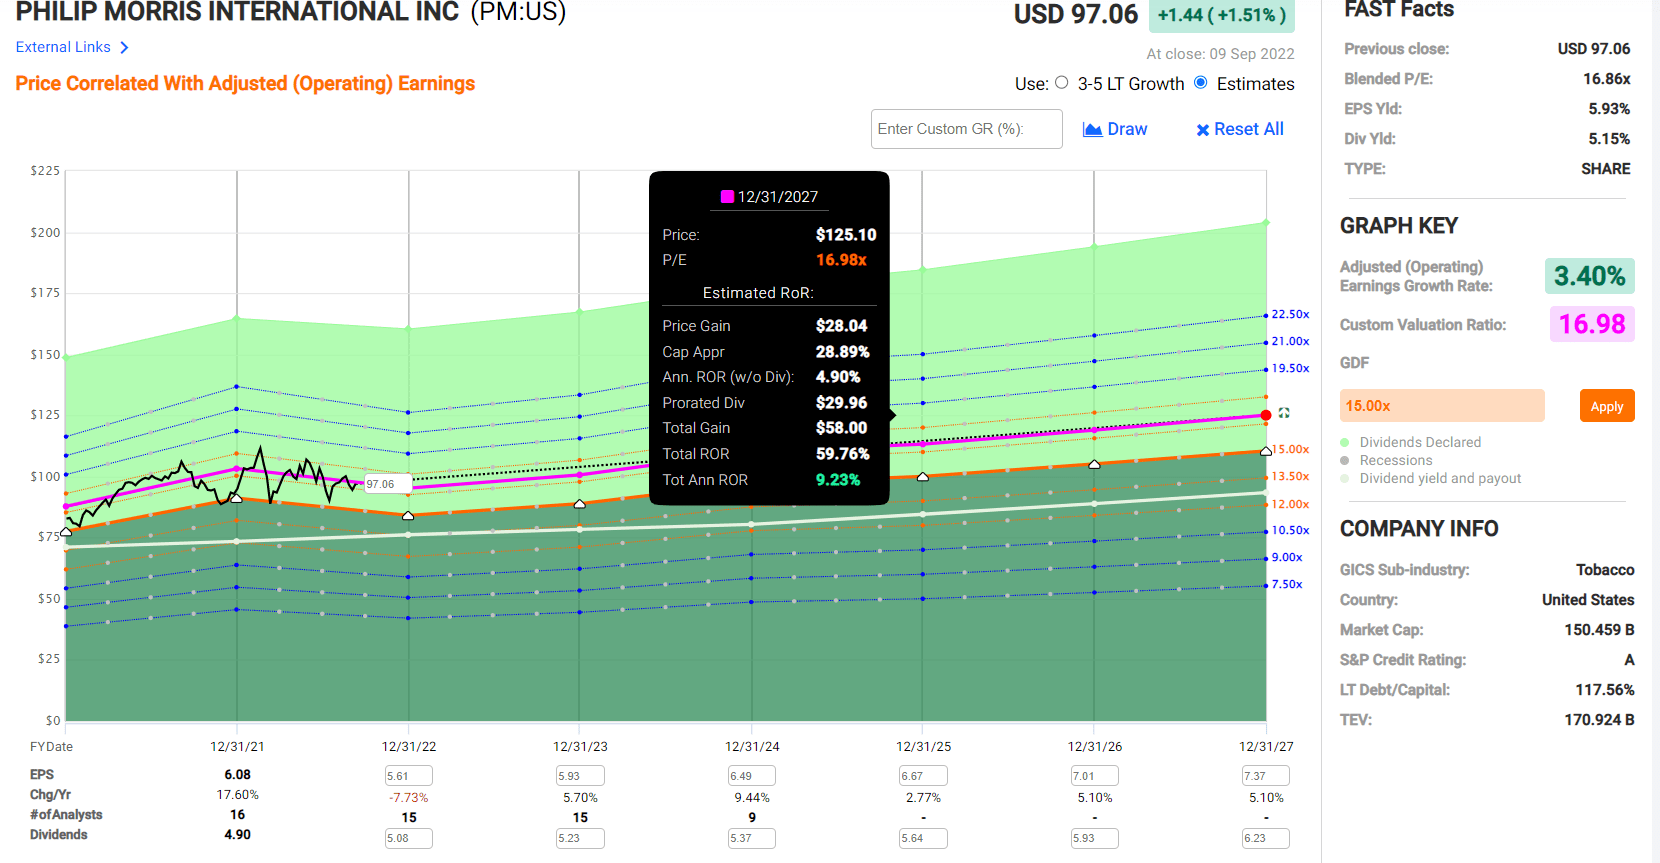
If PM grows as expected and returns to historical market-determined fair value, it could deliver 11% CAGR returns through 2024 and 9% through 2027.
Now compare that to the S&P 500.
S&P 500 2024 Consensus Total Return Potential
(Source: FAST Graphs, FactSet Research)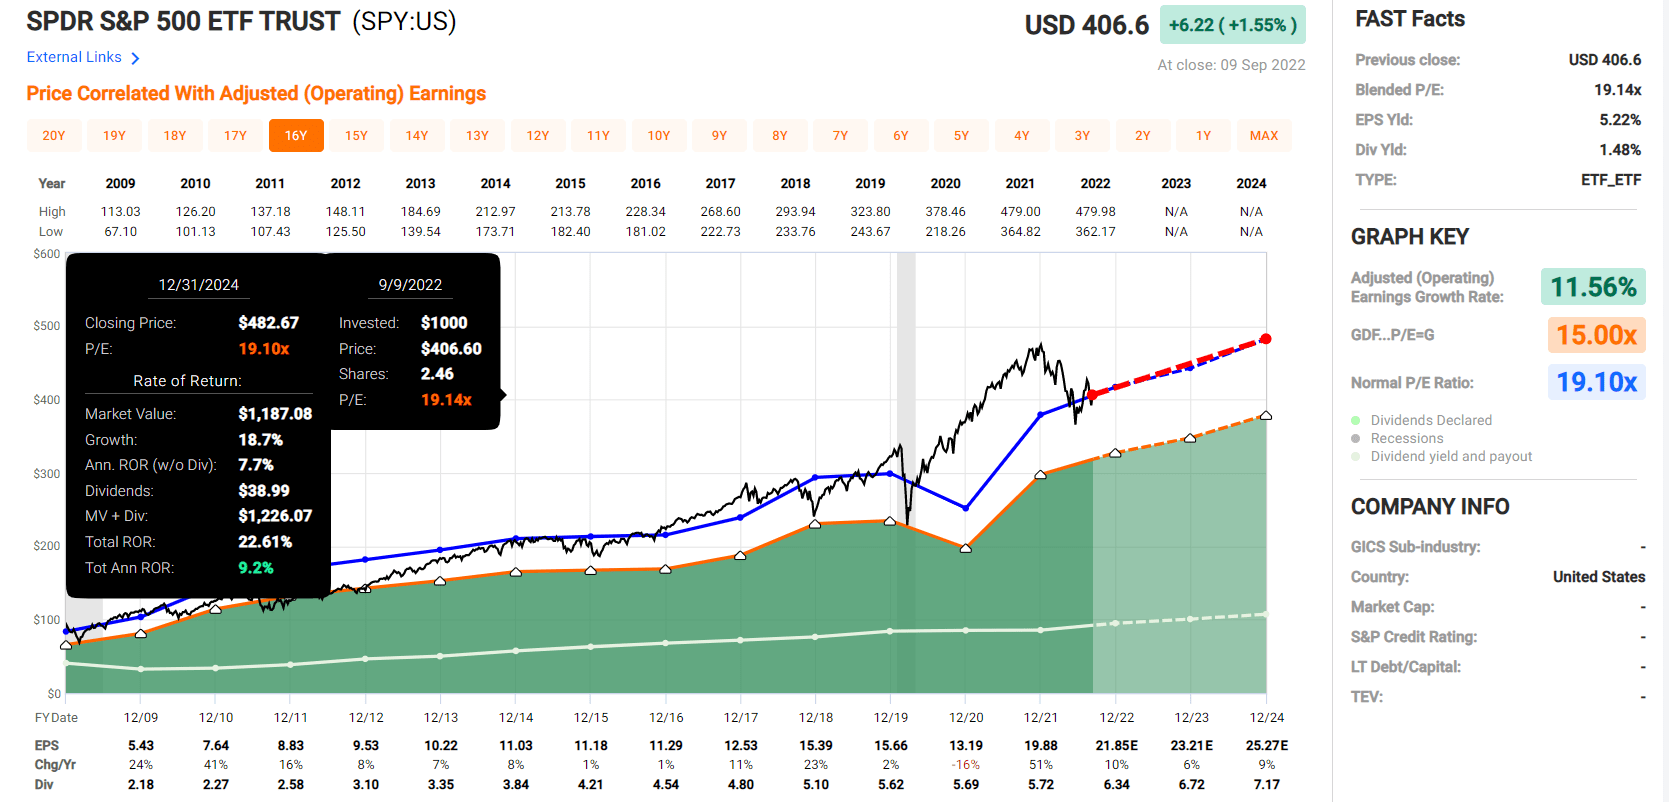
Analysts expect a modest 9.2% annual return from the 2% overvalued S&P 500 in the coming years.
S&P 500 2027 Consensus Total Return Potential
| Year | Upside Potential By End of That Year | Consensus CAGR Return Potential By End of That Year | Probability-Weighted Return (Annualized) |
Inflation And Risk-Adjusted Expected Returns |
| 2027 | 48.66% | 8.25% | 6.19% | 3.79% |
(Source: DK S&P 500 Valuation & Total Return Tool)
Over the next five years, analysts expect 9% annual returns from the S&P 500.
PM Investment Decision Score
DK (Source: Dividend Kings Automated Investment Decision Tool)
PM is a reasonable high-yield dividend king choice for anyone comfortable with its risk profile.
- 6% discount vs. 2% market premium = 8% better valuation
- 5.2% yield vs. 1.6% yield (3.3X the yield and a much safer yield at that)
- market-matching consensus long-term return potential
- 10% better risk-adjusted expected return over the next five years
- 3X more income over the next five years
| Investment Strategy | Yield | LT Consensus Growth | LT Consensus Total Return Potential | Long-Term Risk-Adjusted Expected Return | Long-Term Inflation And Risk-Adjusted Expected Returns | Years To Double Your Inflation & Risk-Adjusted Wealth |
10-Year Inflation And Risk-Adjusted Expected Return |
| Philip Morris | 5.2% | 5.1% | 10.3% | 7.2% | 4.9% | 14.6 | 1.62 |
| Dividend Aristocrats | 2.4% | 8.6% | 11.0% | 7.7% | 5.4% | 13.4 | 1.69 |
| S&P 500 | 1.6% | 8.5% | 10.1% | 7.1% | 4.9% | 14.8 | 1.61 |
(Source: DK Research Terminal, FactSet, Morningstar, Ycharts)
According to analysts, PM should match the market over time while delivering more than 3X the much safer yield on day one.
Inflation-Adjusted Consensus Total Return Forecast: $1,000 Initial Investment
| Time Frame (Years) | 7.9% CAGR Inflation-Adjusted S&P 500 Consensus | 8.7% Inflation-Adjusted Dividend Aristocrats Consensus | 8.0% CAGR Inflation-Adjusted PM Consensus | Difference Between Inflation-Adjusted PM Vs. S&P Consensus |
| 5 | $1,461.18 | $1,516.17 | $1,470.01 | $8.83 |
| 10 | $2,135.06 | $2,298.77 | $2,160.92 | $25.87 |
| 15 | $3,119.71 | $3,485.33 | $3,176.58 | $56.87 |
| 20 | $4,558.47 | $5,284.36 | $4,669.60 | $111.13 |
| 25 | $6,660.75 | $8,012.00 | $6,864.35 | $203.59 |
| 30 (retirement time frame) | $9,732.58 | $12,147.56 | $10,090.65 | $358.06 |
| 35 | $14,221.09 | $18,417.77 | $14,833.34 | $612.25 |
| 40 | $20,779.62 | $27,924.49 | $21,805.13 | $1,025.51 |
| 45 | $30,362.83 | $42,338.29 | $32,053.72 | $1,690.90 |
| 50 | $44,365.65 | $64,192.09 | $47,119.24 | $2,753.59 |
| 55 | $64,826.35 | $97,326.17 | $69,265.69 | $4,439.33 |
| 60 (investing lifetime) | $94,723.18 | $147,563.10 | $101,821.14 | $7,097.96 |
| 100 (institutional time frame) | $1,968,311.27 | $4,120,623.88 | $2,220,223.05 | $251,911.79 |
(Source: DK Research Terminal, FactSet)
Analysts expect about 10X real returns from PM over the coming 30 years, and it could deliver life-changing wealth over an investing lifetime.
And if you pass on your shares to your grandkids? Then potentially, in 100 years, PM can deliver 2,220X real returns.
- you don’t need crypto to achieve mind-boggling returns just the world’s best blue-chips and enough time
Steady Growth Prospects For Decades To Come
PM’s growth prospects have recovered significantly after a big decline after Russia’s invasion.
Medium-Term Growth Consensus Forecast
| Metric | 2021 Growth | 2022 Growth Consensus | 2023 Growth Consensus | 2024 Growth Consensus |
2025 Growth Consensus |
| Sales | 9% | -5% (Ukraine War and Strong Dollar) | 4% | 8% | 5% |
| Dividend | 3% | 4% (Official) | 3% | 3% (55-year dividend growth streak) | NA |
| EPS | 18% | -9% | 9% | 8% | 3% |
| Operating Cash Flow | 22% | -12% | 3% | 3% | NA |
| Free Cash Flow | 27% | -15% | 3% | 6% | NA |
| EBITDA | 7% | -3% | 2% | 12% | NA |
| EBIT (operating income) | 7% | -4% | 6% | 8% | NA |
(Source: FAST Graphs, FactSet)
20% of RRP sales are from Russia and Ukraine, and PM is leaving Russia entirely.
- growth outlook fell from 11% to 2% right after the War
- growth prospects now 5.1%
Management is working on restoring its pre-war 9+% EPS growth guidance, and Swedish Match is one way it plans to do that.
Medium-Term Growth Consensus Forecast
| Year | Sales | Free Cash Flow | EBITDA | EBIT (Operating Income) | Net Income |
| 2021 | $31,405 | $11,219 | $14,486 | $13,488 | $9,292 |
| 2022 | $29,858 | $9,179 | $13,375 | $12,430 | $8,688 |
| 2023 | $30,666 | $9,849 | $13,992 | $13,012 | $9,167 |
| 2024 | $33,008 | $10,239 | $15,253 | $14,229 | $10,048 |
| 2025 | $34,672 | NA | NA | $16,231 | $11,136 |
| Annualized Growth 2022-2027 | 2.50% | -3.00% | 1.73% | 4.74% | 4.63% |
| Cumulative 2022-2024 | $93,532 | $29,267 | $42,620 | $39,671 | $27,903 |
(Source: FactSet Research Terminal)
The Russian invasion really hurt short-term growth, but PM is still expected to deliver modest top and bottom line growth.
Profit Margin Consensus Forecast
| Year | FCF Margin | EBITDA Margin | EBIT (Operating) Margin | Net Margin | Return On Capital Expansion |
Return On Capital Forecast |
| 2021 | 35.7% | 46.1% | 42.9% | 29.6% | 1.12 | |
| 2022 | 30.7% | 44.8% | 41.6% | 29.1% | TTM ROC | 212.04% |
| 2023 | 32.1% | 45.6% | 42.4% | 29.9% | Latest ROC | 203.93% |
| 2024 | 31.0% | 46.2% | 43.1% | 30.4% | 2025 ROC | 238.44% |
| 2025 | NA | NA | 46.8% | 32.1% | 2025 ROC | 229.32% |
| 2026 | NA | NA | NA | NA | Average | 233.88% |
| 2027 | NA | NA | NA | NA | Industry Median | 60.09% |
| 2028 | NA | NA | NA | NA | PM/Industry Median | 3.89 |
| Annualized Growth 2022-2024 | -4.60% | 0.06% | 2.18% | 2.07% | Vs. S&P | 16.02 |
(Source: FactSet Research Terminal)
PM’s industry-leading margins (80th percentile historically) are expected to remain stable over the coming years.
Return on capital, Joel Greenblatt’s gold standard proxy for quality and moatiness, is expected to increase modestly to 234%, 4X the industry norm, and 16X more than the S&P 500.
- return on capital = annual pre-tax profit/the cost of running the business
According to one of the greatest investors in history, PM is about 4X higher quality than its peers and 16X higher quality than the average S&P 500 company.
Dividend Growth Consensus Forecast
| Year | Dividend Consensus | EPS/Share Consensus | EPS Payout Ratio | Retained (Post-Dividend) Earnings | Buyback Potential | Debt Repayment Potential |
| 2022 | $5.08 | $5.61 | 90.6% | $822 | 0.55% | 2.5% |
| 2023 | $5.23 | $5.93 | 88.2% | $1,085 | 0.72% | 3.9% |
| 2024 | $5.37 | $6.49 | 82.7% | $1,736 | 1.15% | 6.2% |
| Total 2022 Through 2024 | $15.68 | $18.03 | 87.0% | $3,642.50 | 2.42% | 12.96% |
| Annualized Rate | 2.8% | 7.6% | -4.4% | 45.4% | 45.4% | 57.8% |
(Source: FactSet Research Terminal)
Rating agencies consider 85% a safe payout ratio, and due to the war, it will take until 2024 for PM to return to safe payout ratios.
- 75% is management’s policy payout ratio (2025 or 2026)
- MO’s policy is 80%
- BTI’s 65%
After paying out dividends (growing at just under 3%), analysts expect PM to retain $3.6 billion in earnings, enough to pay back up to 13% of the current debt (8% after buying Swedish Match) or buyback a modest 2.4% of shares at current valuations.
- PM has suspended its buyback to focus on deleveraging post-acquisition
PM Long-Term Growth Outlook
(Source: FactSet Research)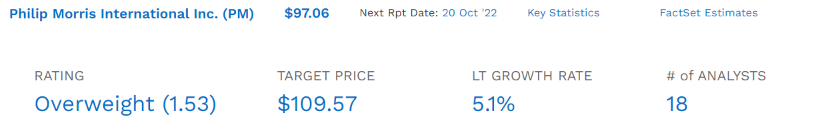
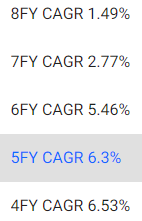
- 2.3% to 7.1% is the actual growth consensus range (five sources)
- 5.1% median consensus from all 18 analysts
How accurate are analysts at forecasting PM’s growth in the short-term?
(Source: FAST Graphs, FactSet Research)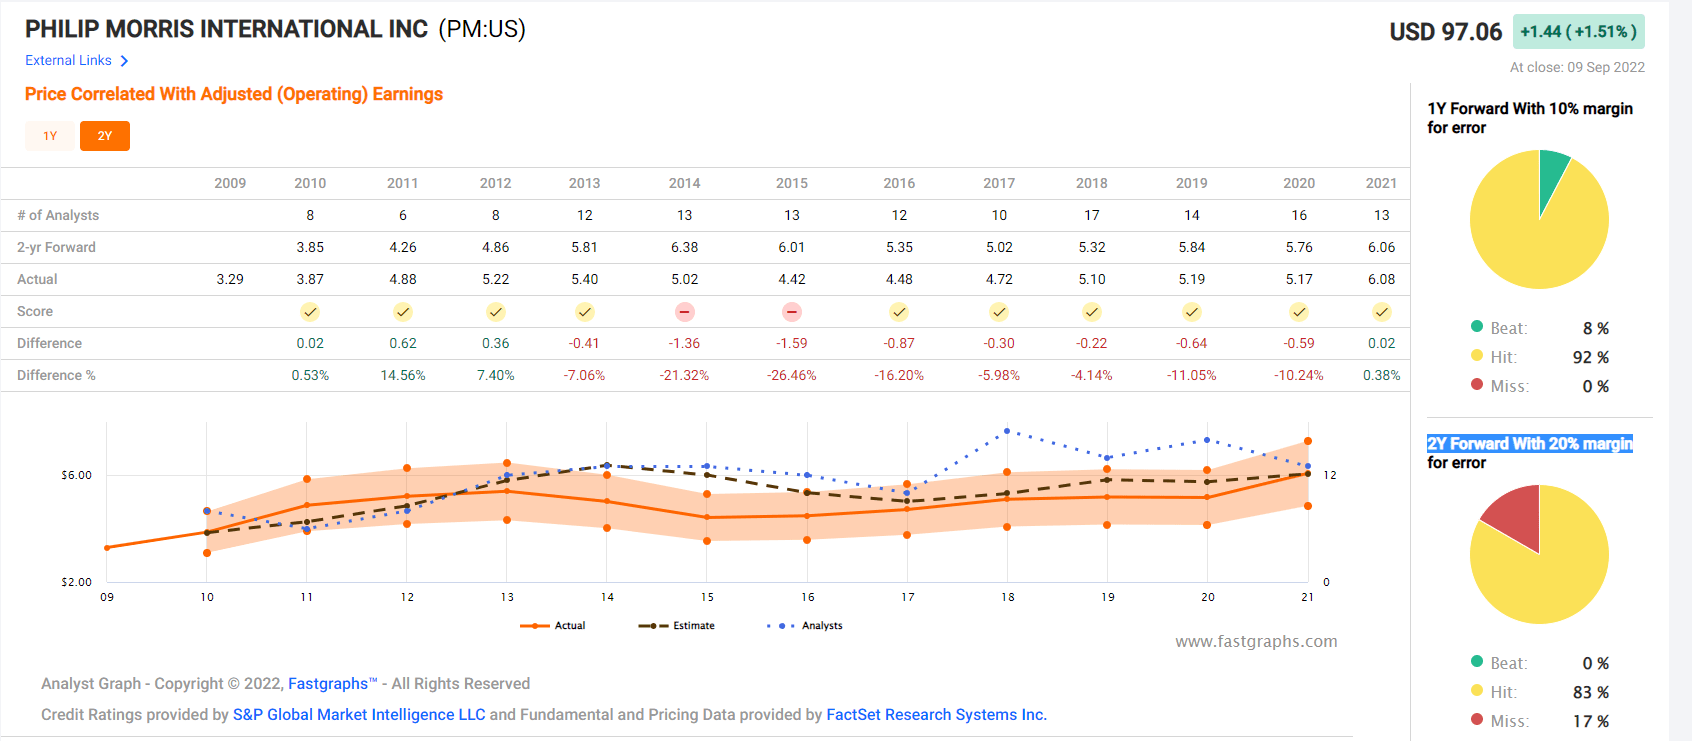
Smoothing for outliers, analyst margins of error on PM are 20% to the downside and 5% to the upside.
- 1% to 7% CAGR margin-of-error adjusted growth consensus range
(Source: FAST Graphs, FactSet Research) (Source: FAST Graphs, FactSet Research) (Source: FAST Graphs, FactSet Research)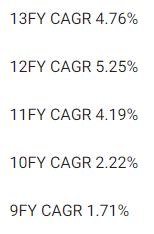
Analysts expect growth similar to the last 12 and six years.
A Wonderful Company At A Reasonable Price
(Source: FAST Graphs, FactSet) (Source: FAST Graphs, FactSet)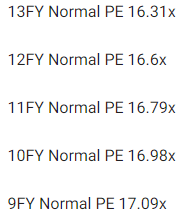
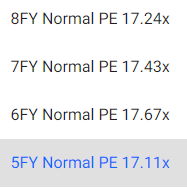
For 13 years, outside of bear markets and bubbles, millions of income investors have consistently paid between 16.5X and 17.5X for PM
- 90% statistical probability that this approximates intrinsic value
| Metric | Historical Fair Value Multiples (13-Years) | 2021 | 2022 | 2023 | 2024 | 2025 |
12-Month Forward Fair Value |
| 14-year average yield | 4.69% | $104.48 | $106.61 | $106.61 | $114.50 | NA | |
| Earnings | 16.98 | $103.24 | $95.26 | $100.69 | $110.20 | $113.26 | |
| Average | $103.85 | $100.61 | $103.57 | $112.31 | $113.26 | $102.77 | |
| Current Price | $97.06 | ||||||
|
Discount To Fair Value |
6.54% | 3.53% | 6.28% | 13.58% | 14.30% | 5.56% | |
|
Upside To Fair Value (NOT Including Dividends) |
7.00% | 3.66% | 6.70% | 15.71% | 16.69% | 5.88% (11% including dividend) | |
| 2022 EPS | 2023 EPS | 2021 Weighted EPS | 2022 Weighted EPS | 12-Month Forward EPS | 12-Month Average Fair Value Forward PE |
Current Forward PE |
|
| $5.61 | $5.93 | $1.51 | $4.33 | $5.84 | 17.6 | 16.6 |
- historical fair value: 17.6X earnings
- currently 16.6X
- 12.7X cash-adjusted PE
| Rating | Margin Of Safety For Low-Risk 12/13 Quality Super SWANs | 2022 Fair Value Price | 2023 Fair Value Price |
12-Month Forward Fair Value |
| Potentially Reasonable Buy | 0% | $100.61 | $103.57 | $102.77 |
| Potentially Good Buy | 10% | $90.55 | $93.21 | $92.49 |
| Potentially Strong Buy | 20% | $80.49 | $82.85 | $82.22 |
| Potentially Very Strong Buy | 30% | $63.39 | $72.50 | $71.94 |
| Potentially Ultra-Value Buy | 40% | $60.37 | $62.14 | $61.66 |
| Currently | $97.06 | 3.53% | 6.28% | 5.56% |
| Upside To Fair Value (Not Including Dividends) | 3.66% | 6.70% | 5.88% |
PM is a potentially reasonable buy for anyone comfortable with its risk profile.
Risk Profile: Why Philip Morris Isn’t Right For Everyone
There are no risk-free companies, and no company is right for everyone. You have to be comfortable with the fundamental risk profile.
Risk Profile Summary
- regulatory risk (globally, including menthol bans, nicotine regulations, RRP tax rates, and plain packaging laws)
- smoke-free transition risk (PM is the industry leader)
- litigation risk (lower than in the US due to lack of class action laws)
- M&A execution risk (Swedish Match is the largest deal PM has ever done)
- supply chain disruption risk
- black swan geopolitical risks (like the Russian invasion)
- labor market risk (tightest job market in 50 years globally)
- currency risk (Swedish match reduces this).
How do we quantify, monitor, and track such a complex risk profile? By doing what big institutions do.
Long-Term Risk Analysis: How Large Institutions Measure Total Risk
- see the risk section of this video to get an in-depth view (and link to two reports) of how DK and big institutions measure long-term risk management by companies
PM Long-Term Risk-Management Consensus
| Rating Agency | Industry Percentile |
Rating Agency Classification |
| MSCI 37 Metric Model | 58.0% |
BBB, Average, Positive Trend |
| Morningstar/Sustainalytics 20 Metric Model | 90.8% |
23.9/100 Medium-Risk |
| Reuters’/Refinitiv 500+ Metric Model | 98.1% | Excellent |
| S&P 1,000+ Metric Model | 60.0% |
Above-Average, Positive Trend |
| FactSet | 50.0% |
Average, Stable Trend |
| Morningstar Global Percentile (All 15,000 Rated Companies) | 61.0% | Good |
| Consensus | 70% |
Low Risk, Good Risk-Management, Stable Trend |
(Sources: Morningstar, MSCI, FactSet, Reuters, S&P)
PM’s Long-Term Risk Management Is The 165th Best In The Master List (67th Percentile)
| Classification | Average Consensus LT Risk-Management Industry Percentile |
Risk-Management Rating |
| S&P Global (SPGI) #1 Risk Management In The Master List | 94 | Exceptional |
| Strong ESG Stocks | 78 |
Good – Bordering On Very Good |
| Foreign Dividend Stocks | 75 | Good |
| Ultra SWANs | 71 | Good |
| Philip Morris International | 70 | Good |
| Low Volatility Stocks | 68 | Above-Average |
| Dividend Aristocrats | 67 | Above-Average |
| Dividend Kings | 63 | Above-Average |
| Master List average | 62 | Above-Average |
| Hyper-Growth stocks | 61 | Above-Average |
| Monthly Dividend Stocks | 60 | Above-Average |
| Dividend Champions | 57 | Average bordering on above-average |
(Source: DK Research Terminal)
PM’s risk-management consensus is in the top 33% of the world’s highest quality companies and similar to that of such other blue-chips as
- Kimberly-Clark (KMB): Ultra SWAN dividend aristocrat
- 3M (MMM): Ultra SWAN dividend king
- Stanley Black & Decker (SWK): Super SWAN dividend king
- British American Tobacco (BTI): Ultra SWAN global aristocrat
- Clorox (CLX): Super SWAN dividend aristocrat
The bottom line is that all companies have risks, and PM is good, at managing theirs.
How We Monitor PM’s Risk Profile
- 18 analysts
- 3 credit rating agencies
- 7 total risk rating agencies
- 25 experts who collectively know this business better than anyone other than management
- and the bond market for real-time fundamental risk updates
When the facts change, I change my mind. What do you do, sir?” – John Maynard Keynes
There are no sacred cows at iREIT or Dividend Kings. Wherever the fundamentals lead, we always follow. That’s the essence of disciplined financial science, the math behind retiring rich and staying rich in retirement.
Bottom Line: Philip Morris Can Help You Retire In Safety And Splendor, But It Might Take A Bit Longer Than We Expected
The Russian invasion of Ukraine permanently knocked out one of PM’s biggest RRP markets and appears to have slowed PM’s growth outlook significantly.
That growth outlook is starting to recover as I expected it would.
- the world is a lot bigger than Russia and Ukraine
The Swedish Match acquisition is logical, attractively valued, and could help PM accelerate its smoke-free future plans by a few years.
However, the extra debt and elevated payout ratios do mean a slightly higher risk dividend, which remains safe but is likely to grow slower in the coming years as management de-leverages.
While I can’t predict the market in the short term, here’s what I can tell you about PM.
- one of the highest quality high-yield blue-chips on earth
- the best management team in the industry
- 5.2% very safe yield with 5.1% long-term growth potential
- 10.3% CAGR long-term total return potential, matching the market but with 3.3X higher and safer yield
- 6% historically undervalued, a potentially reasonable buy
- 12.7X cash-adjusted P/E
- 60% consensus return potential over the next five years, 9% CAGR, 10% more than the market
- 10% better risk-adjusted expected returns of the S&P 500 over the next five years.
- 3X more income potential over the next five years
It might take PM longer than expected to deliver the kinds of life-changing income and wealth that analysts and I expected pre-invasion.
- given enough time, PM could deliver 2,200X inflation-adjusted returns
But the good news is that as long as PM keeps executing so well on its smoke-free future transition plans, incredible income and rich-retirement wealth growth likely aren’t a question of “if,” only “when.”
Be the first to comment