

DNY59/E+ via Getty Images
It seems that every decade or so the issue of debt and deficits enters the public discourse. Public sector spending exploded during and after the 2007-09 financial crisis, giving rise to the so called tea party and government shutdowns over spending with little if any result. Public spending has exploded again in response to the global pandemic and the rise of modern monetary theory. Modern monetary theory has had a brief shelf life fortunately as monetary policies have tightened, but the spending is rolling on.
The financial consequences of these episodes were masked by what seemed like a secular decline in inflation. This allowed global central banks to facilitate the expansion of public sector largess by holding interest rates at the zero bound while simultaneously removing bonds from the private market through quantitative easing. But now in the face of a global surge of inflation, central banks are reversing course by raising benchmark interest rates and shifting from buying government bonds to retiring them and in some cases outright selling. No one yet knows the consequence of these actions as history offers no guide. With global debt levels having increased exponentially there is a question of whether markets have reached a tipping point such that further public sector debt expansion may not be calmly absorbed.
The U.S. may not be the poster child for public sector debt expansion, but its history of addressing its condition is replete with negligence. In 1985 Senators Phil Gramm of Texas, Warren Rudman of New Hampshire, and Fritz Hollings of South Carolina sponsored deficit reduction legislation with the support of the Reagan White House. The formal name was the Balanced Budget and Emergency Deficit Control Act but commonly termed Gramm-Rudman-Hollings. The law was designed to keep federal deficits below a maximum debt limit. Allowable deficit levels were calculated in consideration of the eventual elimination of the federal deficit. If the deficit was set to exceed the allowable deficit, across the board spending cuts with equal sized cuts in both defense and nondefense discretionary programs excepting debt service. The term used was sequestration and it would always be in effect except in emergencies such as a war. The process for determining the amount of automatic cuts was struck down by a Supreme Court decision in 1986 as an unconstitutional usurpation of executive power by Congress.
The 1985 law was amended by the Budget Enforcement Act in 1990 and hard caps of sequestration was replaced with a PAYGO system. Under the pay as you go rule an increase in spending in one area was to be offset by a reduction in another or an increase in taxes. This PAYGO rule was in effect until 2002, and then the enforcement mechanism was completely suspended during the 2007-09 financial crisis. Spending ballooned during this emergency and in the aftermath both democrats and republicans searched for ways to regain control over the budget without taking any responsibility for the hard decisions that spending discipline would require. In 2011 the ratio of publicly held federal debt to GDP was 67.7%.
In 2011 the Budget Control Act (BCA) was passed into law. It established a Congressional debt reduction committee, and it included sequestration of both defense and nondefense programs if Congress did not pass deficit reduction legislation. Sequestration was deployed during 2013. The original Budget Control Act mainly specified dollar limits on discretionary spending, with separate pools for defense and nondefense spending. There were also minor adjustments to mandatory spending. The Congressional Budget Office (CBO) translated the dollar amounts in the BCA and estimated that in September 2011 that the sequester would have the following effects between 2013 and 2021:
Reductions ranging from 10% in 2013 to 8.5% in 2021 in the caps on new discretionary appropriations for defense programs, yielding total outlay savings of $454 billion.
Reductions ranging from 7.8% in 2013 to 5.5% in 2021 in the caps on new discretionary appropriations for nondefense programs, resulting in outlay savings of $294 billion.
Reductions ranging from 10% in 2013 to 8.5% in 2021 in mandatory budgetary resources for nonexempt defense programs, generating savings of about $100 million.
Reductions of 2% each year in most Medicare spending because of the application of a special rule that applies to that program, producing savings of $123 billion, and reductions ranging from 7.8% in 2013 to 5.5% in 2021 in mandatory budgetary resources for other nonexempt nondefense programs and activities, yielding savings of $47 billion. Thus, savings in nondefense mandatory spending would total $170 billion.
About $31 billion in outlays stemming from reductions in premiums for Part B Medicare and other changes in spending that would result from the sequestration actions.
An estimated reduction of $169 billion in debt service costs.
In 2013 and subsequent years Congress enacted various adjustments, waivers, suspensions, and exemptions to the sequestration requirements of the BCA. These had the effect of increasing the spending caps which caused actual discretionary spending to far exceed the caps envisioned in 2011. As the accompanying Table I shows, if legislators had adhered to the spending caps prescribed by the BCA, discretionary spending would have been a cumulative $2.54 trillion less than was actually spent. COVID related spending was a valid emergency for excess spending in 2020, but that was the only exception and when authorized it was meant to be temporary.
If the BCA was fully effective over the 2012-2021 period, the cumulative federal deficit would have been $3.8 trillion according to CBO estimates. But the actual cumulative deficit was $11.6 trillion as shown on the table. Excluding $1.6 trillion for 2020 and the difference actual and presumed spending under BCA was still $5 trillion.
Republicans and Democrats are both to blame for this profligacy. For example, there were no emergencies in 2018-2019 but Republicans led by House Speaker Paul Ryan agreed to suspend the BCA caps because…well just because. This was at a time when the economy was humming along with full employment and noninflationary growth and a budget deficit that was an acceptable 5% of GDP. The suspension was endorsed by the Trump White House, led by National Economic Council Director Larry Kudlow. This suspension occurred one year after the Trump tax reductions and would have codified the original Reagan policy of offsetting tax reduction with spending restraint in order to shrink the size of government. Instead, both of these deficit “hawks” punted.
In 2021 democrats insisted on maintaining the COVID emergency and spent like drunken sailors – not to denigrate drunken sailors – to stimulate the economy. In early 2021 under the Biden administration and a democratic Congress, a $1.9 trillion emergency spending package was passed into law. Treasury Secretary Janet Yellen at the time warned that spending too little was a bigger risk than spending too much to stimulate the economy. In doing so, the stipulations of the Budget Control Law were not even so much as mentioned.
Needless to say, the federal debt exploded over the 2012-2021 period. According to CBO the accompanying table shows that strict compliance with the BCA budget Caps would have resulted in a 32% increase in the publicly held federal debt to $14 trillion or 63% of GDP. But the reality is that the debt practically doubled from $11.3 trillion in 2012 to $22.3 trillion in 2021 or 99.6% of GDP. In 2022 the CBO estimated that the actual deficit was $1.04 trillion with the publicly held debt being $24.2 trillion or 97.9% of GDP. Congress just passed and the president gleefully signed an open ended debt extension through 2024.
The question now arising is whether this can go on indefinitely or whether it is finally time to pay the piper, as they say. Beginning in mid-2021 the extended period of price stability began to give way to an eruption of inflation. There are many reasons which are now well documented and debated and need not be regurgitated here. As inflation took hold global Central Banks began reeling in excess money creation by first raising benchmark interest rates and more recently beginning the process of shrinking rather than expanding balance sheets through quantitative tightening. Without any precedent Central Banks are in a sense flying blind. But one thing is for sure and that is that government bond markets are losing what had been a dependable buyer of public debt, namely the central banks.
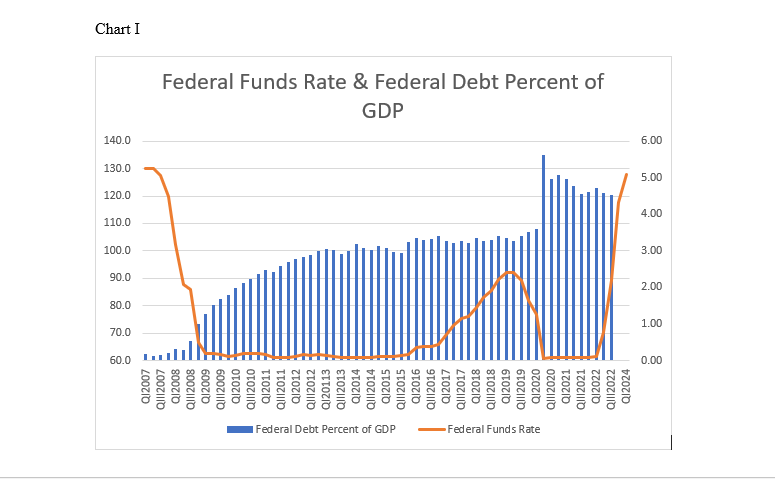
Focusing on the U.S. Federal Reserve, current policy is projecting a peak cyclical federal funds target of roughly 5% accompanied by about $1 trillion of balance sheet reduction by early 2024. Chart I accompanying this report sketches out the actual federal funds rate from 2007 through the present versus the ratio of federal debt to GDP. Coincidentally or not the federal funds target peaked in 2007 at 5.1% just prior to the beginning of the financial crisis. At that time, the debt to GDP ratio was 36.9%. Currently the 5.1% presumed terminal federal funds target would coincide with a debt to GDP ratio well north of 100%. Can the economy smoothly absorb this high an interest rate given this amount of debt or are we about to encounter a debt revulsion?
Table I Comparison of Discretionary Spending Caps in Budget Control Act of 2011 with actual discretionary spending, Actual Debt Held by Public, Actual Deficit with CBO projections made in 2012 assuming spending caps pursuant to Budget Control Act of 2011
|
Discretionary Spending |
CBO Estimates 2012 |
||||||
|
Budget Control Act |
Actual |
Difference Actual Debt Held |
Actual |
based on BCA of 2011 |
|||
|
Act of 2011 |
$millions |
by Public |
Deficit |
Deficit |
Debt Held by Public |
||
|
2012 |
1,043 |
1,275.7 |
$232.7 |
11,281.1 |
-1,076.6 |
-1,079 |
11,242 |
|
2013 |
1,047 |
1,202.4 |
$155.4 |
11,982.7 |
-679.8 |
-585 |
11,945 |
|
2014 |
973 |
1,178.9 |
$205.9 |
12,779.9 |
-484.8 |
-345 |
12,401 |
|
2015 |
994 |
1,172.1 |
$178.1 |
13,116.7 |
-442.0 |
-269 |
12,783 |
|
2016 |
1,016 |
1,185.3 |
$169.3 |
14,167.6 |
-584.7 |
-302 |
13,188 |
|
2017 |
1,040 |
1,200.3 |
$160.3 |
14,665.4 |
-665.4 |
-220 |
13,509 |
|
2018 |
1,066 |
1,261.6 |
$195.6 |
15,749.6 |
-779.1 |
-196 |
13,801 |
|
2019 |
1,093 |
1,337.7 |
$244.7 |
16,800.7 |
-983.6 |
-258 |
14,148 |
|
2020 |
1,120 |
1,627.8 |
$507.8 |
21,016.7 |
-3,132.4 |
-280 |
14,512 |
|
2021 |
1,146 |
1,636.4 |
$490.4 |
22,284.0 |
-2,775.3 |
-279 |
14,872 |
|
Totals |
$2,540.2 |
-11,603.7 |
|||||
Table created by author with data from CBO
Fed Funds and Debt% (CBO and FRED)
Editor’s Note: This article covers one or more microcap stocks. Please be aware of the risks associated with these stocks.
Be the first to comment