

FreshSplash
Underestimating a company and getting your timing wrong as a result can be a painful experience. A great example of this can be seen by looking at retail chain The Buckle (NYSE:BKE). With over 400 locations in its network, the provider of casual apparel, footwear, and accessories is trading at very cheap levels. However, concerns that I had regarding the company led me to be more cautious than I otherwise should have been. And as a result, upside potential was missed. Based on new data that has made itself available, I do think that the near-term outlook for the company is not quite as positive as it was previously. But because of how cheap shares are and thanks to the stability that we have seen in the enterprise, I do think it’s worth upgrading from a ‘hold’ to a ‘buy’, reflecting my belief that it should generate performance that should exceed what the broader market can for the foreseeable future.
A costly lesson
Back in early May of this year, I wrote an article that discussed the investment worthiness of The Buckle. In that article, I talked about how the company’s bottom line results have been getting better over the prior few years. I also said that shares don’t look pricey and that, in some respects, they actually looked cheap. Ultimately, I concluded that the retail chain made for a decent prospect for long-term investors. But I was turned off by the historical decline in store count that the company had exhibited, a trend that created long-term uncertainty for shareholders. At the end of the day, this all led me to rate the company a ‘hold’, reflecting my belief at the time that it would generate performance that would more or less match what the S&P 500 would achieve for the foreseeable future. Since then, BKE shares have drastically outperformed the market, rising by 10.4% at a time when the S&P 500 has dropped by 9%.
Author – SEC EDGAR Data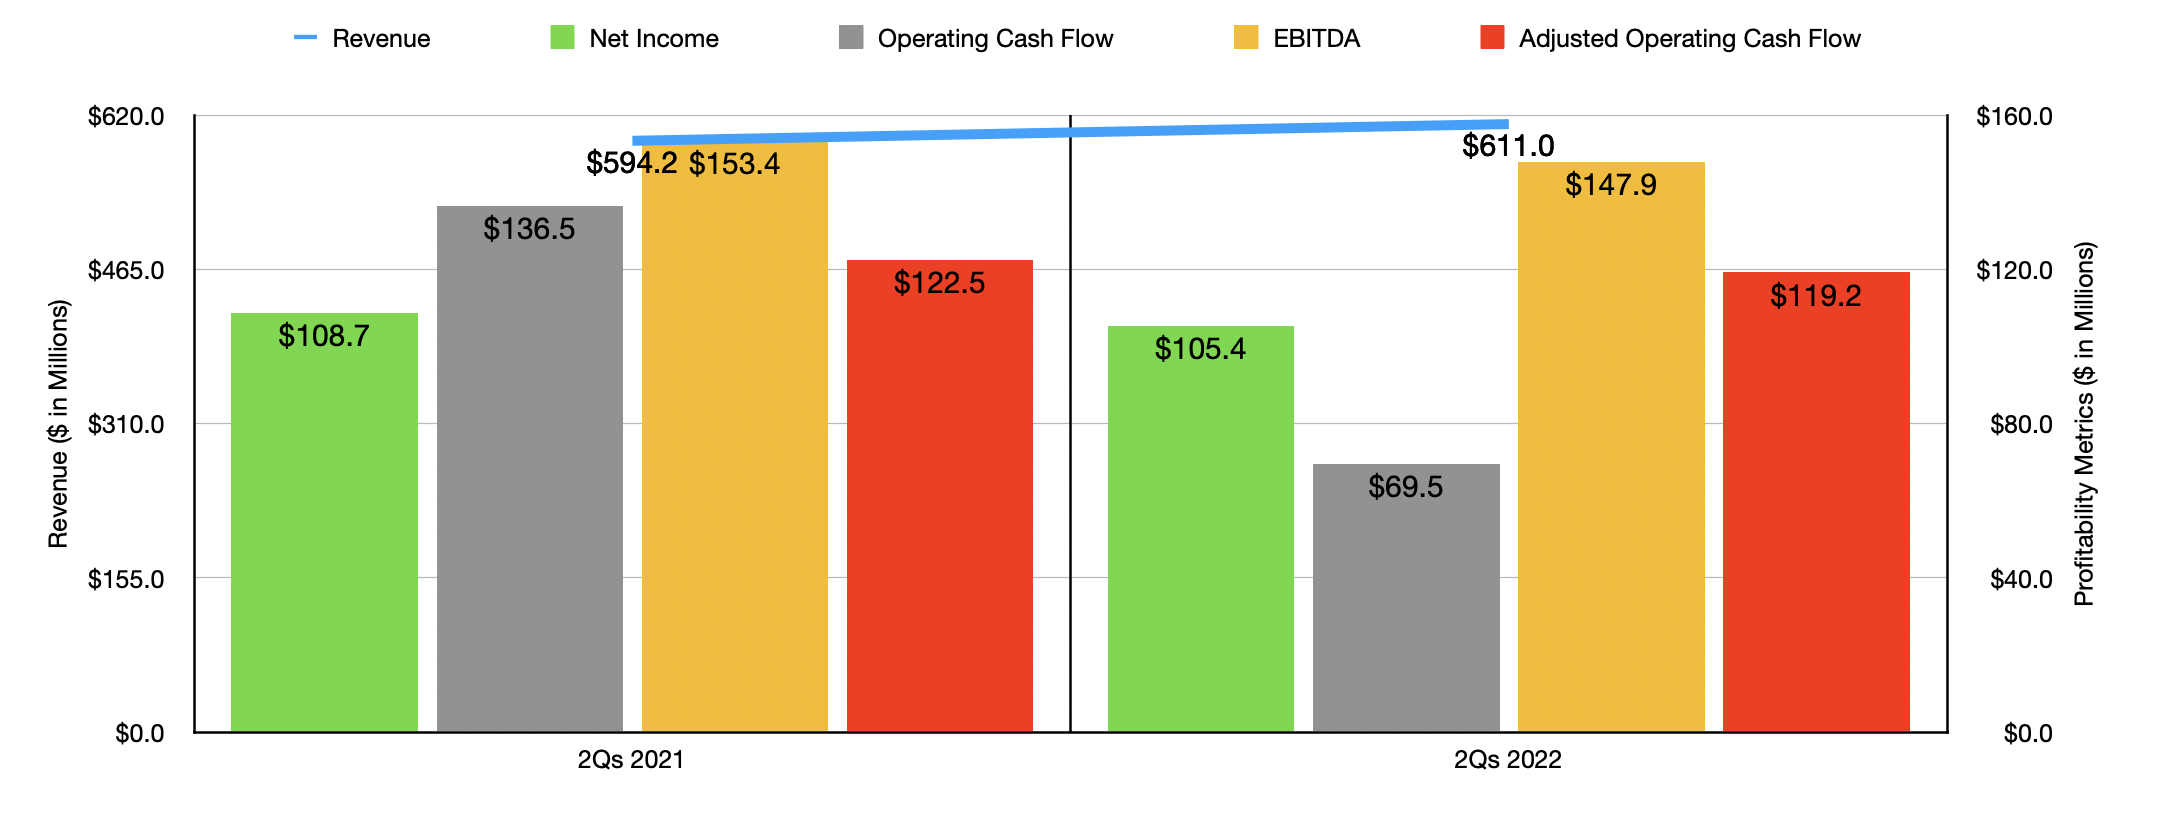
This return disparity has been driven by mixed but largely positive financial results provided by management. For starters, for the first half of the 2022 fiscal year, sales came in at $611 million. That represents an increase of 2.8% over the $594.2 million generated the same time one year earlier. Although the company did see its store count drop by 1 from 442 to 441, it did ultimately increase its store count back up to 442 subsequent to the end of the quarter. The real driver of growth, however, was a 2.6% improvement in comparable store sales. Particularly impressive, in my opinion, was the rise in online sales that management exhibited. In the first half of the 2022 fiscal year, online sales came in at $100.6 million, representing a 3.5% increase over the $97.2 million generated the same time one year earlier. This took the portion of sales generated by the company’s online channels from 16.4% of overall revenue to 16.5%.
On the bottom line, performance was a bit weak though. Net income fell from $108.7 million in the first half of the 2021 fiscal year to $105.4 million the same time this year. According to management, the firm’s gross profit margin actually remained flat even though inflation has been broad-based. Instead, the company was negatively affected by selling, general, and administrative expenses rising from 24.5% of revenue to 26%. Although this may not seem like a significant change, when applied to the revenue the company generated in the first half of this year, it would have impacted pre-tax profits negatively to the tune of $9.17 million. Other profitability metrics followed suit. Operating cash flow went from $136.5 million to $69.5 million. If we adjust for changes in working capital, the picture would have been far better, dropping more modestly from $122.5 million to $119.2 million. We also saw EBITDA drop, declining from $153.4 million to $147.9 million.
Author – SEC EDGAR Data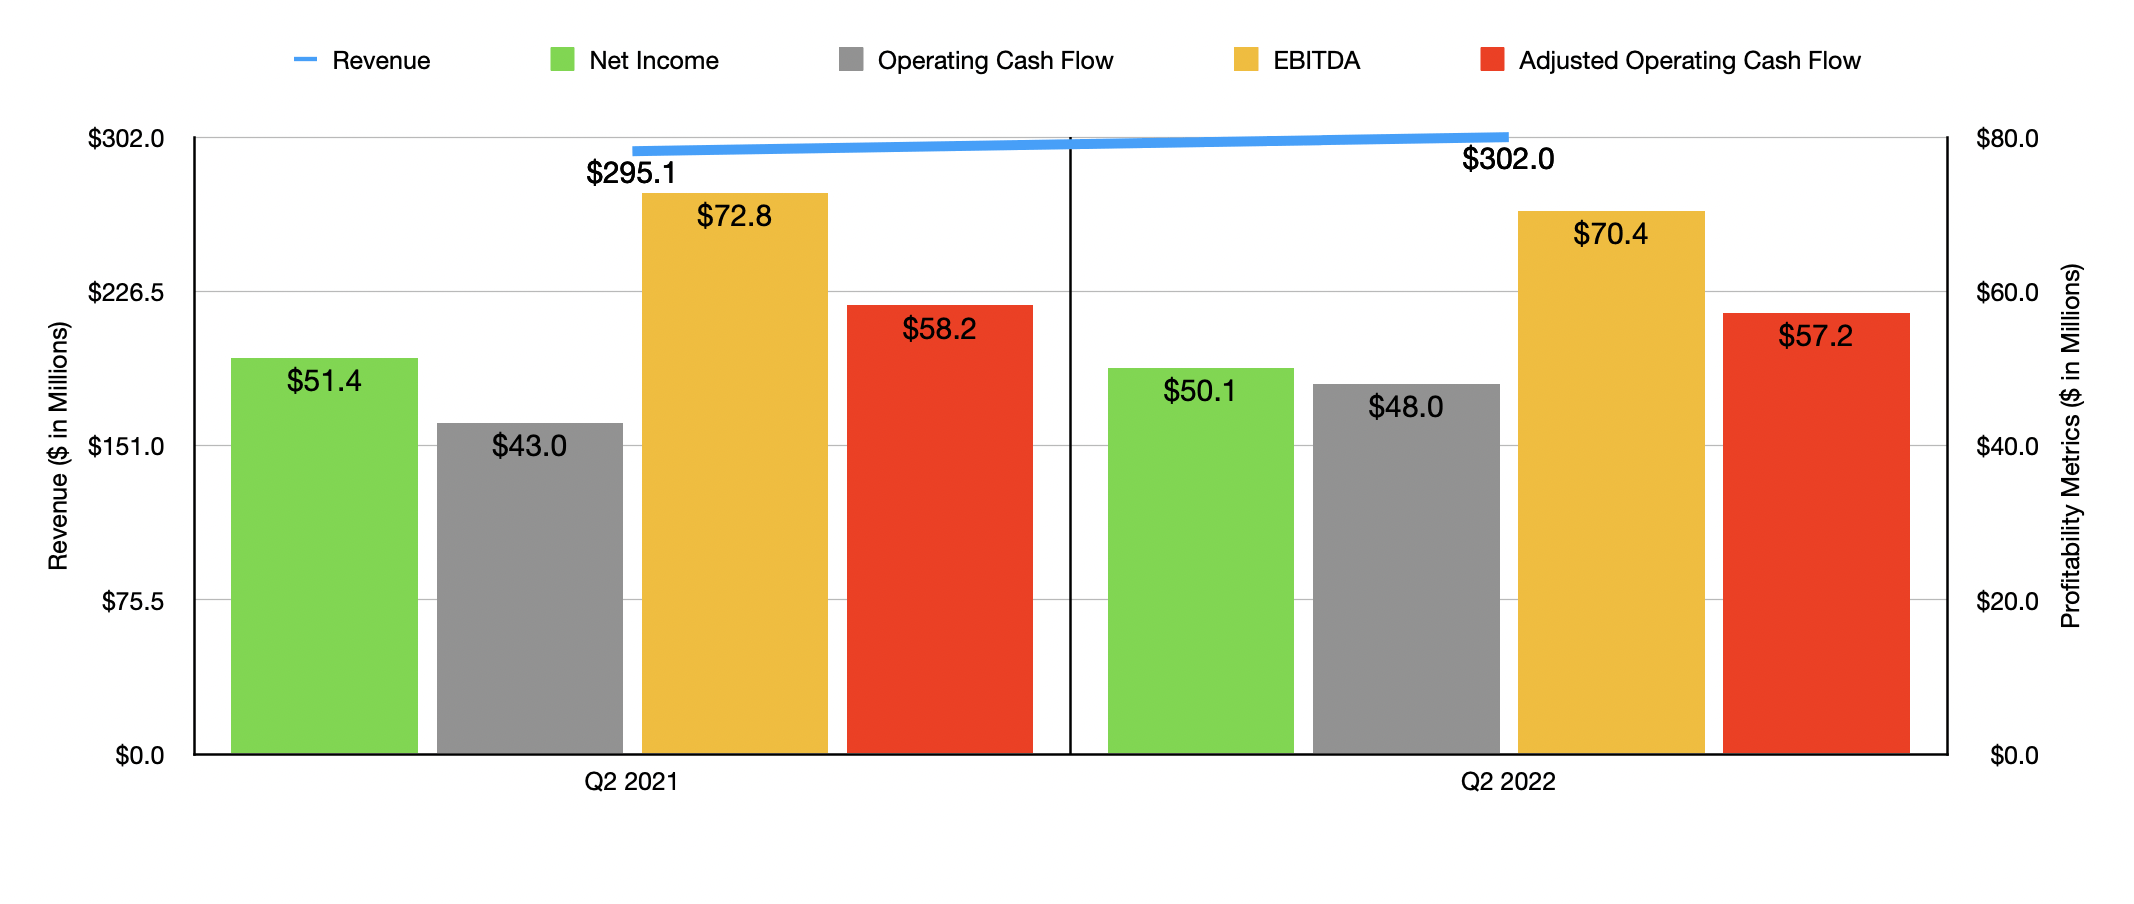
It is also worth noting that the company has not seen significant pain caused by more recent economic concerns. Revenue in the second quarter alone, for instance, came in at $302 million. That’s 2.3% higher than the $295.1 million reported in the second quarter of 2021. This was driven by a 1.6% increase in comparable store sales. Even more recently, management has revealed data covering the month of September. Overall sales for the month were up 3.8% year-over-year, with comparable store sales up 2.7%. Meanwhile, net income during the latest quarter ticked down modestly from $51.4 million to $50.1 million. Operating cash flow actually increased, climbing from $43 million to $48 million. But if we adjust for changes in working capital, it would have decreased modestly from $58.2 million to $57.2 million. Meanwhile, EBITDA also declined, dropping from $72.8 million to $70.4 million.
Author – SEC EDGAR Data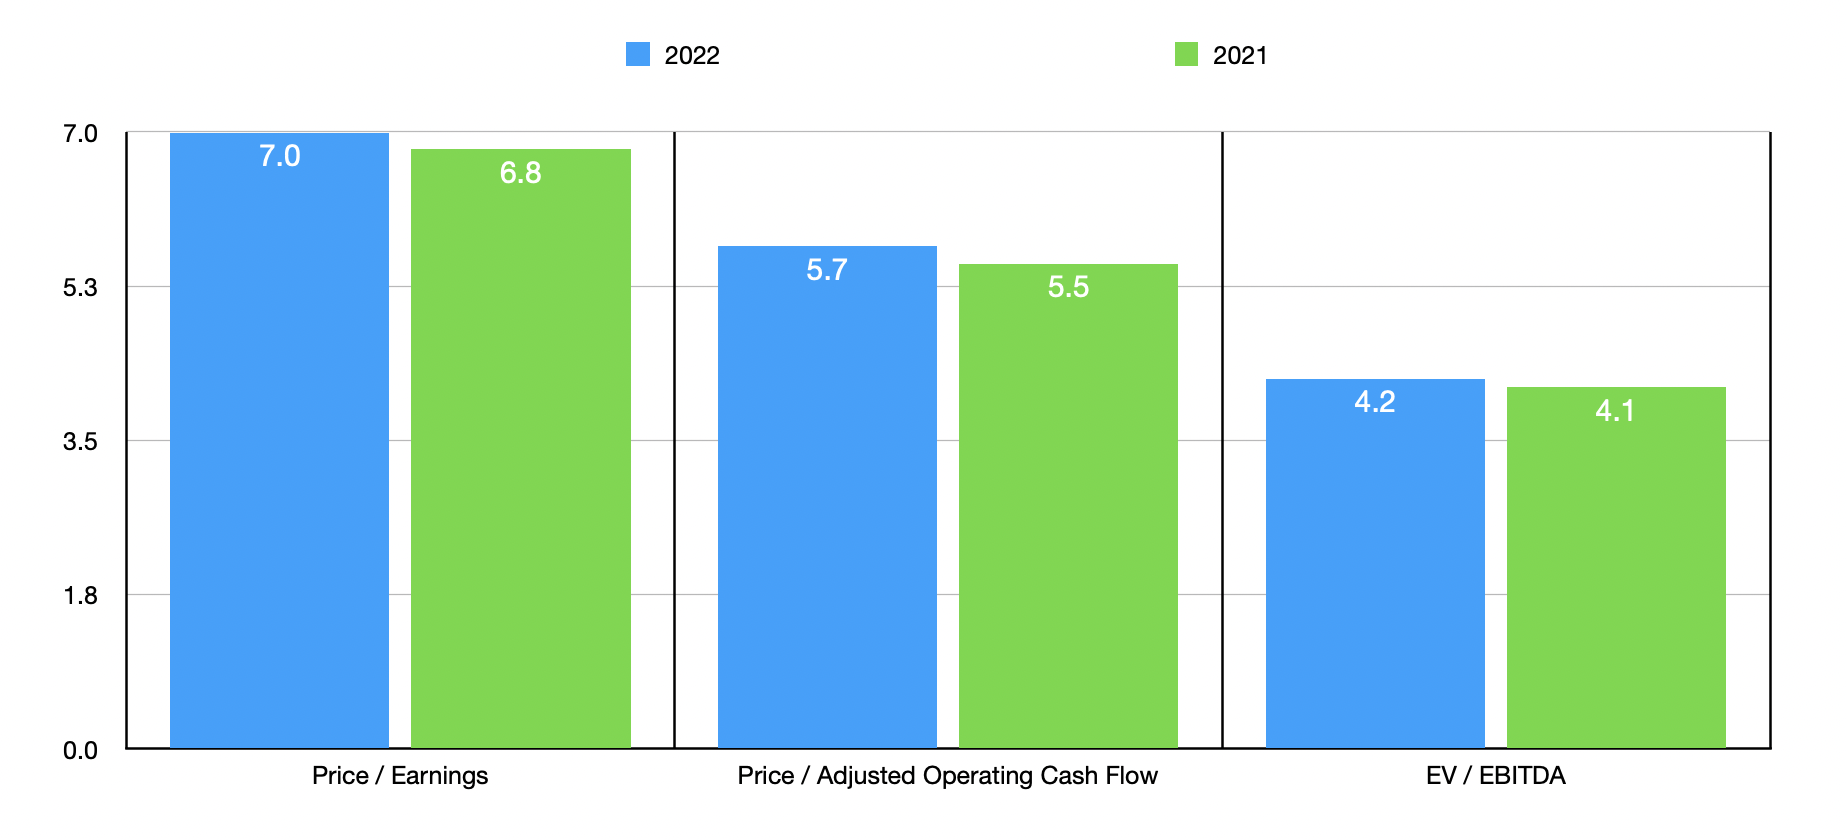
We don’t really know what to expect for the current fiscal year and management has not offered any real guidance. If we simply annualize results experienced during the first half of the year, then we should anticipate net income of $247.1 million, adjusted operating cash flow of $303.4 million, and EBITDA of $341.5 million. These would give us a forward price to earnings multiple of 7, a forward price to adjusted operating cash flow multiple of 5.7, and an EV to EBITDA multiple of 4.2. These are all slightly higher than the results we get using data from 2021, with multiples of 6.8, 5.5, and 4.1, respectively.
As part of my analysis, I compared The Buckle to the pricing of five similar firms. On a price-to-earnings basis, using data from 2021, four of the five companies had positive results, with their multiples ranging between 8 and 14.1. In this case, The Buckle was the cheapest of the group. Using the price to operating cash flow approach, the range was between 5.2 and 13.4, with one of the five companies being cheaper than our prospect. And using the EV to EBITDA approach, the range was between 2.8 and 6, with two of the five companies being cheaper.
| Company | Price / Earnings | Price / Operating Cash Flow | EV / EBITDA |
| The Buckle | 6.8 | 5.5 | 4.1 |
| Abercrombie & Fitch (ANF) | 8.0 | 5.2 | 2.8 |
| Guess’ (GES) | 9.1 | 13.4 | 4.9 |
| Designer Brands (DBI) | N/A | 9.2 | 6.0 |
| Urban Outfitters (URBN) | 9.8 | 10.0 | 4.9 |
| American Eagle Outfitters (AEO) | 14.1 | 14.4 | 4.0 |
Takeaway
Right now, some investors may be turned off by the fact that bottom line results for The Buckle have worsened some. However, I am encouraged by the fact that we have now seen stabilization when it comes to store count and that we continue to see comparable store sales rise. Profits are still attractive enough to make shares look cheap on an absolute basis and, for the most part, relative to similar players. Because of these factors, I do feel comfortable increasing my rating on the company from a ‘hold’ to a ‘buy’ at this time.
Be the first to comment