

monsitj
Thesis
Meta Platforms (NASDAQ:META) outperforms the S&P 500 (NYSEARCA:SPY) with regards to revenue growth by 300% with regards to profitability by 500% and with regards to R&D by 400%. Moreover, Meta shareholders enjoy significantly higher shareholder distributions, given a >10% buy-back yield, vs. about 3% for the S&P 500.
But most surprisingly, buying Meta is also cheaper than buying the market. As visualized below, for the past 1-year Meta crashed and has lost >50% of equity value as compared to less than 10% for the S&P 500. This is like observing that 2 + 2 suddenly becomes -7. Something doesn’t add up.
Seeking Alpha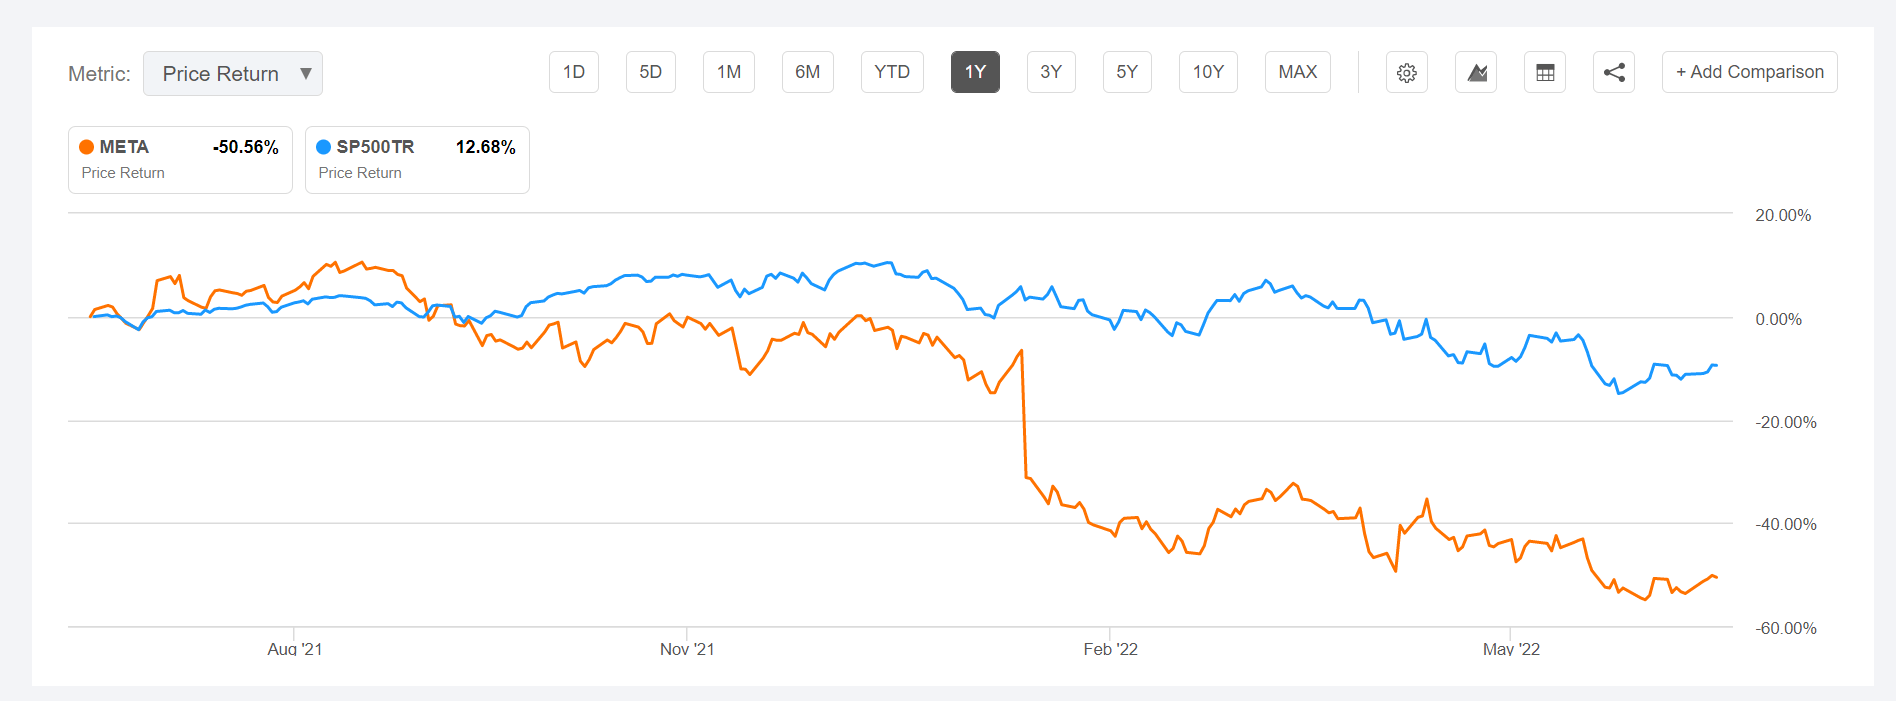
But investors should not complain. In fact, Meta’s deep relative undervaluation opens the opportunity for a potentially highly successful pair trade: buying Meta Platforms and selling the SPY.
The Relative Valuation: Meta vs S&P 500
I introduced this article claiming that Meta is much cheaper than the S&P 500. Now I will support my thesis with the data. First, let us look at the most popular valuation multiple: P/E.
Meta is trading at a x12.95 one-year forward P/E, while the S&P is valued at x16.36. Thus, judged merely based on the price-to-earnings ratio, Meta doesn’t seem that much more a bargain. In fact, one could argue that Meta should be approximately 20% cheaper given the S&P 500 diversification premium. However, the P/E is an incomplete valuation reference, because the metric doesn’t really account for a company’s expected growth.
Here is an example: consider two stocks that are valued at a x10 P/E. However, stock A grows at 5-year CAGR of 3% (in line with nominal GDP growth – the S&P), while stock B grows at x3 nominal GDP, at a CAGR of 9% (high-growth stock such as Meta). After the 5-year period their relative valuation will differ substantially. After 5 years, stock A will trade at a x8.6 P/E, while stock B will trade at a x6.5 P/E. That said, I argue that simply valuing a company based on the current price-to-earnings ratio might cause investors to miss out on a bargain.
That said, I advise to judge a company based on the PEG ratio. The PEG ratio is broadly considered as an informative metric to judge a stock’s relative expensiveness, taking into account both P/E and expected growth. The ratio is calculated as a P/E divided by 3-year CAGR expectation.
Most notably, if we calculate the PEG ratio for both Meta and the S&P 500, we will find that Meta’s PEG is approximately 65% cheaper than the broad market’s x4.24. In addition, please note that my 7% growth estimation for Meta should be highly conservative. Some analysts estimate 3-year CAGR at >10%, including Citi, Morgan Stanley and JPMorgan. (Source: Bloomberg Terminal, July 5th)
Analyst Consensus Estimates; Author’s Calculations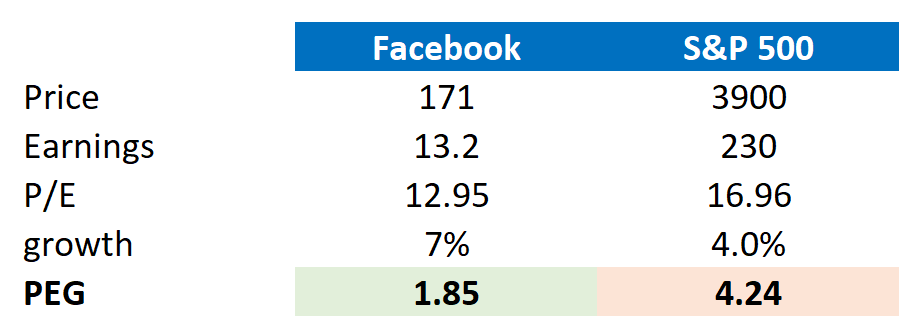
Why Meta will outperform
Now, why do I strongly believe that Meta’s growth will outperform the S&P? First, let us discuss the first argument: R&D investments. If we consider R&D investments as a driver for future growth, as supported by academic literature, then Meta’s >$20 billion investments should clearly indicate future business expansion. Note that Meta is expensing more than 20% of revenues in R&D, but I only estimate a 7% topline growth. This is highly conservative in my opinion, as the economic return per dollar invested should be at least 1:1. If this relationship would hold, Meta should record a 20% topline growth and the company’s PEG would fall to x0.6!
On the other hand, the broad economy generally invests about 3% of GDP in R&D, which is in line with nominal GDP growth. If we consider the S&P 500 as a proxy for the economy, Meta outspends the S&P 500 by approximately 500%.
Moreover, Meta’s growth story is also supported by qualitative arguments. Apart from the metaverse story – which by the way could be a 13 trillion market opportunity as estimated by Citi – Meta’s legacy advertising business has yet to reach full economic maturity as I see significant room for emerging markets expansion. For reference, Asia-Pacific and RoW account for approximately 75% of Meta’s monthly user base, but only for about 30% of revenues. Thus, betting on Meta is also a bet on emerging markets growth potential.
Finally, I argue that Meta’s growth generates much more economic value than what is achieved by the S&P 500. This is simply proven by a comparison of EBIT margins. Meta’s EBIT margin is about 36% versus about 10% for the S&P 500.
Shorting the S&P 500
If Meta is so great, why not simply buy Meta? Why do I also advocate shorting the S&P 500? The argument is simple: I believe the general stock market is going lower – or at least it is an elevated possibility. Investors should consider the current volatile market environment, led by inflation fears, interest rate risks and discussions about a potential recession.
Most notably, as of July 2022, only about 40% of the S&P 500 constituents have lost more than 20% since the index peaked in November 2021 versus about 60% for the 2011, 2015 and 2018 market corrections (Source: Bloomberg Intelligence). This may imply that there is still some market pain outstanding.
That said, while I am happy to assume Meta’s idiosyncratic risk profile, I am less happy to assume a systematic risk coming from a general market-sell off.
Moreover, I believe a short position in the S&P versus a long position in Meta will provide investors some structural alpha, as an EPS slowdown for Meta has been discounted significantly more than for the broad market -despite the fact that most of Meta’s EPS slowdown (advertising) is connected to recessionary fears that are not necessarily idiosyncratic for Meta.
Risks to my thesis
First, the S&P 500 is highly diversified, while Meta Platforms is not (more than 95& of revenues comes from advertising). That said, the major risk to my thesis is that the idiosyncratic risk-profile of Meta performs less well than the general US economy. However, given my arguments, I personally am happy to accept this risk.
Second, much of Meta’s current share price volatility – especially to the downside – is driven by investor sentiment towards stocks, and especially technology companies. Thus, significant volatility could impact the Meta’s relative valuation versus the S&P 500, even though their respective fundamentals remain unchanged.
Third, Meta is exposed to increased regulatory scrutiny, while the S&P 500 is not. Although Meta has largely managed to fend-off anti-trust accusations quite well in the past, a significant regulatory crackdown on Meta is not unthinkable.
Conclusion And Trade Recommendation
I strongly believe that Meta stock is deeply undervalued. However, I also believe that the general stock market is going lower. That said, while I am happy to assume Meta’s idiosyncratic risk profile, I am less happy to assume a systematic risk coming from a general market sell-off. Or in other words: I do not want to miss buying Meta at bargain prices. But I also do not want to get caught in a continuation of the bear-market – which very likely would also depreciate my Meta holding. To buy Meta exposure and hedge the systematic market risk, I advise to initiate a dollar-for-dollar pair trade: go long Meta Platforms and short the SPY.
Be the first to comment