

deberarr
Investment thesis
All of the largest investment banks, The Goldman Sachs Group, Inc. (NYSE:GS), Morgan Stanley (NYSE:MS), and The Charles Schwab Corporation (NYSE:SCHW) reported their third-quarter earnings and investors can see a clear picture of how they performed in high inflation, the bear market environment. In this article, I will compare the 3 largest investment banks and their future potential in the rising interest rate environment. They have slightly different business models, huge differences in their current valuation, and even bigger differences in their income-generating capabilities. Who is going to be a winner in the rest of 2022 and 2023? Let’s find out!
Highlights of GS, MS, and SCHW
Goldman Sachs
Goldman Sachs Group, a financial institution, provides a range of financial services for corporations, financial institutions, governments, and individuals worldwide. GS is one of the largest investment banks in the world. The bank generates most of its revenue from investment banking activities and only a very small portion of its income is related to interest-bearing activities. This means that GS is a cyclical banking stock and when the external macroeconomic factors are great the bank can generate a substantial amount of extra revenue. When times are not so delightful the bank’s revenue drops significantly, especially in the investment banking part of their revenue.
The chart is created by the author. All figures are from the company’s financial statements.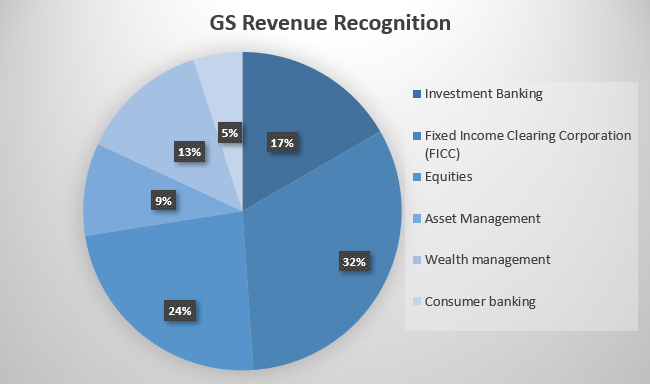
GS’ revenue growth is much more hectic than its peers (more on that later). With the rise of interest rates diversified banks and regional banks have already experienced great revenue growth while investment banks still struggle due to external economic factors. The third quarter results were a positive surprise because the setback was less than expected. The company reported an EPS of $8.25, approximately 9.9% better than the expected $7.51 figure. It means a 6.7% EPS increase quarter-on-quarter however still a massive decline (44.7%) year-on-year basis. Asset management revenues and global market revenues are making a comeback while investment banking still struggles. However, the growth in the asset management segment was still mainly due to the acquisition of NN Investment Partners at the beginning of the second quarter. The total revenue of the bank has started to slowly climb back and the American region has compensated for the losses of the EMEA and Asia regions. The net revenue in the third quarter was up by 0.94% Q-o-Q and down by 12% Y-o-Y basis. Although investors should be aware that 2021’s extremely cash-rich environment was not normal circumstances therefore the overly positive earnings reflected that. The bank’s management has always been one of the fastest-reacting managements in the financial industry. They make even radical decisions fairly quickly compared to their peers and that is why they became one of the largest investment banks in the world. The company was the first major bank to respond to the slowing economy in July by announcing potential job cuts. This decision has come into effect later on as the management proactively did make job cuts in September. According to the management, the share buyback program will continue in the future and capital return to shareholders will not stop: “While we will continue to deploy capital in our business where returns are accretive, we are actively evaluating share repurchases in light of our current stock price.” GS bought back 3 million shares in the third quarter at an average cost of $332.32.
The biggest risk Goldman Sachs faces is the negative macroeconomic trend and a potentially deep recession. Due to the nature of its revenue and its cyclical business if the external economic factors turn from the current bad situation to worse the bank will feel the impact. GS’ business profitability is strongly correlated to the health of the U.S. and the global economy. In case of a deep recession, the stock price can plummet into the $220-240 territory. As inflation seems to be under control and since June the U.S. inflation is slowly but steadily decreasing I cannot see this scenario unfolding right now. I believe that after the Fed will stop the rate increases markets will have liquidity once again, and GS’ profitability will start to increase, hand in hand with its stock price.
Morgan Stanley
Morgan Stanley helps individuals, families, institutions, and governments raise, manage and distribute the capital they need to achieve their goals. MS with its ~4% dividend yield, great business model, and valuation can be value and income investors’ dream, can it be? Its largest income stream comes from the asset management segment with over 36% of the total revenue. The bank is strong in trading activities as well and they also have an interest income segment that has seen record profit in the last quarter (and I expect these profits to rise further in Q4 and Q1 2023 as well).
The chart is created by the author. All figures are from the company’s financial statements.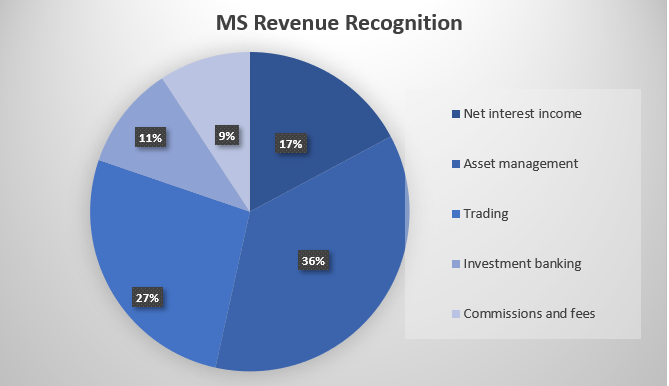
Due to its cyclical nature trading and investment banking revenues have seen many ups and downs in the last years. Investment banking revenue is down by 54% Y-o-Y which is worse than most of its peers but the interest income compensated for these losses. The NII grew by 10% Q-o-Q and 22% Y-o-Y. Despite the growth in the interest income segment and the EPS growth of 5.8% compared to the second quarter results, revenue fell short of expectations. In the future, the main catalyst of revenue growth will be the bank’s asset management segment. It is already MS’ biggest revenue segment with close to $20 billion by the end of 2022 and over $21-22 billion by the end of next year. This is mainly due to the low-cost deposits they have gathered previously. MS acquired E*Trade which had 5.2 million customers and more than $350 billion in assets at a time when the deposit yield curve was flat.
The high-interest rate environment will hurt the investment banking segment and it will continue to underperform in my opinion even in the first half of 2023. This is strongly correlated with the Fed’s hawkish policy. IPOs have dried up almost entirely this year. While in 2021 more than 1000 companies went public, this number is less than 170 this year so far. In terms of M&A transactions the same can be said, investors can see a much lower volume that in 2021 or even 2020. MS is one of the leading investment banks in the Twitter acquisition which is unlikely to be closed soon.
I believe in the fourth quarter and the first half of 2023 the investment banking segment will start to recover relatively slowly while the asset management segment will flourish as the markets start to recover. At the same time due to the further 1.5-2% interest rate increase during the next 4-6 months, the NII will jump even higher helping MS’ revenue recovery. As I said earlier GS is almost always the first management team to react to changing market conditions while MS’ management is a bit more conservative. By October, GS has already started the job cuts and MS’ CEO only suggested that job cuts may be in the works. It is because the two business models are different and Morgan Stanley is less cyclical than its peer Goldman Sachs.
Charles Schwab
Charles Schwab, provides wealth management, securities brokerage, banking, asset management, custody, and financial advisory services. It is closer to the diversified banking sector than any of its peers due to its interest income segment. Diversified banks usually have 45-60% of their revenue recognized from interest income while in the investment bank segment it is usually below 20%. Half of SCHW’s revenue comes from interest-bearing activities. Net interest revenue comes primarily from cash balances in client accounts and loans. The largest part of non-interest revenue comes from asset management/administration fees and trading revenues.
The chart is created by the author. All figures are from the company’s financial statements.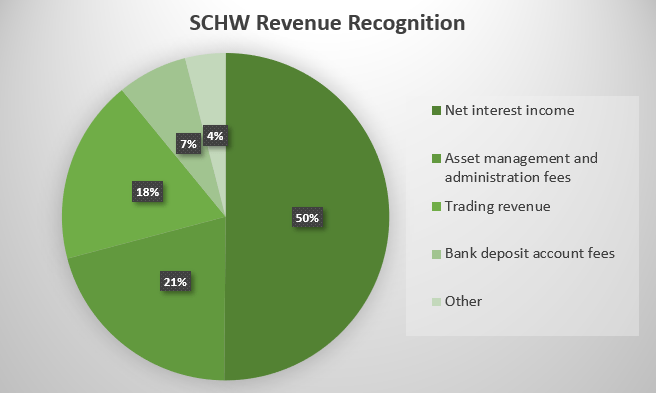
On the other hand, SCHW only seems like a diversified bank because of its revenue streams but they are an investment bank. The company has more than 33 million active brokerage accounts, 2.2 million corporate retirement plan participants, and 1.6 million bank accounts. A major part of their revenue is the investments of clients’ unused cash. The bank likes to gather as many deposits and cash as possible and invest to earn interest on them. This is particularly useful in an increasing interest rate environment. This is why their revenue was not affected by the bear market but due to the rapidly rising interest rates, their revenue is up by 20% Y-o-Y. The further rise of interest rates would cause Schwab’s non-interest income segment to decline, mainly the bank deposit revenues and its trading segment but this will be likely offset by the gain in the interest income segment.
We have already seen this trend unfolding in the third quarter results. The bank surpassed analysts’ expectations in its Q3 results. They reported an EPS of $1.10, 4.8% higher than the expectation of $1.05 and 31% higher than Q3 2021. Investors have seen the same in its revenue growth, it outperformed previous expectations and grew by 20.4% Y-o-Y. The decline in trading revenue was not so bad with only 3.5% shy of Q3 2021 figures and a growth of 5.1% Q-o-Q but the trading volume was significantly less, with a daily average of 5.5 million compared to 6.2 million compared to the second quarter.
I believe that the management made a good decision with the TD-Ameritrade acquisition back in 2020. Interestingly the transaction happened almost at the same time as MS acquired E*Trade. I think the reason behind both acquisitions was the same, to get deposits in a cheap deposit environment and then capitalize on them in a rising interest rate environment. The management expects the TD-Ameritrade acquisition to be fully completed at the beginning of 2024 with the joint platform and full business integration. They estimate that the total synergies will be around $4.3-4.8 billion, implying revenue synergies of $2.5-$2.8 billion. The management also actively uses new tools and products to win new clients. The latest innovative product is Schwab Personalized Indexing. It allows investors to own individual stocks that reflect the characteristics of the index and tax-loss harvesting. It is a strategy that can help offset capital gains and lower taxable income by automatically selling a security that has fallen below the price the client paid for it and replacing it with alternate security in the same asset class.
Within the next years, I see no major risk factor for SCHW despite the obvious reputation loss risk factor. 2 years ago my thought was that new emerging fintech companies such as Robinhood (HOOD) or Acorns can disrupt the traditional big players but this has not been the case. Those companies target the younger generation with less money to invest but the stability and brand name still attract wealthier investors to SCHW.
Valuation comparison – Goldman Sachs Vs. Morgan Stanley Vs. Charles Schwab
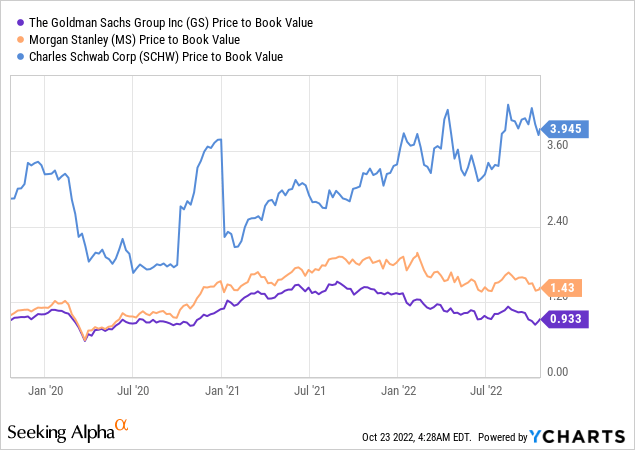
Using Warren Buffett’s valuation for banks investors can see that Goldman Sachs is the best choice based on this metric. If a bank earns 1% on its assets it should trade at 1x its book value to be fairly valued and below to be undervalued. If a bank’s ROA is less than 1% it should be trading below its book value and if a bank earns more than 1% on its assets it can be traded above its book value. GS’ ROA is 1.00 and it is trading at 0.93x its book value so it is undervalued. MS’ ROA is 1.2% and it is trading at 1.43x its book value so the fair value for the stock would be around $66.5. With SCHW investors might see a weird number because its ROA is 1.15% and it is trading well above its book value, its P/B is 3.95. Calculating with this ROA to P/B ratio SCHW’s fair value would be around $20. The last time it traded at $20 was back in 2013 so it would be foolish to say SCHW is extremely overvalued. The reason behind this extreme number is that Schwab has been trading well above its book value for a long time and its 5-year average is not even close to 1x its book value. However, SCHW is slightly overvalued based on its P/B ratio because it is approximately 24% higher than its 5-year average. At the same time, GS is slightly undervalued. Its current P/B is 5% lower than its 5-year average, and MS is fairly valued with its current P/B 8.5% higher than its 5-year average.
Looking at the 3 bank’s P/E ratios the winner is Goldman Sachs with a forward earnings multiple of 9.5. It is trading at its 5-year average while MS trades approximately 9.6% above its long-term P/E average. SCHW has a very high P/E ratio compared to its peers but its 5-year average is even 10% higher than the forward P/E ratio of 17.9 so we can say it is trading on a relatively fair valuation, probably slightly overvalued. All of the banks are well capitalized and also well above the regulatory 8% requirement of the CET1 ratio. GS and MS are both about 5.5% above the requirement and SCHW is about 9.5% above the regulatory minimum due to the relatively low-risk nature of its balance sheet assets.
Let’s have a look at the 3 banks’ cyclical nature. GS has the highest beta of 1.35 among them, MS has a slightly lower beta of 1.33 and SCHW is the most conservative of all with a beta of 0.99. If we take a look at their revenue growth, we can see the same cycles and risks associated with their beta number. Goldman Sachs has the most volatile revenue growth; it can shrink faster than its peers (-19%) but in good times rise faster (42%). MS’ revenue growth is a bit more stable than GS’ and SCHW has not seen a decline in revenue in the last 9 years.
The chart is made by the author. All figures are from the companies’ financial statements.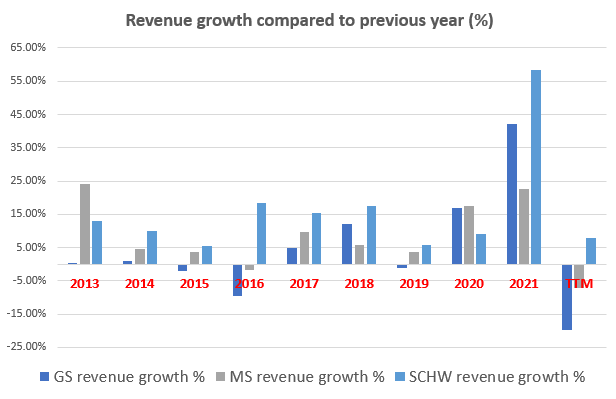
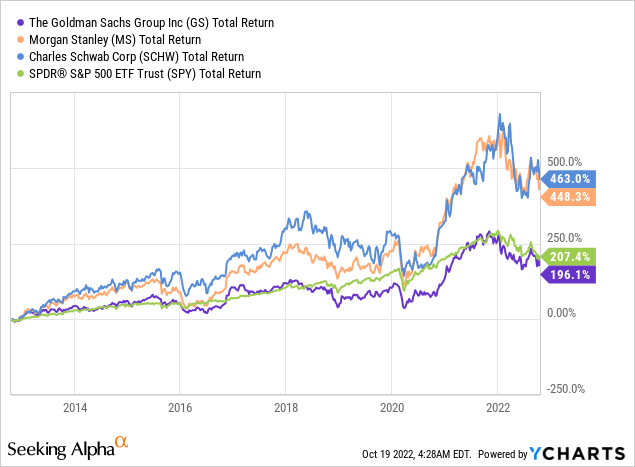
In terms of total return, investors can expect that their investment banking stocks will have similar cycles to the general market. It is logical because the investment banking sector is highly correlated with the health of the economy and its growth.
Dividend comparison
GS pays dividends consecutively since its 1999 IPO, MS had its IPO in 1986 but only pays consecutive dividends since 1997 and SCHW pays consecutive dividends since 1989 almost from its 1987 IPO. This makes SCHW the winner. It has the longest consecutive years of dividend payments among the 3 banks. GS has the longest consecutive years of dividend growth with 10 years compared to MS’ 8 years and SCHW’s 1 year. In terms of dividend coverage investors do not have to worry, all of them are between 18-50%. Charles Schwab has the lowest payout ratio of approximately 19%, Goldman is the second place with about 22% and Morgan Stanley is third with approximately 46%. All of them have share buyback programs so the total cash return highly depends on the share repurchases but let’s have a look at next year’s estimates. The ranking remains the same, with analysts estimating a 10+% per year increase for SCHW, approximately 7% per year for GS, and approximately 5% per year for MS.
Goldman’s and Schwab’s management did not comment on dividends in the last 9 months except for the announcement of dividend increases so this means that they are not planning any massive changes in their dividend policy. Morgan Stanley’s CEO made some interesting comments about what investors can expect in the future in terms of MS’ dividend policy. “Having a dividend that’s aligned to the more stable earnings from Wealth and Investment Management is a leading priority of this firm” James Gorman – Chairman and CEO. Until James Gorman remains CEO investors should not expect special dividends even in great times because he emphasized that he wants a strong and attractive dividend but also to invest in the company rather than give out special dividends: “So the only thing we haven’t done with excess capital does a special dividend. And that’s something I’m just personally not a fan of.”
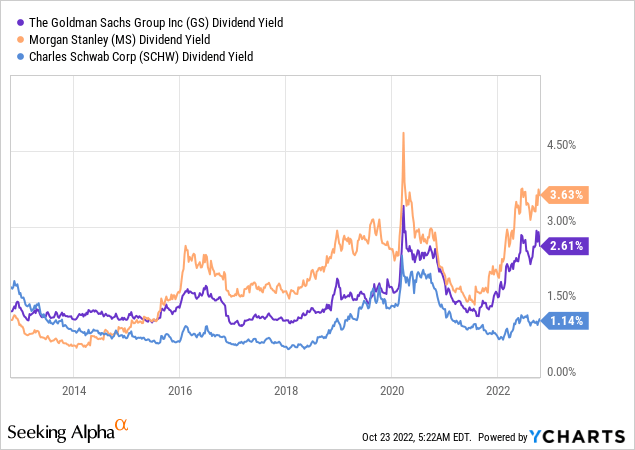
Last but not least the current dividend yield. Until now in almost all the dividend metrics SCHW was the winner but taking into consideration the dividend yields the ranking changes significantly. Income investors will never choose SCHW for its dividend because it only trades at slightly above 1% and the current yield is just a bit over its 10-year average. GS is trading at its best yield in the last 10 years except for the short spike during the start of the pandemic and MS is exactly the same. In this high inflationary environment, I am sure that income investors will not even consider yields under 2% but MS’ almost 4% could be a decision-making point among the 3 banks.
Investor takeaway
Buying good banks at or near tangible book value has been proven to be a very successful investment. Goldman Sachs is the one among the 3 banks that are trading below its book and tangible book value so, from a valuation perspective, it is the winner. Comparing the dividend yields the clear winner is Morgan Stanley with its 3.9% dividend yield and the second place is far behind with only 2.7%. In terms of future interest income, and revenue growth the absolute winner is Charles Schwab. So in every bank, there is something valuable depending on the priorities of the investor. But to give you my final order: The first place goes to MS because of its diversified business model and its dividend yield. The second place is GS because of its attractive valuation and the third place is SCHW due to its interest income growth potential. What are your 1st 2nd and 3rd place and why?
Be the first to comment